| Param | Original file | Final file |
|---|---|---|
| Filename | modeM0/AS1A14_049T03_9000006570_57326cztM0_level2.fits | modeM0/AS1A14_049T03_9000006570_57326cztM0_level2_quad_clean.evt |
| Size (bytes) | 664,416,000 | 97,202,880 |
| Size | 633.6 MB | 92.7 MB |
| Events in quadrant A | 5,288,632 | 659,897 |
| Events in quadrant B | 3,671,053 | 724,395 |
| Events in quadrant C | 5,180,268 | 616,626 |
| Events in quadrant D | 9,896,479 | 440,498 |
| Mode M0 | |||
|---|---|---|---|
| Quadrant | BADHDUFLAG | Total packets | Discarded packets |
| A | 0 | 20739 | 0 |
| B | 0 | 16103 | 0 |
| C | 0 | 20221 | 0 |
| D | 0 | 34377 | 0 |
| Mode SS | |||
|---|---|---|---|
| Quadrant | BADHDUFLAG | Total packets | Discarded packets |
| A | 0 | 144 | 0 |
| B | 0 | 144 | 0 |
| C | 0 | 144 | 0 |
| D | 0 | 144 | 0 |
| Quadrant | Total seconds | Saturated seconds | Saturation percentage |
|---|---|---|---|
| A | 7198 | 273 | 3.792720% |
| B | 7199 | 98 | 1.361300% |
| C | 7199 | 312 | 4.333935% |
| D | 7199 | 2337 | 32.462842% |
Noise dominated data is calculated using 1-second bins in cleaned event files. If a bin has >2000 counts, and if more than 50% of those come from <1% of pixels, then it is considered to be noise-dominated and hence unusable.
| Quadrant | # 1 sec bins | Bins with >0 counts | Bins with >2000 counts | High rate bins dominated by noise | Noise dominated (total time) | Noise dominated (detector-on time) | Marked lightcurve |
|---|---|---|---|---|---|---|---|
| A | 7198 | 7198 | 245 | 245 | 3.40% | 3.40% | 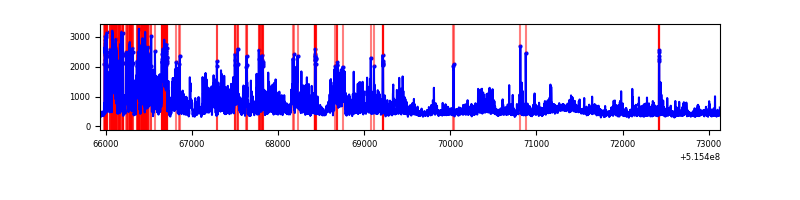 |
| B | 7199 | 7199 | 41 | 41 | 0.57% | 0.57% | 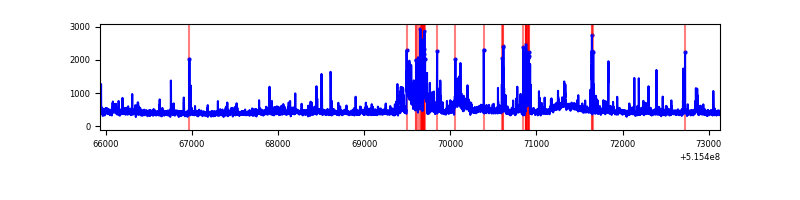 |
| C | 7199 | 7199 | 282 | 282 | 3.92% | 3.92% | 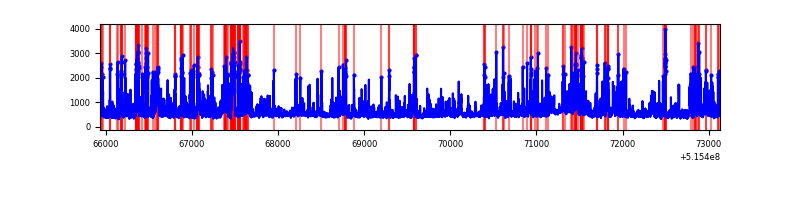 |
| D | 7199 | 7199 | 1986 | 1986 | 27.59% | 27.59% | 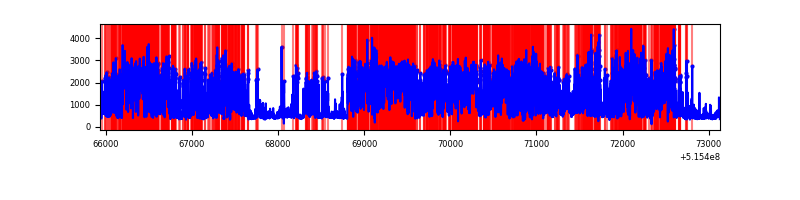 |
Top three noisy pixels from each quadrant. If the there are fewer than three noisy pixels in the level2.evt file, extra rows are filled as -1
| Pixel properties | Quadrant properties | ||||||
|---|---|---|---|---|---|---|---|
| Quadrant | DetID | PixID | Counts | Sigma | Mean | Median | Sigma |
| A | 0 | 12 | 1249948 | 6644.44 | 757 | 738 | 188.0 |
| A | 10 | 251 | 1008346 | 5359.38 | 757 | 738 | 188.0 |
| A | 3 | 14 | 60402 | 317.35 | 757 | 738 | 188.0 |
| B | 0 | 213 | 339744 | 2082.72 | 758 | 728 | 162.8 |
| B | 5 | 185 | 114669 | 699.99 | 758 | 728 | 162.8 |
| B | 7 | 252 | 80450 | 489.77 | 758 | 728 | 162.8 |
| C | 15 | 224 | 1487770 | 7523.66 | 730 | 723 | 197.6 |
| C | 14 | 254 | 245713 | 1239.52 | 730 | 723 | 197.6 |
| C | 12 | 252 | 116314 | 584.83 | 730 | 723 | 197.6 |
| D | 3 | 224 | 6435217 | 35381.03 | 644 | 613 | 181.9 |
| D | 7 | 96 | 375489 | 2061.28 | 644 | 613 | 181.9 |
| D | 2 | 249 | 268372 | 1472.29 | 644 | 613 | 181.9 |
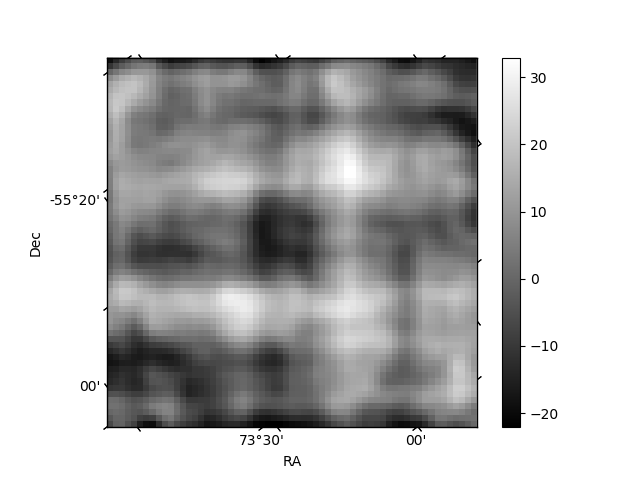
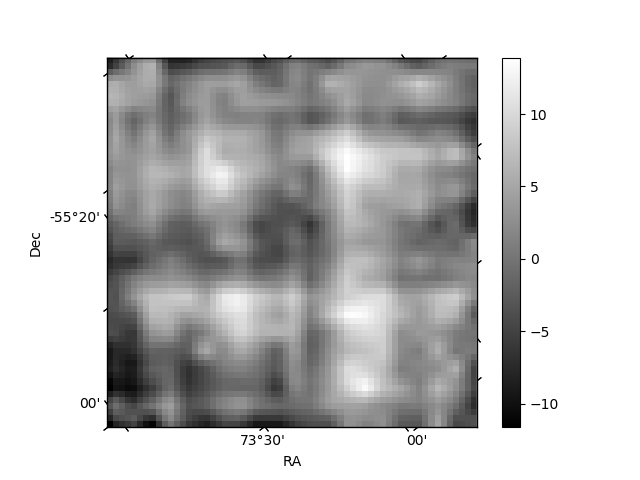
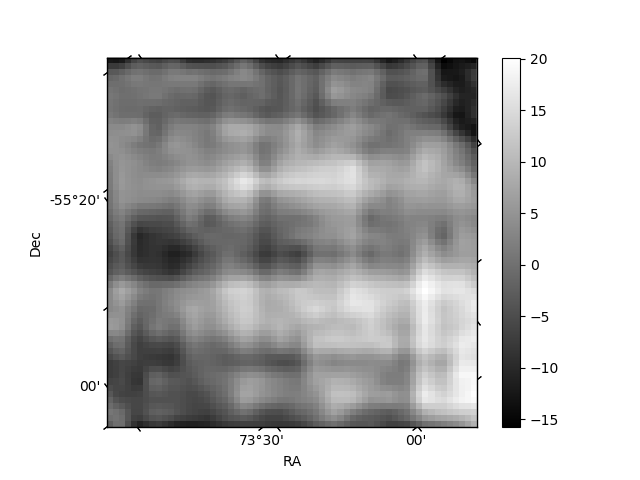
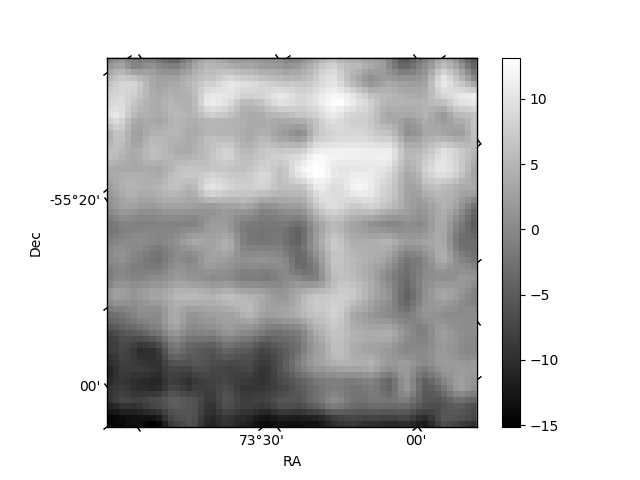
Histogram calculated using DETX and DETY for each event in the final _common_clean file
| Quadrant A | 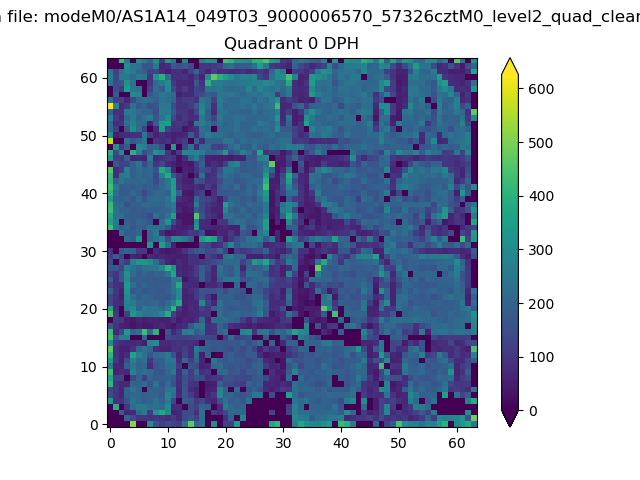 |
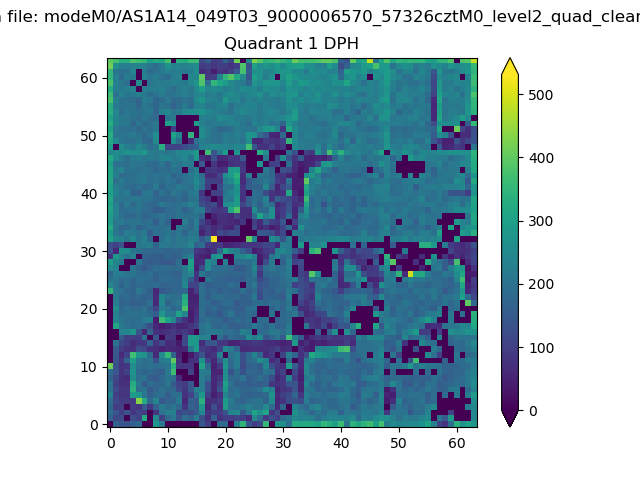 |
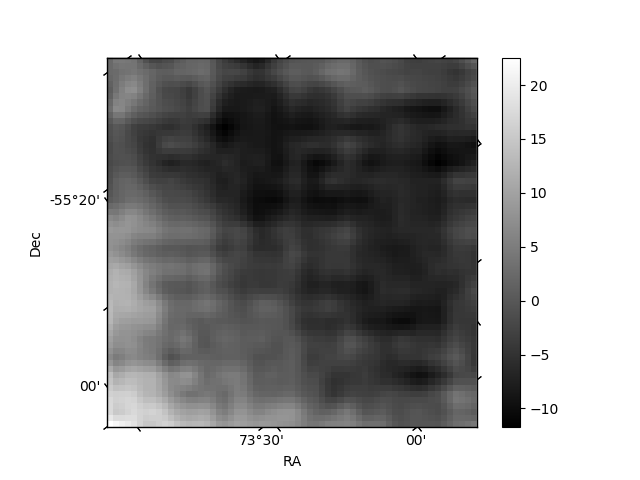
Quadrant B |
|---|---|---|---|
| Quadrant D | 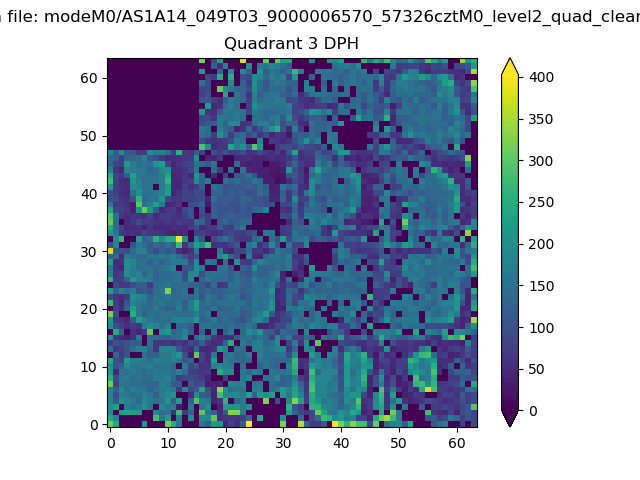 |
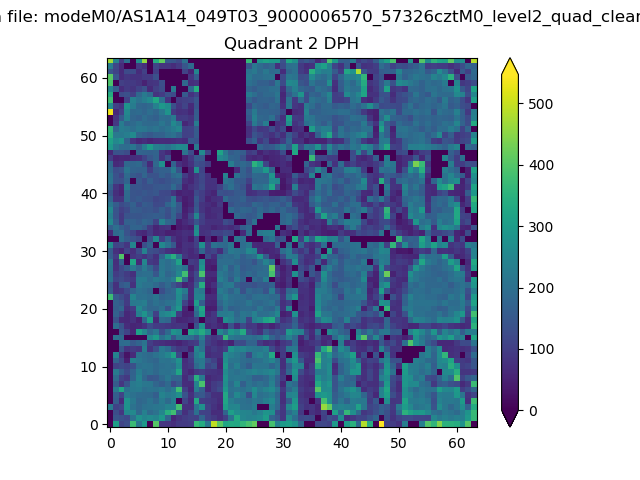 |
Quadrant C |
| Plot type | Count rate plots | Images |
|---|---|---|
| Comparison with Poisson distribution Blue bars denote a histogram of data divided into 1 sec bins. Red curve is a Poisson curve with rate = median count rate of data. |
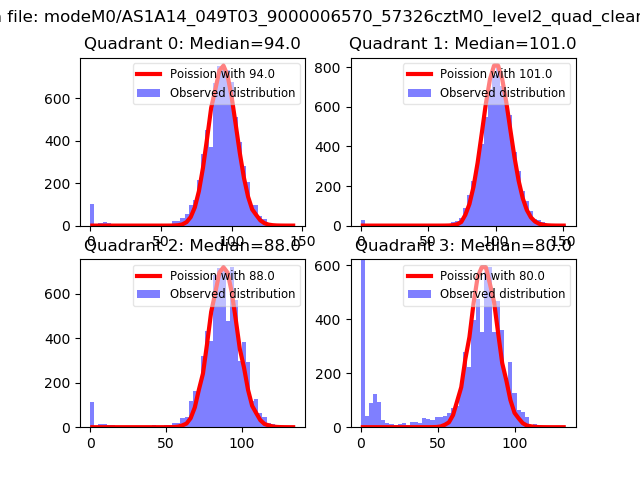 |
 |
| Quadrant-wise count rates Data is divided into 100 sec bins |
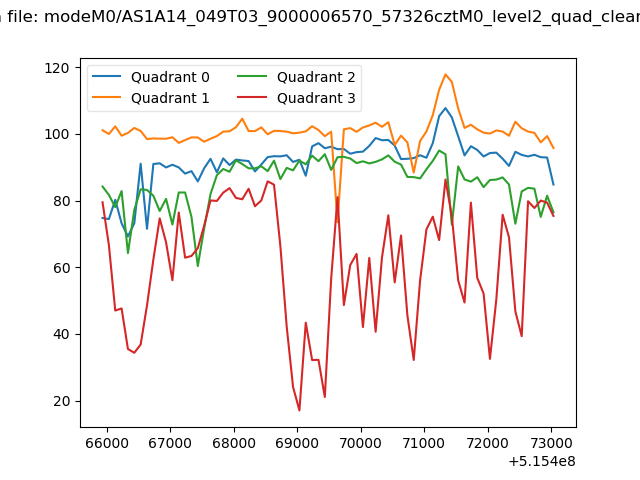 |
|
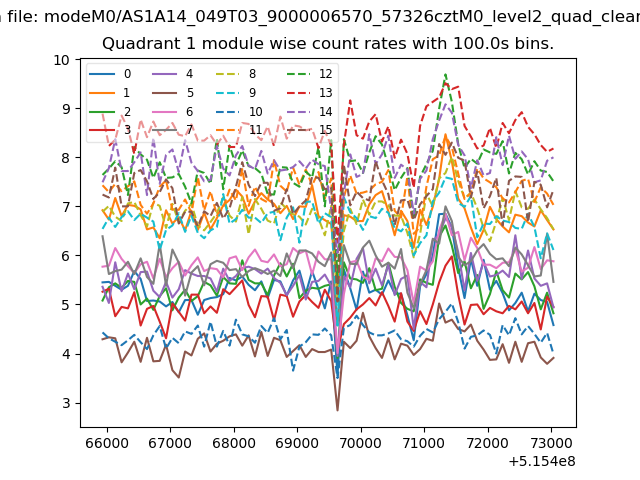
| Module-wise count rates for Quadrant A Data is divided into 100 sec bins |
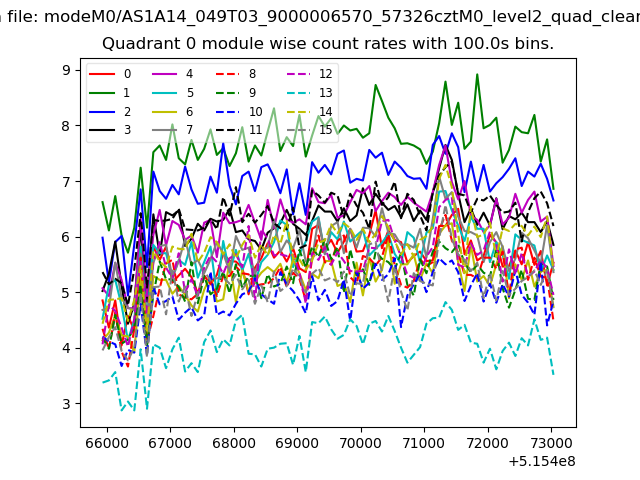 |
 |
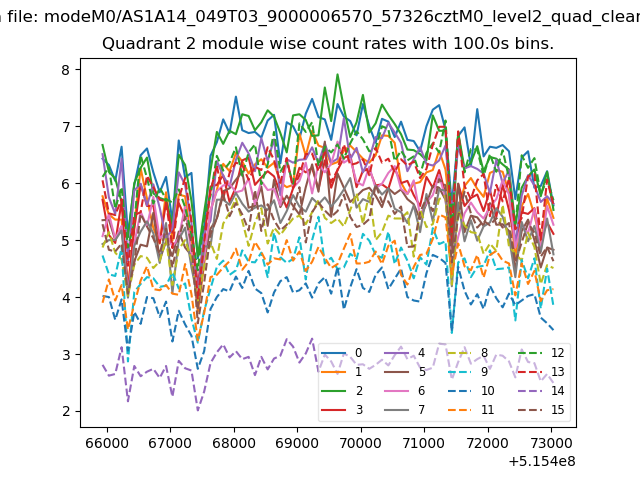
| Module-wise count rates for Quadrant B Data is divided into 100 sec bins |
 |
 |
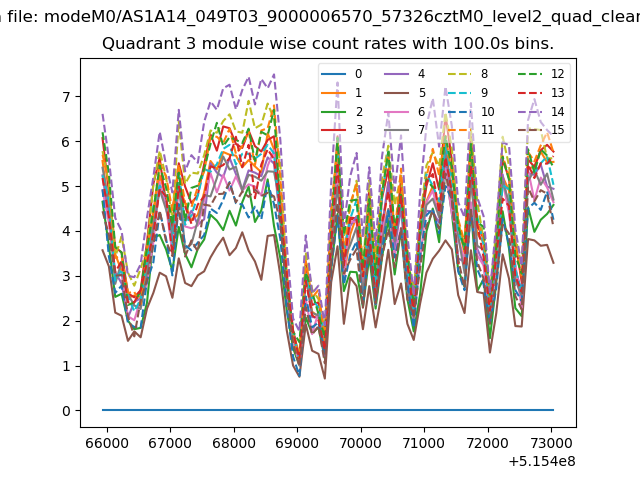
| Module-wise count rates for Quadrant C Data is divided into 100 sec bins |
 |
 |
| Module-wise count rates for Quadrant D Data is divided into 100 sec bins |
 |
 |
| Parameter | Plot |
|---|---|
| CZT HV Monitor | 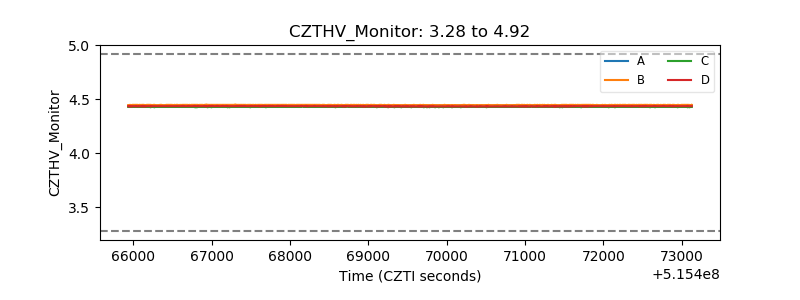 |
| D_VDD | 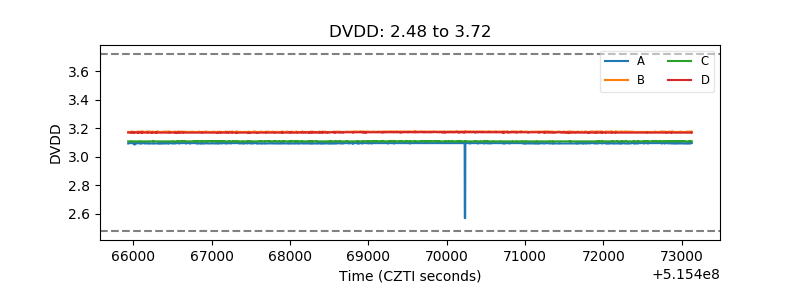 |
| Temperature 1 | 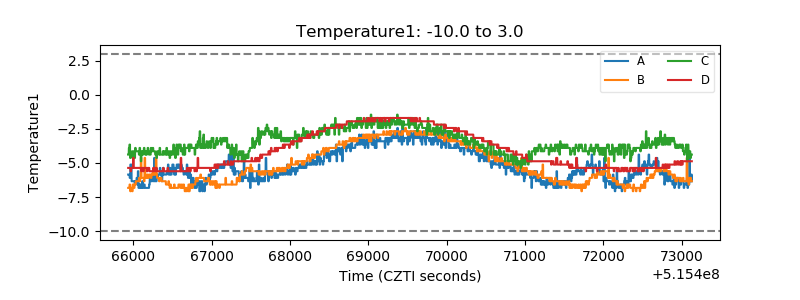 |
| Veto HV Monitor | 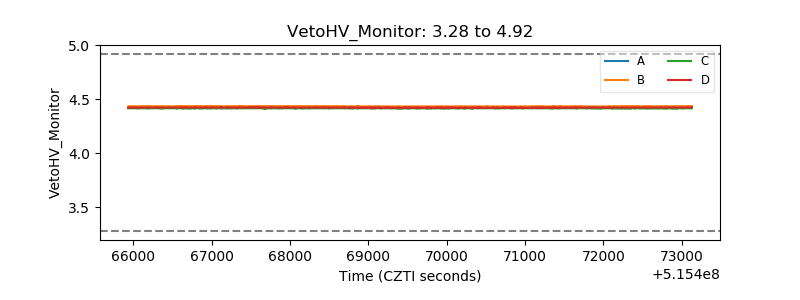 |
| Veto LLD | 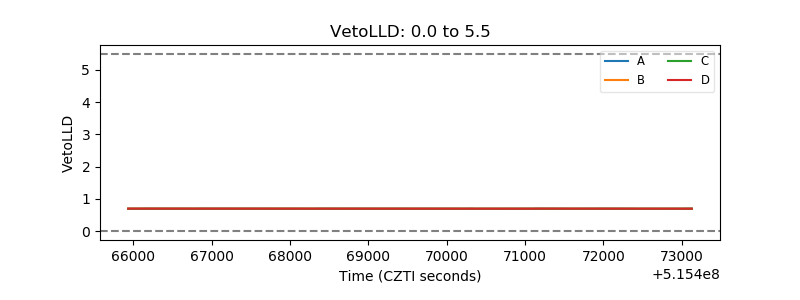 |
| Alpha Counter | 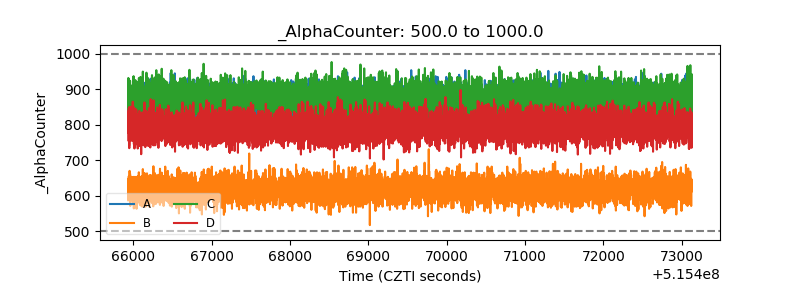 |
| _CPM_Rate | 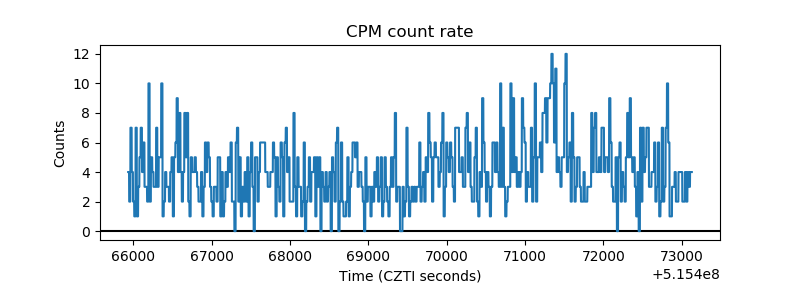 |
| CZT Counter | 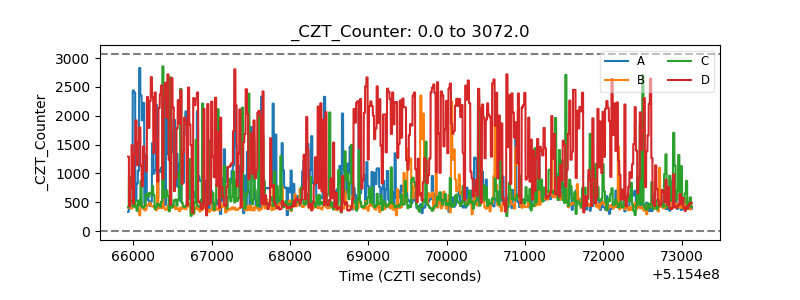 |
| +2.5 Volts monitor | 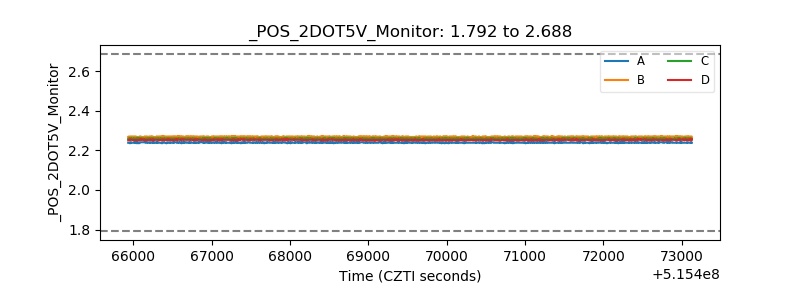 |
| +5 Volts monitor |  |
| _ROLL_ROT | 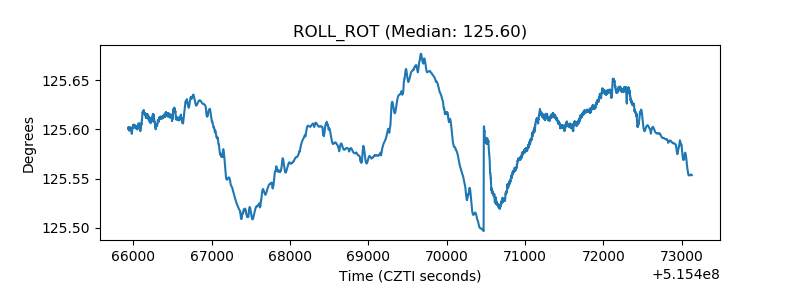 |
| _Roll_DEC | 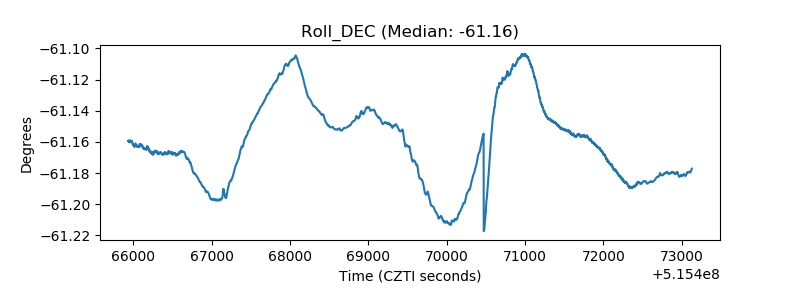 |
| _Roll_RA | 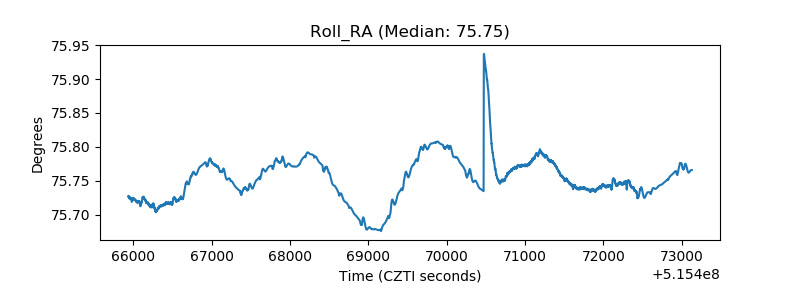 |
| Veto Counter | 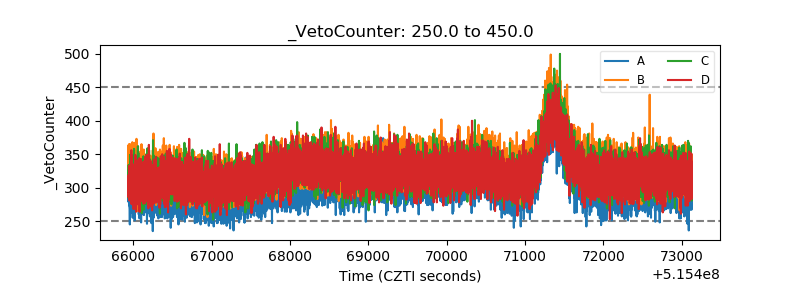 |