| Param | Original file | Final file |
|---|---|---|
| Filename | modeM0/AS1A14_049T03_9000006570_57329cztM0_level2.fits | modeM0/AS1A14_049T03_9000006570_57329cztM0_level2_quad_clean.evt |
| Size (bytes) | 1,590,243,840 | 261,288,000 |
| Size | 1.5 GB | 249.2 MB |
| Events in quadrant A | 11,956,507 | 1,775,028 |
| Events in quadrant B | 9,210,134 | 1,907,914 |
| Events in quadrant C | 16,413,023 | 1,510,001 |
| Events in quadrant D | 19,797,979 | 1,391,850 |
| Mode M0 | |||
|---|---|---|---|
| Quadrant | BADHDUFLAG | Total packets | Discarded packets |
| A | 0 | 49151 | 2 |
| B | 0 | 41410 | 2 |
| C | 0 | 62292 | 2 |
| D | 0 | 72012 | 2 |
| Mode M9 | |||
|---|---|---|---|
| Quadrant | BADHDUFLAG | Total packets | Discarded packets |
| A | 0 | 10 | 0 |
| B | 0 | 10 | 0 |
| C | 0 | 10 | 0 |
| D | 0 | 10 | 0 |
| Mode SS | |||
|---|---|---|---|
| Quadrant | BADHDUFLAG | Total packets | Discarded packets |
| A | 0 | 386 | 0 |
| B | 0 | 386 | 0 |
| C | 0 | 386 | 0 |
| D | 0 | 386 | 0 |
| Quadrant | Total seconds | Saturated seconds | Saturation percentage |
|---|---|---|---|
| A | 19248 | 502 | 2.608063% |
| B | 19249 | 468 | 2.431295% |
| C | 19249 | 2469 | 12.826640% |
| D | 19249 | 3388 | 17.600914% |
Noise dominated data is calculated using 1-second bins in cleaned event files. If a bin has >2000 counts, and if more than 50% of those come from <1% of pixels, then it is considered to be noise-dominated and hence unusable.
| Quadrant | # 1 sec bins | Bins with >0 counts | Bins with >2000 counts | High rate bins dominated by noise | Noise dominated (total time) | Noise dominated (detector-on time) | Marked lightcurve |
|---|---|---|---|---|---|---|---|
| A | 20138 | 19250 | 177 | 177 | 0.88% | 0.92% | 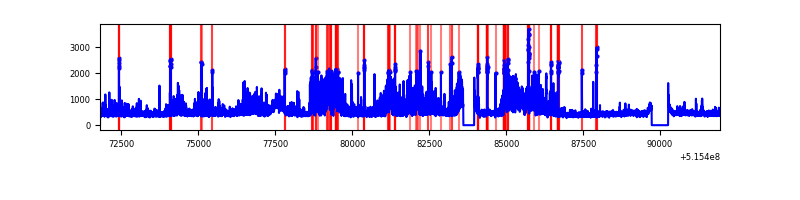 |
| B | 20139 | 19251 | 83 | 83 | 0.41% | 0.43% | 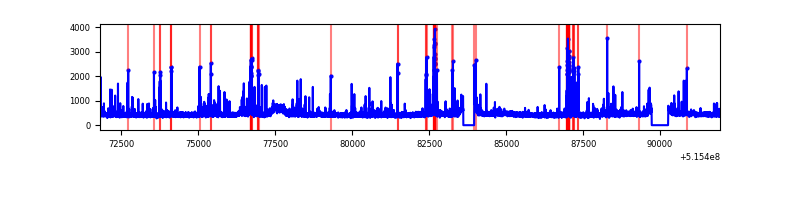 |
| C | 20139 | 19251 | 1790 | 1790 | 8.89% | 9.30% | 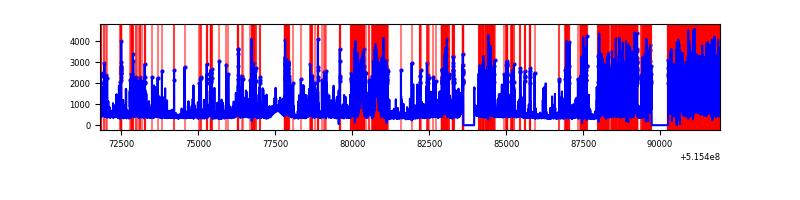 |
| D | 20139 | 19250 | 2435 | 2435 | 12.09% | 12.65% | 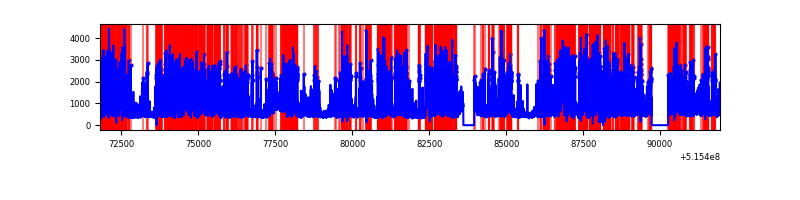 |
Top three noisy pixels from each quadrant. If the there are fewer than three noisy pixels in the level2.evt file, extra rows are filled as -1
| Pixel properties | Quadrant properties | ||||||
|---|---|---|---|---|---|---|---|
| Quadrant | DetID | PixID | Counts | Sigma | Mean | Median | Sigma |
| A | 0 | 12 | 3634138 | 7045.89 | 2090 | 2035 | 515.5 |
| A | 10 | 251 | 84240 | 159.47 | 2090 | 2035 | 515.5 |
| A | 11 | 14 | 42441 | 78.38 | 2090 | 2035 | 515.5 |
| B | 5 | 185 | 228750 | 514.1 | 2067 | 1984 | 441.1 |
| B | 7 | 252 | 210244 | 472.14 | 2067 | 1984 | 441.1 |
| B | 10 | 247 | 187076 | 419.62 | 2067 | 1984 | 441.1 |
| C | 15 | 224 | 7602639 | 14679.46 | 1927 | 1906 | 517.8 |
| C | 14 | 254 | 380141 | 730.49 | 1927 | 1906 | 517.8 |
| C | 12 | 252 | 346450 | 665.43 | 1927 | 1906 | 517.8 |
| D | 3 | 224 | 9321702 | 17466.14 | 1903 | 1819 | 533.6 |
| D | 2 | 249 | 911594 | 1704.98 | 1903 | 1819 | 533.6 |
| D | 8 | 240 | 819982 | 1533.3 | 1903 | 1819 | 533.6 |
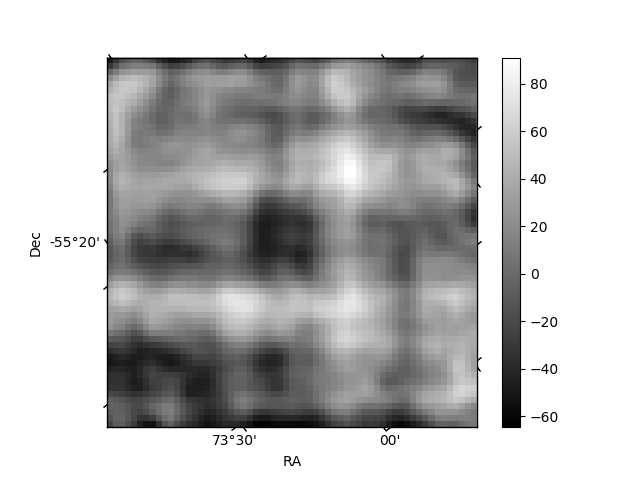
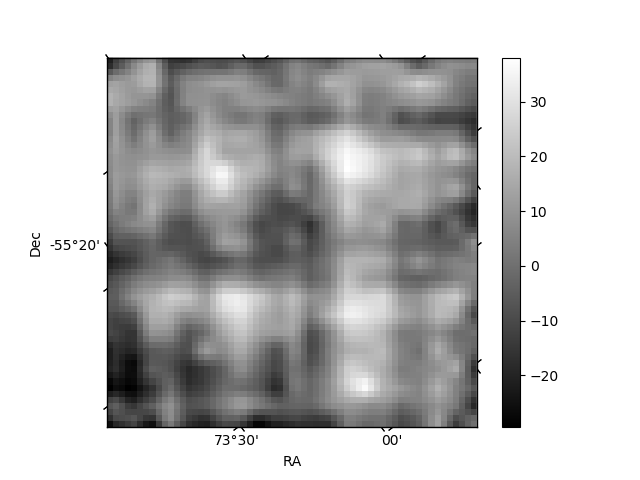
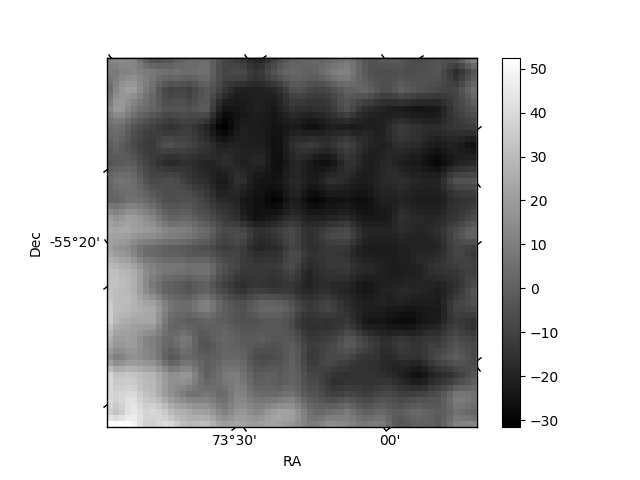
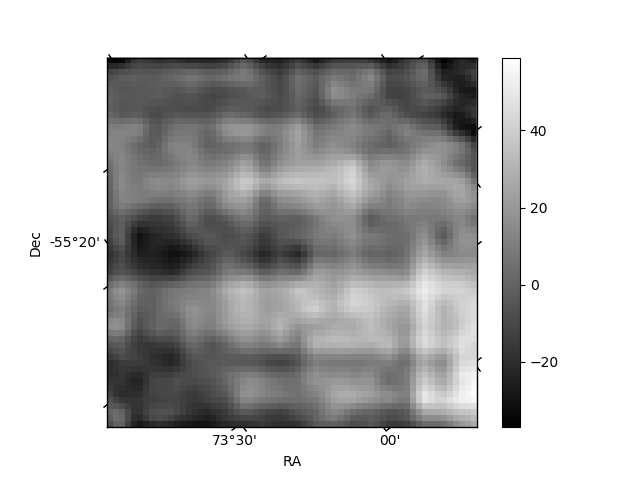
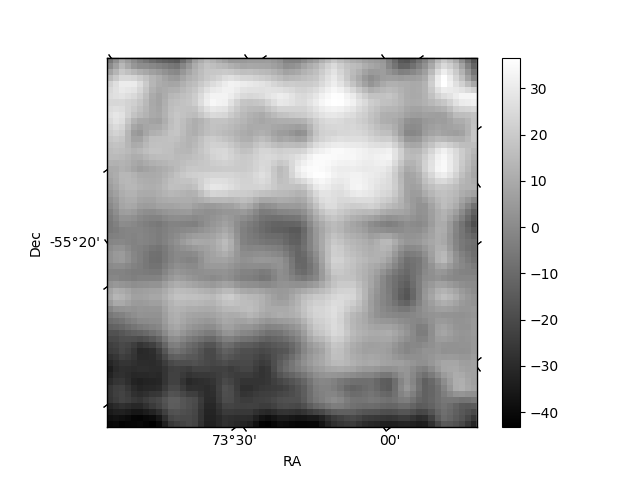
Histogram calculated using DETX and DETY for each event in the final _common_clean file
| Quadrant A | 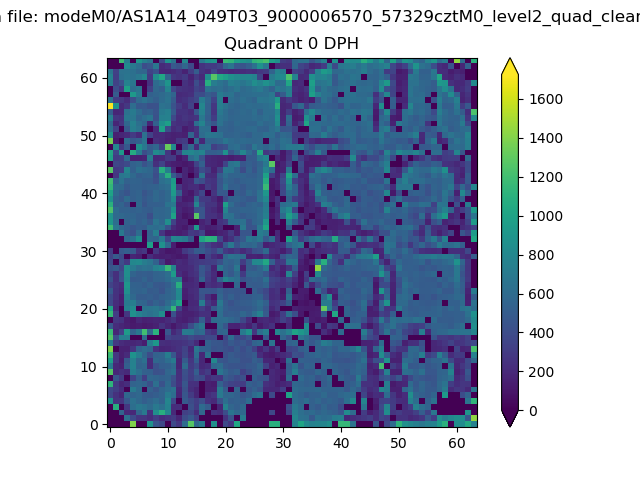 |
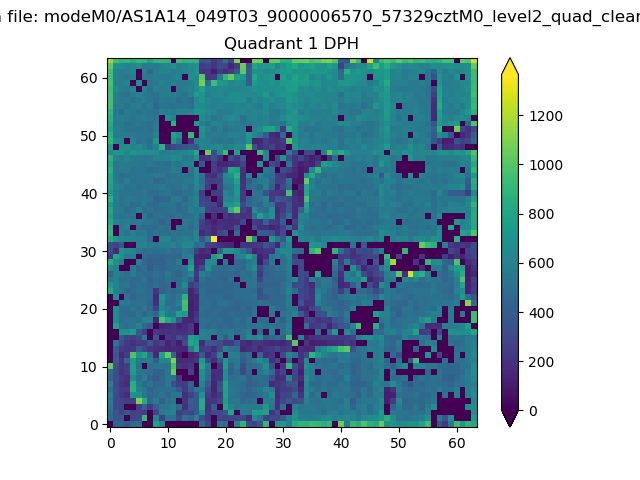 |
Quadrant B |
|---|---|---|---|
| Quadrant D | 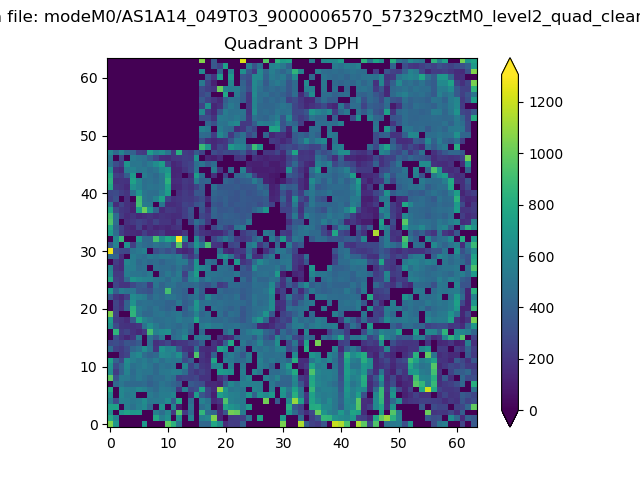 |
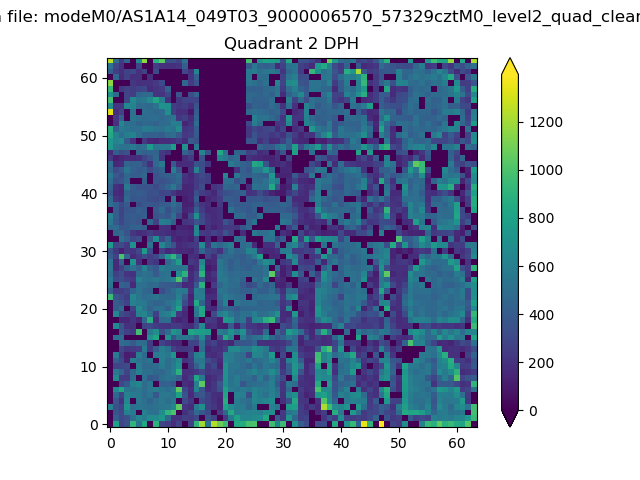 |
Quadrant C |
| Plot type | Count rate plots | Images |
|---|---|---|
| Comparison with Poisson distribution Blue bars denote a histogram of data divided into 1 sec bins. Red curve is a Poisson curve with rate = median count rate of data. |
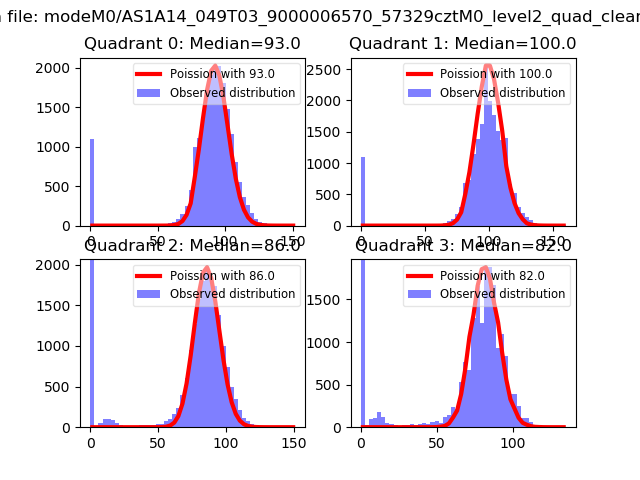 |
 |
| Quadrant-wise count rates Data is divided into 100 sec bins |
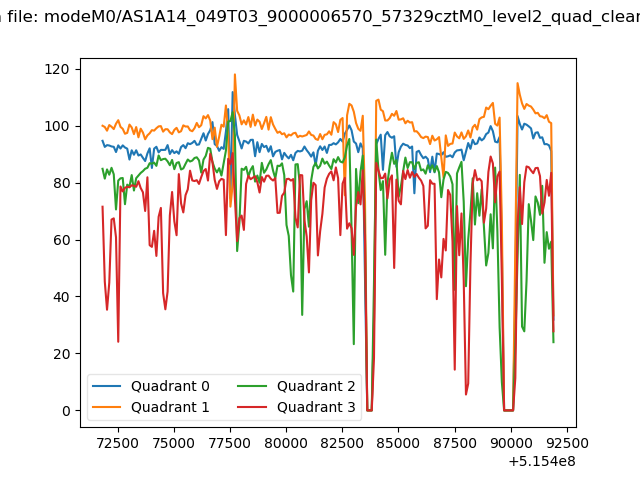 |
|
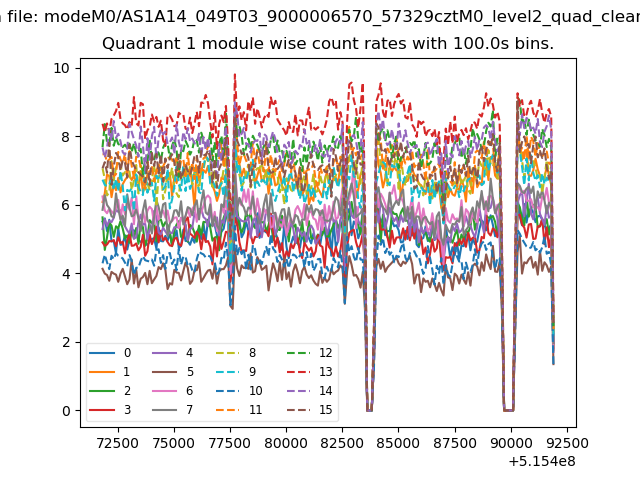
| Module-wise count rates for Quadrant A Data is divided into 100 sec bins |
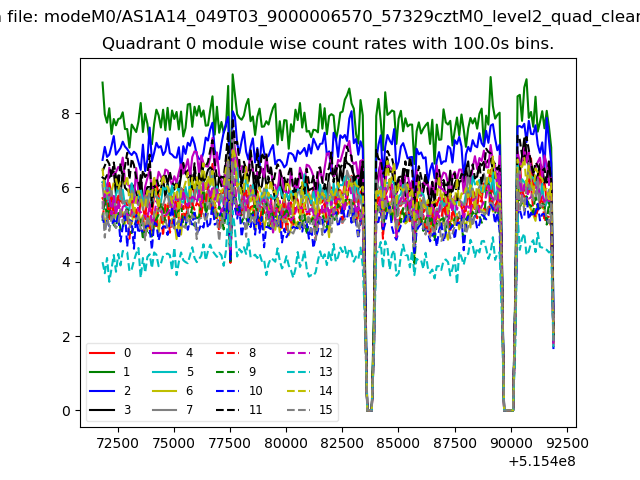 |
 |
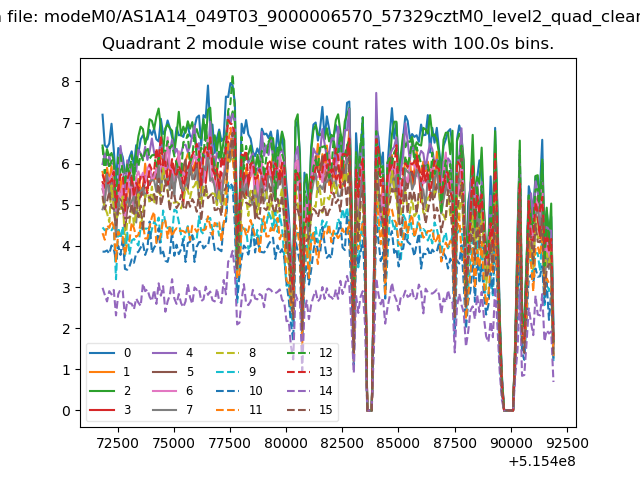
| Module-wise count rates for Quadrant B Data is divided into 100 sec bins |
 |
 |
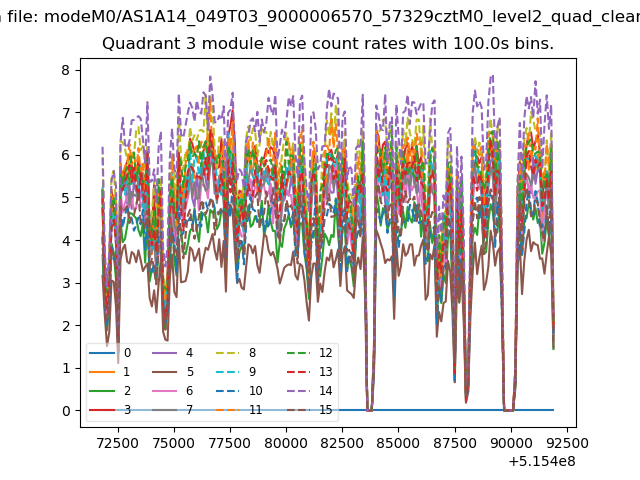
| Module-wise count rates for Quadrant C Data is divided into 100 sec bins |
 |
 |
| Module-wise count rates for Quadrant D Data is divided into 100 sec bins |
 |
 |
| Parameter | Plot |
|---|---|
| CZT HV Monitor | 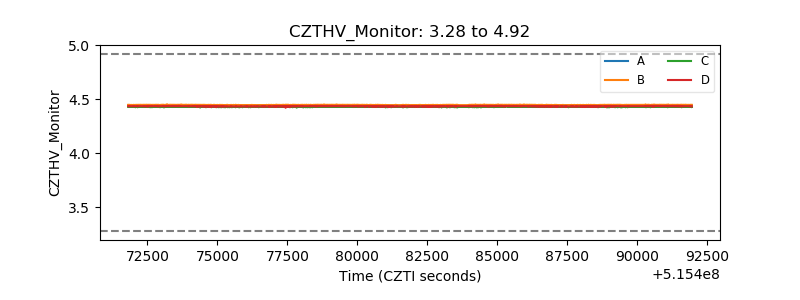 |
| D_VDD | 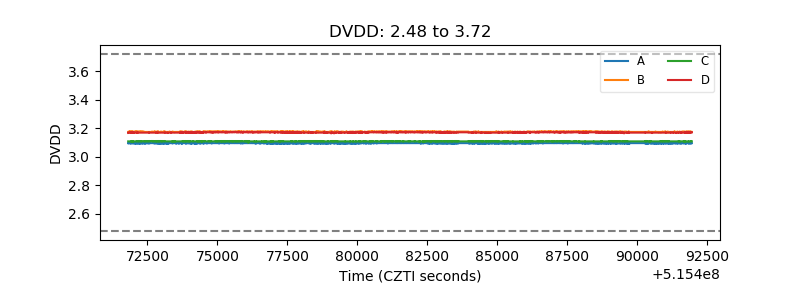 |
| Temperature 1 | 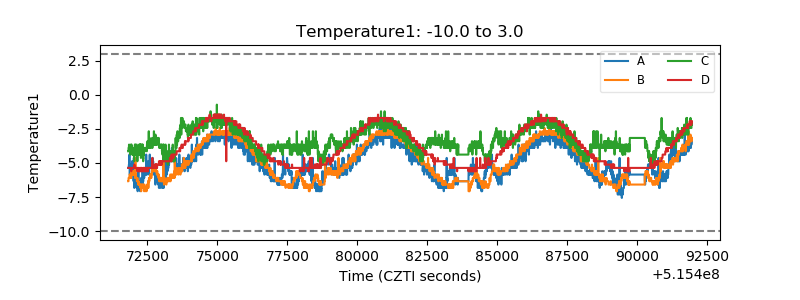 |
| Veto HV Monitor | 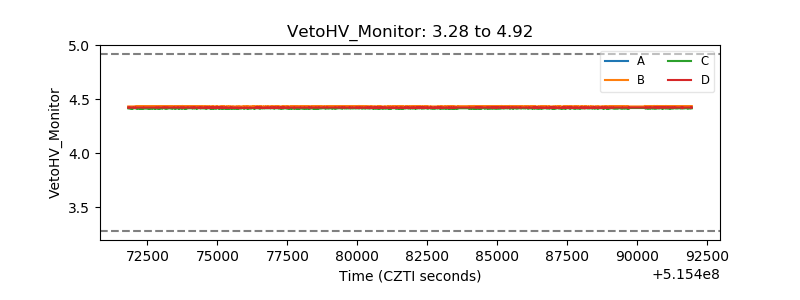 |
| Veto LLD | 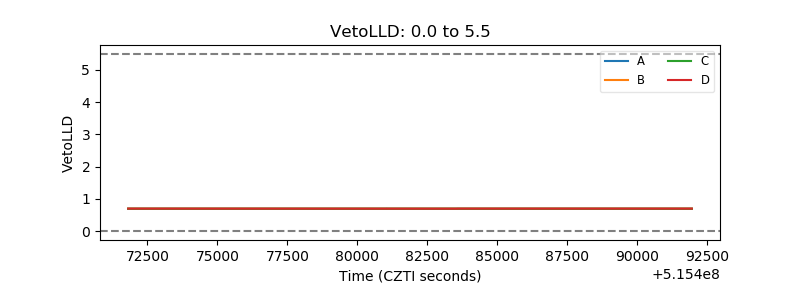 |
| Alpha Counter | 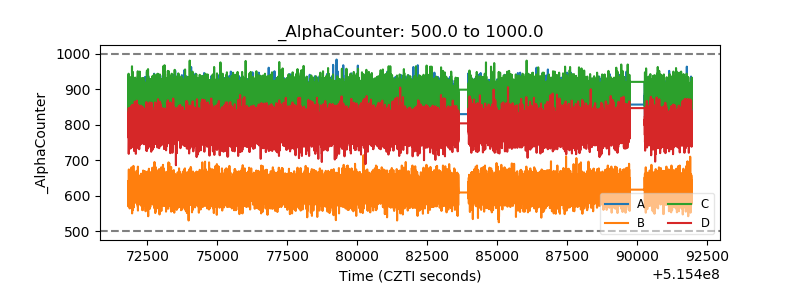 |
| _CPM_Rate | 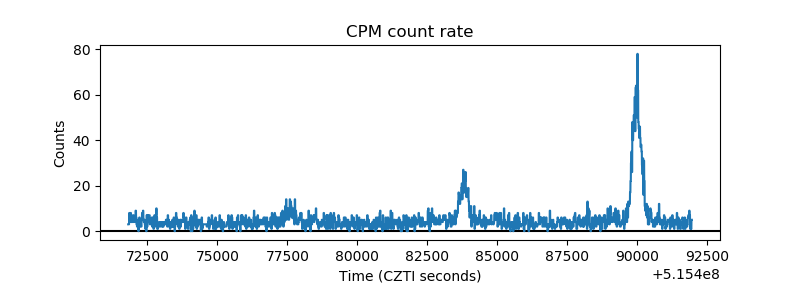 |
| CZT Counter | 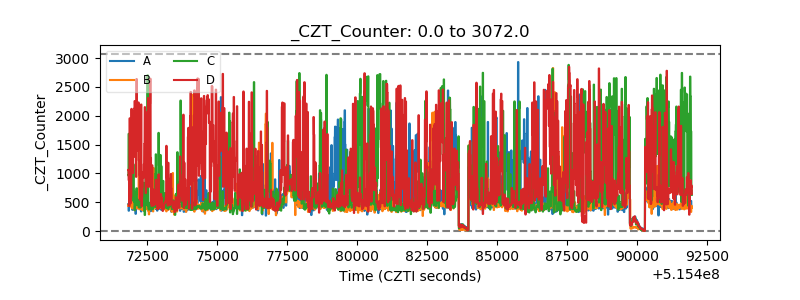 |
| +2.5 Volts monitor |  |
| +5 Volts monitor |  |
| _ROLL_ROT | 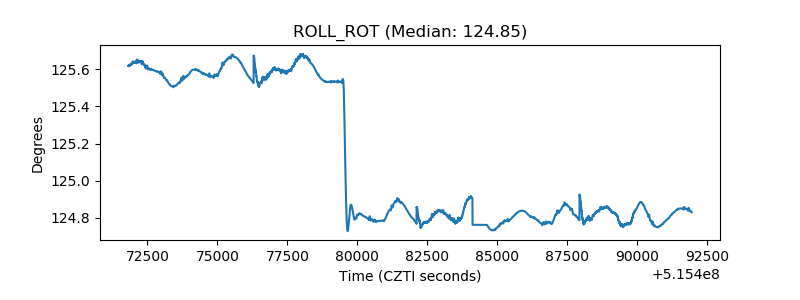 |
| _Roll_DEC | 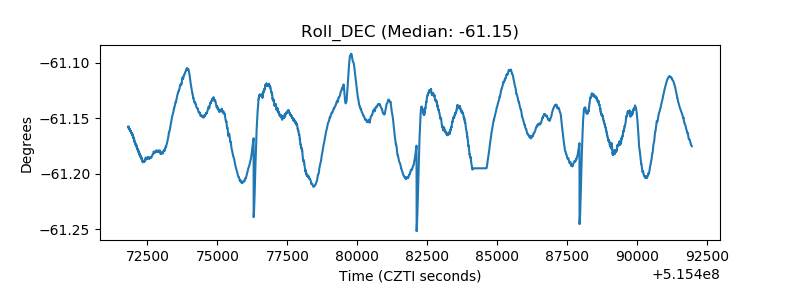 |
| _Roll_RA | 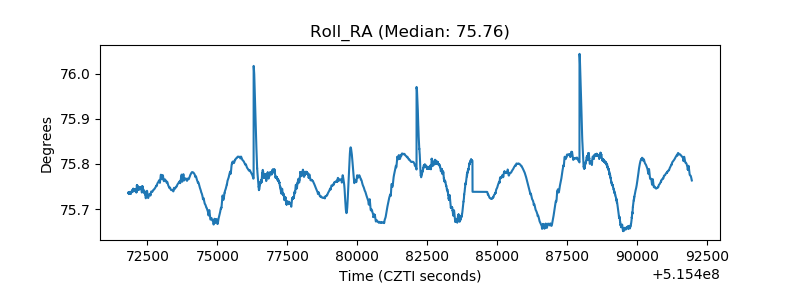 |
| Veto Counter | 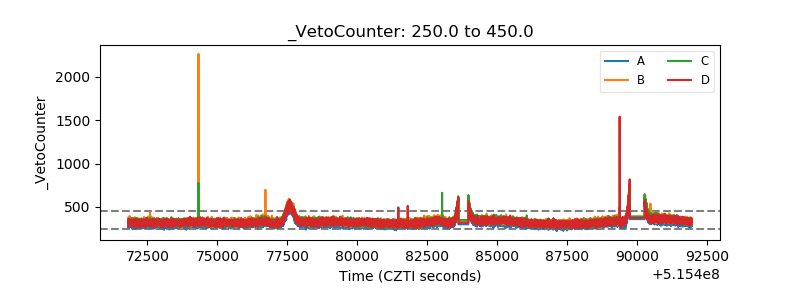 |