| Param | Original file | Final file |
|---|---|---|
| Filename | modeM0/AS1A14_102T01_9000006572_57334cztM0_level2.fits | modeM0/AS1A14_102T01_9000006572_57334cztM0_level2_quad_clean.evt |
| Size (bytes) | 496,517,760 | 86,106,240 |
| Size | 473.5 MB | 82.1 MB |
| Events in quadrant A | 2,986,540 | 594,237 |
| Events in quadrant B | 2,807,989 | 633,496 |
| Events in quadrant C | 5,884,772 | 480,973 |
| Events in quadrant D | 6,239,513 | 483,668 |
| Mode M0 | |||
|---|---|---|---|
| Quadrant | BADHDUFLAG | Total packets | Discarded packets |
| A | 0 | 13138 | 1 |
| B | 0 | 12531 | 1 |
| C | 0 | 21648 | 1 |
| D | 0 | 22612 | 1 |
| Mode M9 | |||
|---|---|---|---|
| Quadrant | BADHDUFLAG | Total packets | Discarded packets |
| A | 0 | 11 | 0 |
| B | 0 | 11 | 0 |
| C | 0 | 11 | 0 |
| D | 0 | 11 | 0 |
| Mode SS | |||
|---|---|---|---|
| Quadrant | BADHDUFLAG | Total packets | Discarded packets |
| A | 0 | 122 | 0 |
| B | 0 | 122 | 0 |
| C | 0 | 122 | 0 |
| D | 0 | 122 | 0 |
| Quadrant | Total seconds | Saturated seconds | Saturation percentage |
|---|---|---|---|
| A | 5931 | 91 | 1.534311% |
| B | 5931 | 80 | 1.348845% |
| C | 5932 | 974 | 16.419420% |
| D | 5932 | 758 | 12.778152% |
Noise dominated data is calculated using 1-second bins in cleaned event files. If a bin has >2000 counts, and if more than 50% of those come from <1% of pixels, then it is considered to be noise-dominated and hence unusable.
| Quadrant | # 1 sec bins | Bins with >0 counts | Bins with >2000 counts | High rate bins dominated by noise | Noise dominated (total time) | Noise dominated (detector-on time) | Marked lightcurve |
|---|---|---|---|---|---|---|---|
| A | 7081 | 5932 | 23 | 23 | 0.32% | 0.39% | 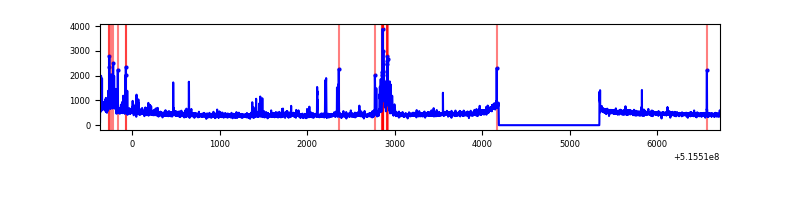 |
| B | 7081 | 5932 | 15 | 15 | 0.21% | 0.25% | 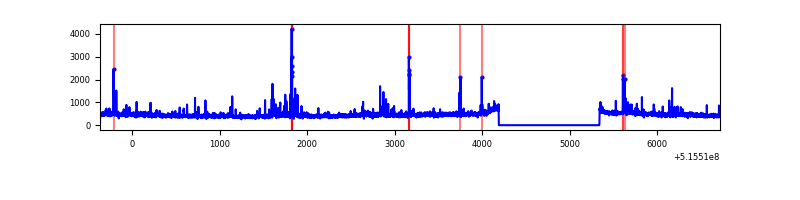 |
| C | 7082 | 5933 | 735 | 735 | 10.38% | 12.39% | 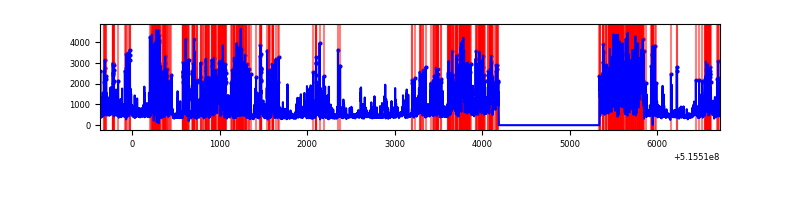 |
| D | 7082 | 5933 | 679 | 679 | 9.59% | 11.44% | 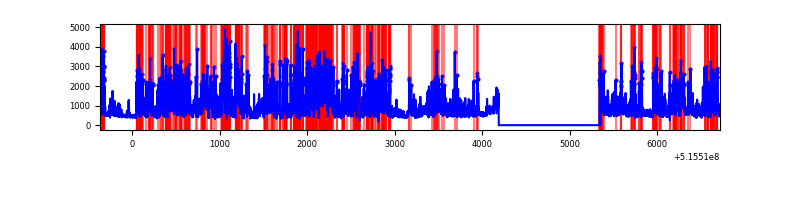 |
Top three noisy pixels from each quadrant. If the there are fewer than three noisy pixels in the level2.evt file, extra rows are filled as -1
| Pixel properties | Quadrant properties | ||||||
|---|---|---|---|---|---|---|---|
| Quadrant | DetID | PixID | Counts | Sigma | Mean | Median | Sigma |
| A | 9 | 46 | 333776 | 2048.55 | 657 | 640 | 162.6 |
| A | 0 | 12 | 71276 | 434.36 | 657 | 640 | 162.6 |
| A | 8 | 4 | 14481 | 85.11 | 657 | 640 | 162.6 |
| B | 5 | 185 | 45259 | 322.33 | 645 | 620 | 138.5 |
| B | 0 | 213 | 44564 | 317.31 | 645 | 620 | 138.5 |
| B | 7 | 252 | 32581 | 230.78 | 645 | 620 | 138.5 |
| C | 15 | 224 | 3322583 | 20993.51 | 574 | 566 | 158.2 |
| C | 14 | 254 | 156423 | 984.94 | 574 | 566 | 158.2 |
| C | 9 | 237 | 45270 | 282.51 | 574 | 566 | 158.2 |
| D | 3 | 224 | 2613341 | 15241.71 | 599 | 572 | 171.4 |
| D | 8 | 240 | 785767 | 4580.47 | 599 | 572 | 171.4 |
| D | 15 | 142 | 183486 | 1067.04 | 599 | 572 | 171.4 |
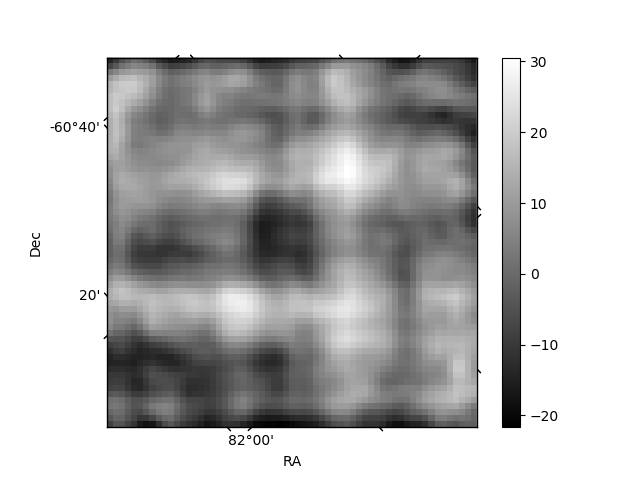
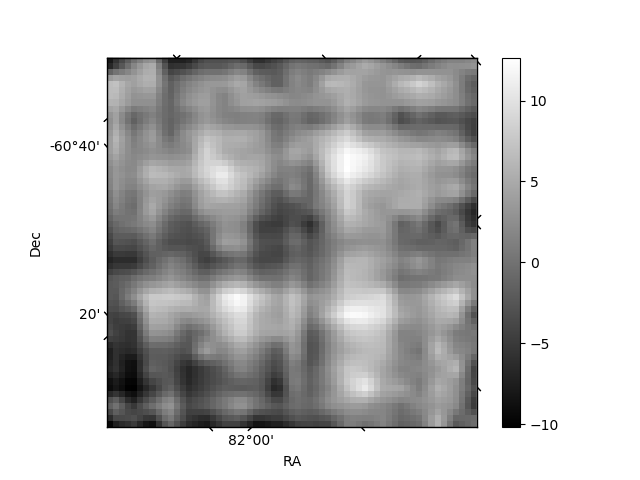
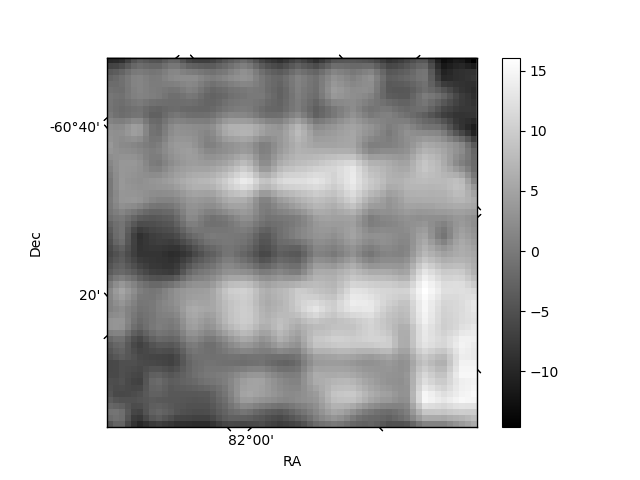
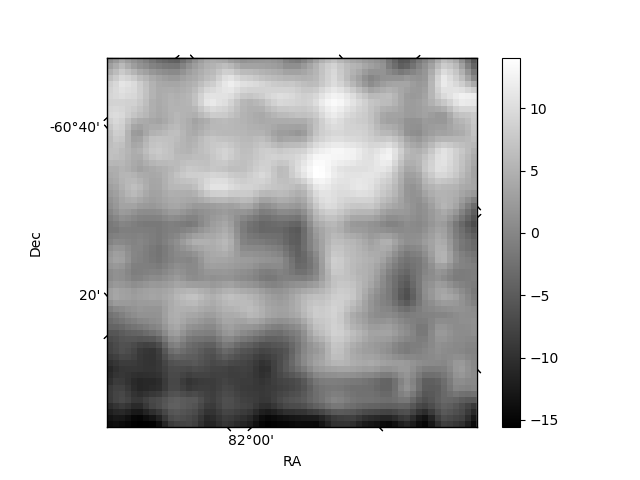
Histogram calculated using DETX and DETY for each event in the final _common_clean file
| Quadrant A | 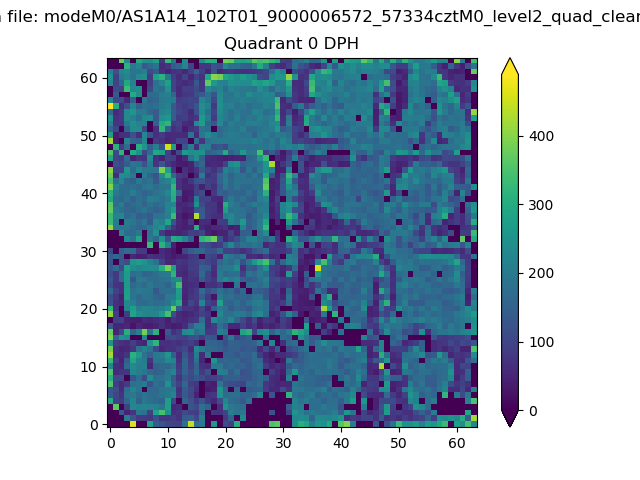 |
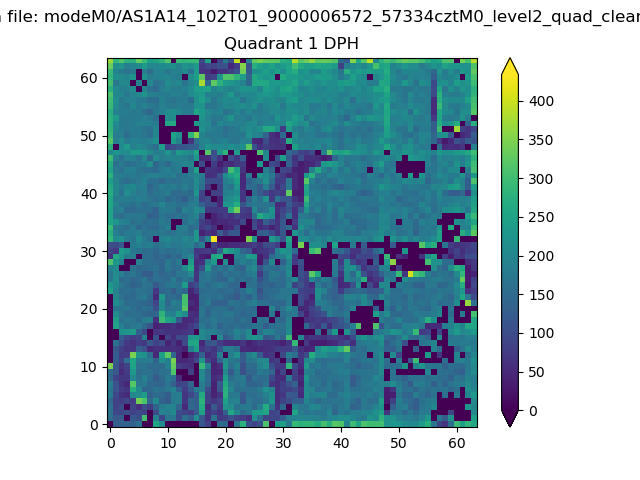 |
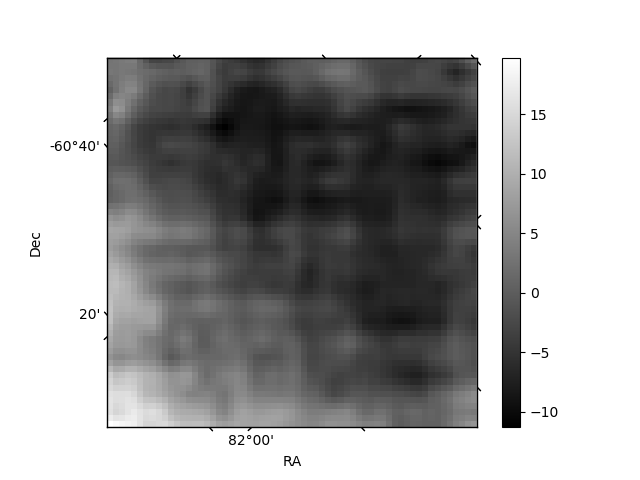
Quadrant B |
|---|---|---|---|
| Quadrant D | 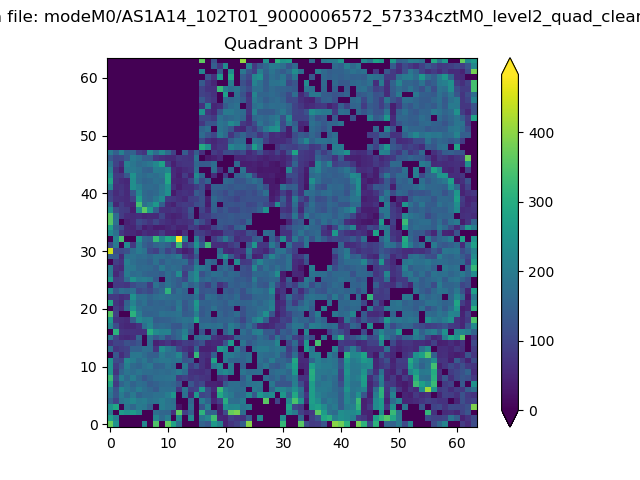 |
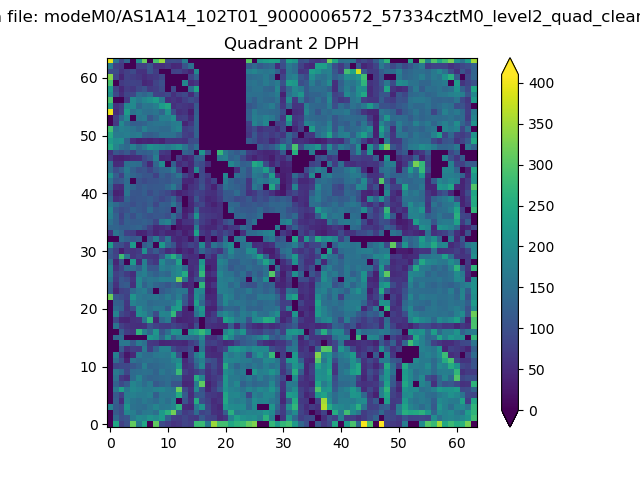 |
Quadrant C |
| Plot type | Count rate plots | Images |
|---|---|---|
| Comparison with Poisson distribution Blue bars denote a histogram of data divided into 1 sec bins. Red curve is a Poisson curve with rate = median count rate of data. |
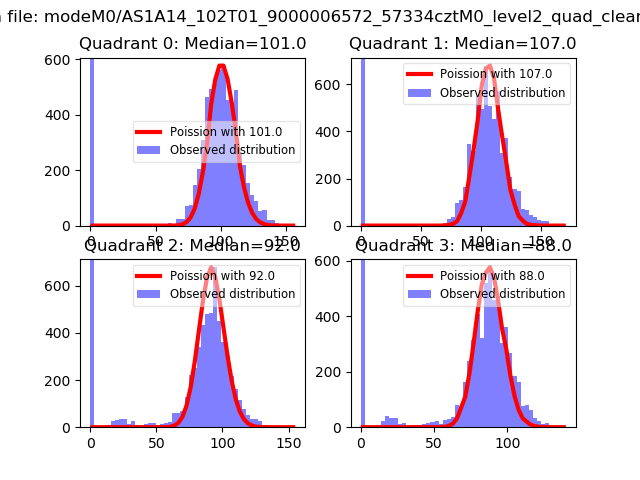 |
 |
| Quadrant-wise count rates Data is divided into 100 sec bins |
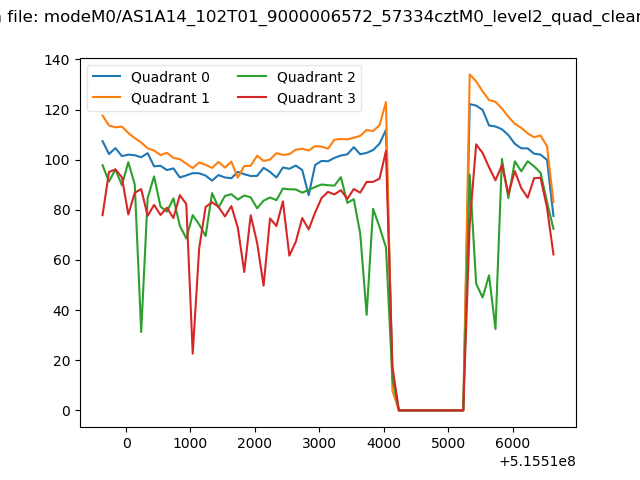 |
|
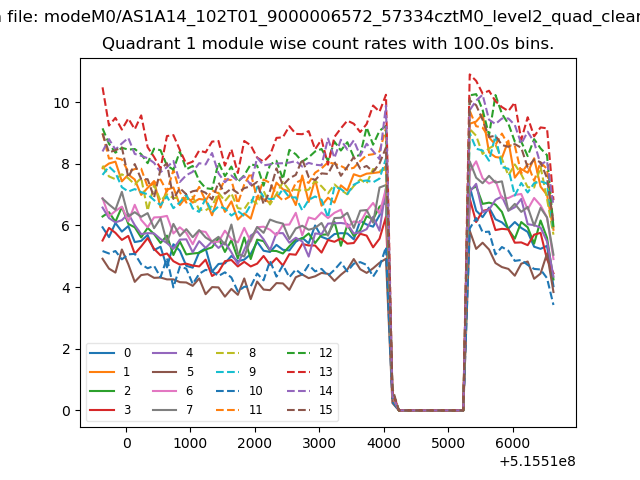
| Module-wise count rates for Quadrant A Data is divided into 100 sec bins |
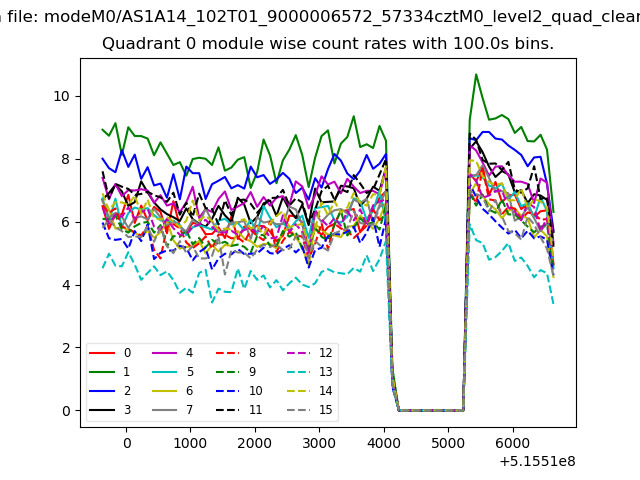 |
 |
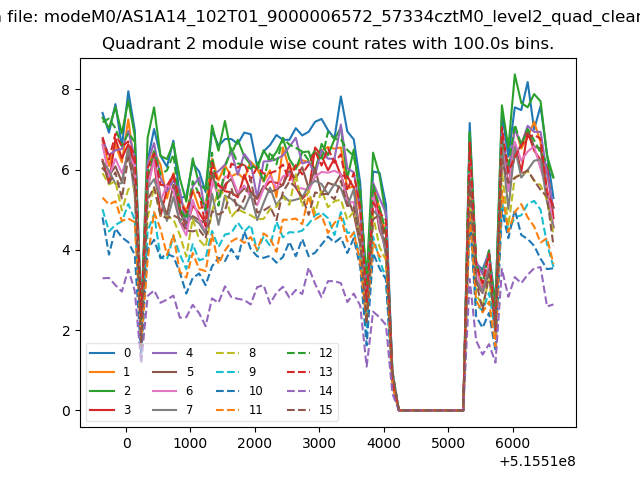
| Module-wise count rates for Quadrant B Data is divided into 100 sec bins |
 |
 |
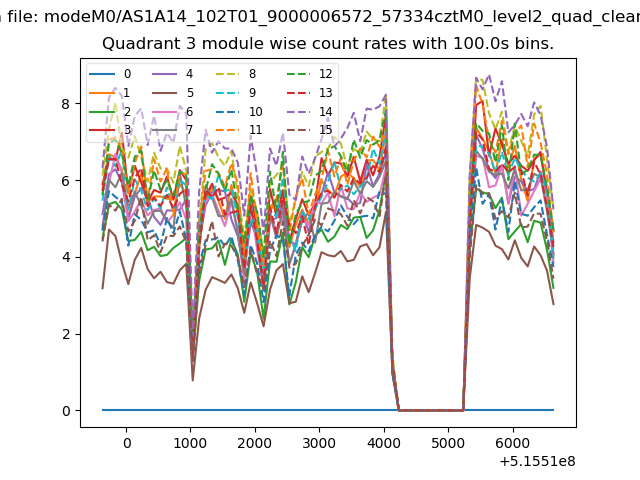
| Module-wise count rates for Quadrant C Data is divided into 100 sec bins |
 |
 |
| Module-wise count rates for Quadrant D Data is divided into 100 sec bins |
 |
 |
| Parameter | Plot |
|---|---|
| CZT HV Monitor | 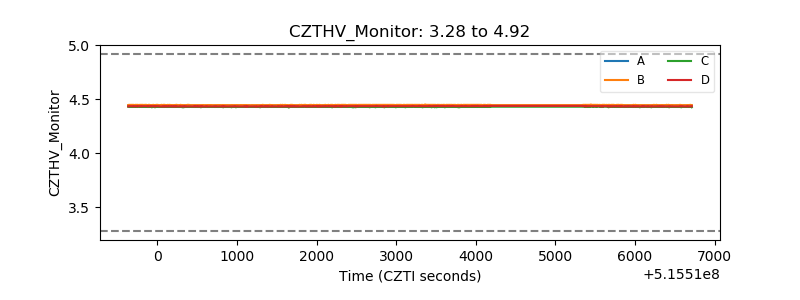 |
| D_VDD | 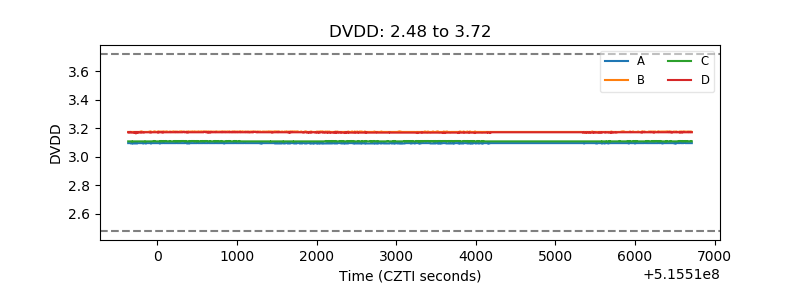 |
| Temperature 1 | 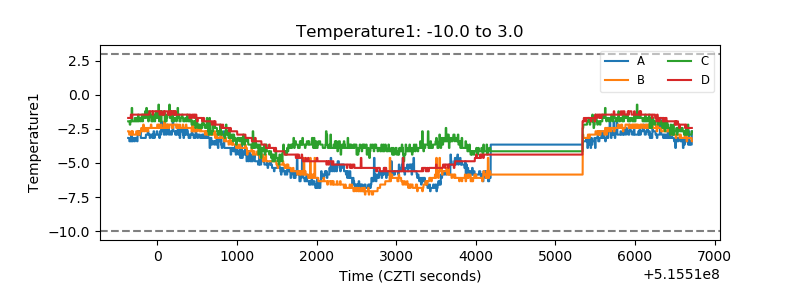 |
| Veto HV Monitor | 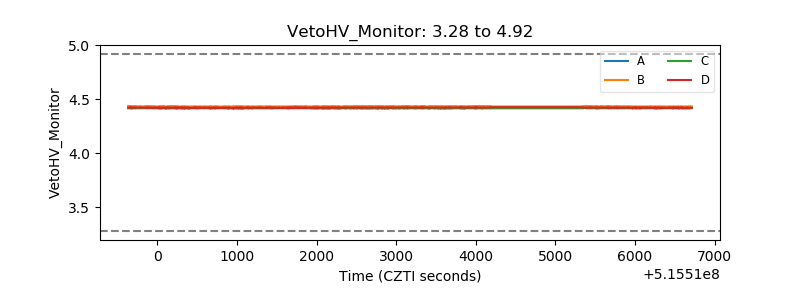 |
| Veto LLD | 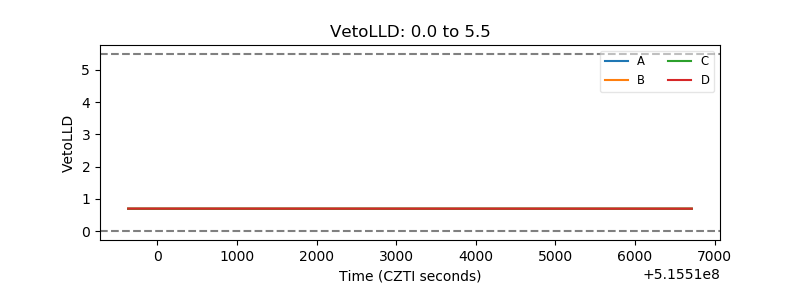 |
| Alpha Counter | 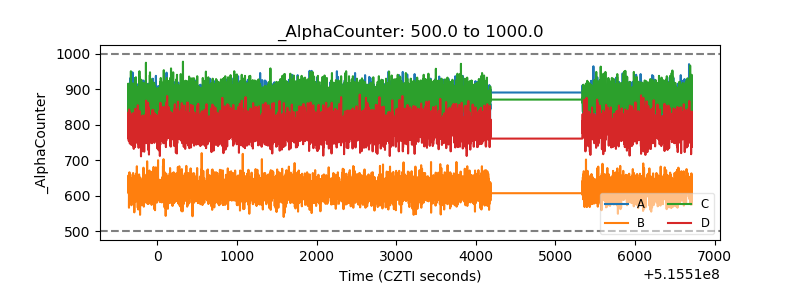 |
| _CPM_Rate | 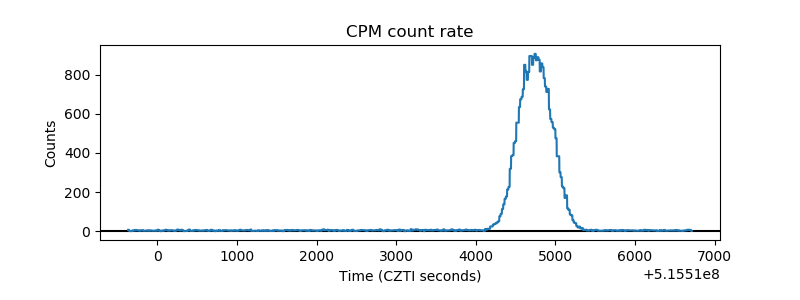 |
| CZT Counter | 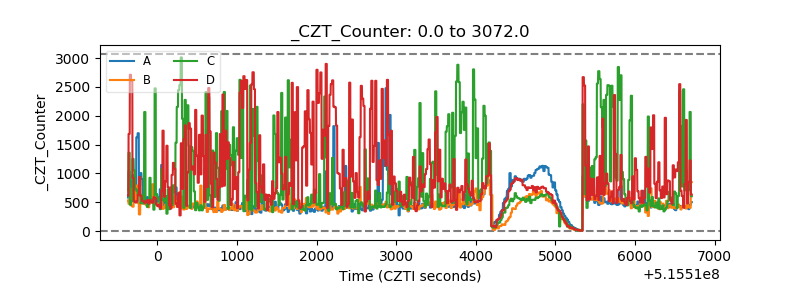 |
| +2.5 Volts monitor |  |
| +5 Volts monitor |  |
| _ROLL_ROT | 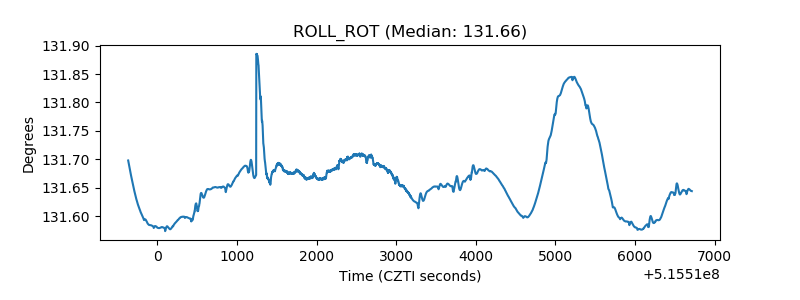 |
| _Roll_DEC | 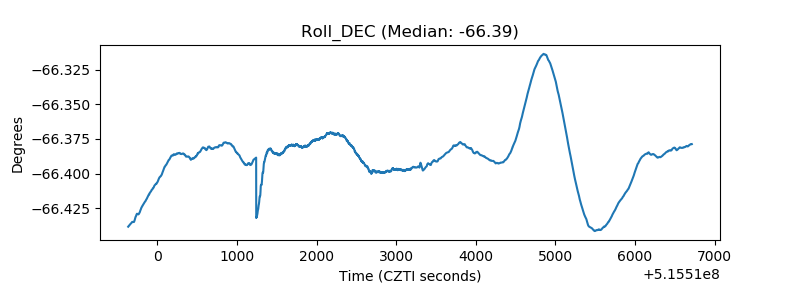 |
| _Roll_RA | 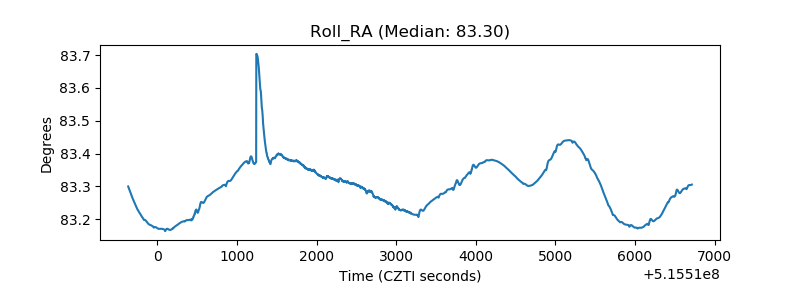 |
| Veto Counter | 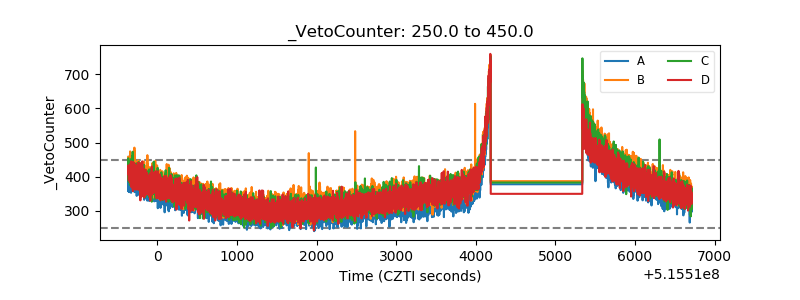 |