| Param | Original file | Final file |
|---|---|---|
| Filename | modeM0/AS1A14_102T01_9000006572_57335cztM0_level2.fits | modeM0/AS1A14_102T01_9000006572_57335cztM0_level2_quad_clean.evt |
| Size (bytes) | 512,758,080 | 90,800,640 |
| Size | 489.0 MB | 86.6 MB |
| Events in quadrant A | 2,768,202 | 634,924 |
| Events in quadrant B | 2,913,043 | 678,264 |
| Events in quadrant C | 5,813,418 | 523,624 |
| Events in quadrant D | 7,005,323 | 481,026 |
| Mode M0 | |||
|---|---|---|---|
| Quadrant | BADHDUFLAG | Total packets | Discarded packets |
| A | 0 | 12784 | 1 |
| B | 0 | 12987 | 1 |
| C | 0 | 21635 | 1 |
| D | 0 | 25099 | 1 |
| Mode M9 | |||
|---|---|---|---|
| Quadrant | BADHDUFLAG | Total packets | Discarded packets |
| A | 0 | 13 | 0 |
| B | 0 | 13 | 0 |
| C | 0 | 13 | 0 |
| D | 0 | 13 | 0 |
| Mode SS | |||
|---|---|---|---|
| Quadrant | BADHDUFLAG | Total packets | Discarded packets |
| A | 0 | 124 | 0 |
| B | 0 | 124 | 0 |
| C | 0 | 124 | 0 |
| D | 0 | 124 | 0 |
| Quadrant | Total seconds | Saturated seconds | Saturation percentage |
|---|---|---|---|
| A | 6187 | 31 | 0.501051% |
| B | 6188 | 38 | 0.614092% |
| C | 6188 | 860 | 13.897867% |
| D | 6187 | 1097 | 17.730726% |
Noise dominated data is calculated using 1-second bins in cleaned event files. If a bin has >2000 counts, and if more than 50% of those come from <1% of pixels, then it is considered to be noise-dominated and hence unusable.
| Quadrant | # 1 sec bins | Bins with >0 counts | Bins with >2000 counts | High rate bins dominated by noise | Noise dominated (total time) | Noise dominated (detector-on time) | Marked lightcurve |
|---|---|---|---|---|---|---|---|
| A | 7412 | 6188 | 2 | 2 | 0.03% | 0.03% |  |
| B | 7413 | 6189 | 6 | 6 | 0.08% | 0.10% | 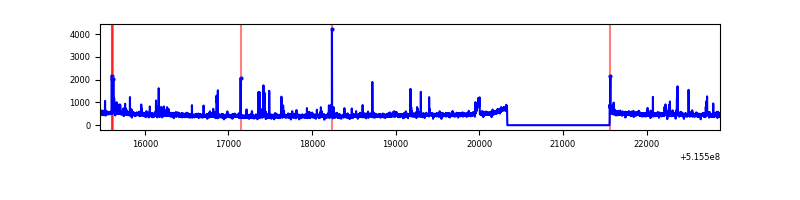 |
| C | 7413 | 6188 | 704 | 704 | 9.50% | 11.38% | 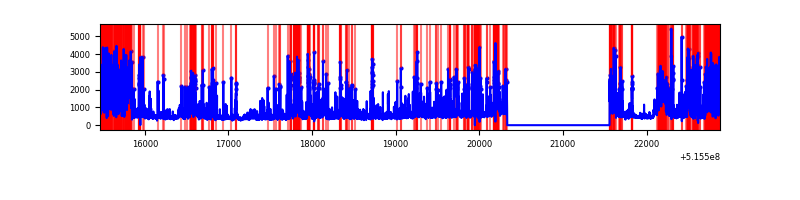 |
| D | 7412 | 6187 | 1001 | 1001 | 13.51% | 16.18% | 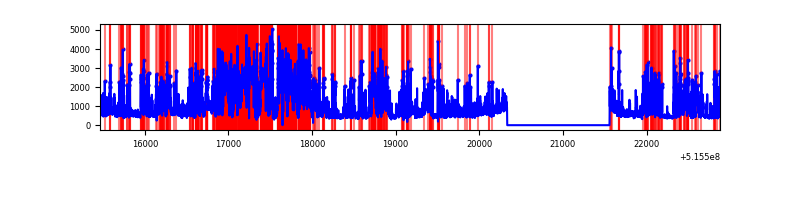 |
Top three noisy pixels from each quadrant. If the there are fewer than three noisy pixels in the level2.evt file, extra rows are filled as -1
| Pixel properties | Quadrant properties | ||||||
|---|---|---|---|---|---|---|---|
| Quadrant | DetID | PixID | Counts | Sigma | Mean | Median | Sigma |
| A | 0 | 12 | 61568 | 359.33 | 691 | 673 | 169.5 |
| A | 3 | 137 | 8274 | 44.85 | 691 | 673 | 169.5 |
| A | 4 | 3 | 7931 | 42.83 | 691 | 673 | 169.5 |
| B | 5 | 185 | 55549 | 379.63 | 680 | 656 | 144.6 |
| B | 7 | 252 | 25227 | 169.93 | 680 | 656 | 144.6 |
| B | 0 | 197 | 22383 | 150.26 | 680 | 656 | 144.6 |
| C | 15 | 224 | 3092352 | 18320.3 | 612 | 605 | 168.8 |
| C | 14 | 254 | 105358 | 620.72 | 612 | 605 | 168.8 |
| C | 6 | 223 | 89338 | 525.79 | 612 | 605 | 168.8 |
| D | 8 | 240 | 2270382 | 13075.28 | 610 | 581 | 173.6 |
| D | 3 | 224 | 2122003 | 12220.53 | 610 | 581 | 173.6 |
| D | 2 | 249 | 97416 | 557.82 | 610 | 581 | 173.6 |
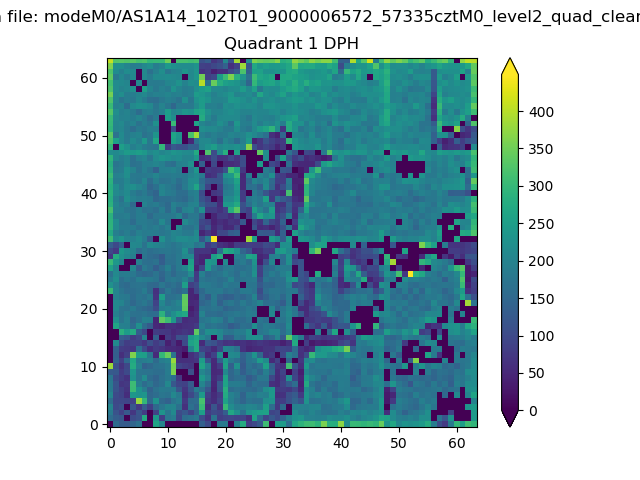
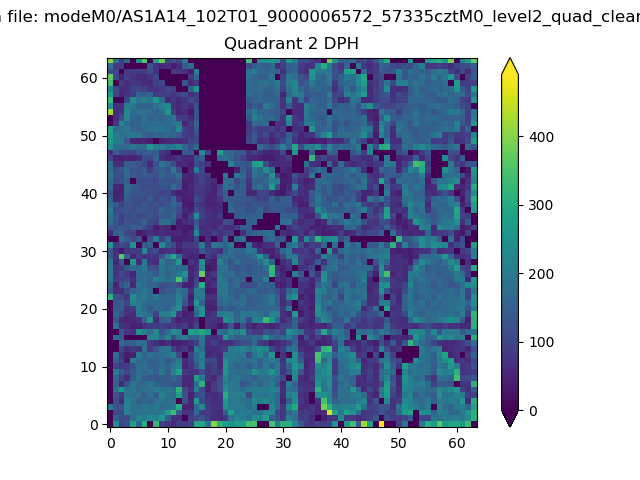
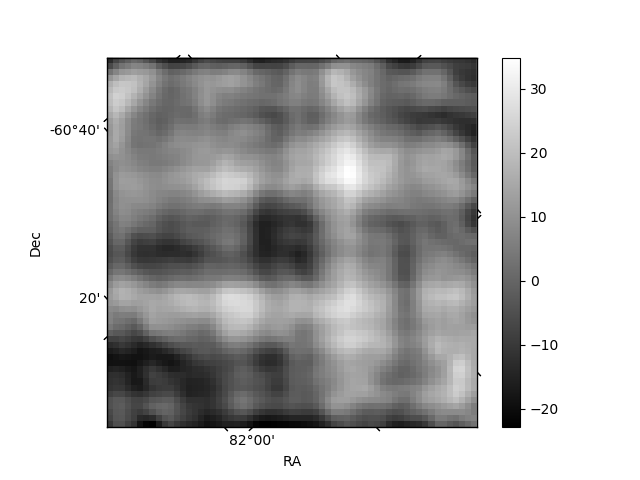
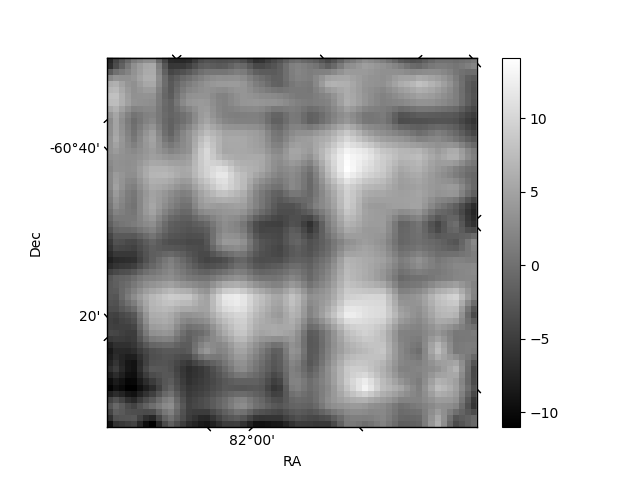
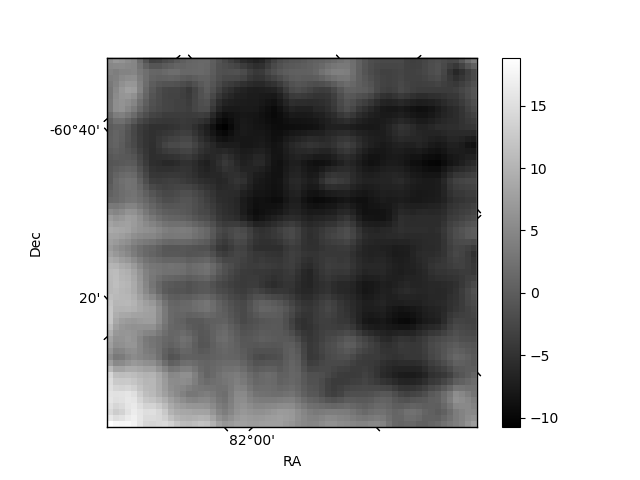
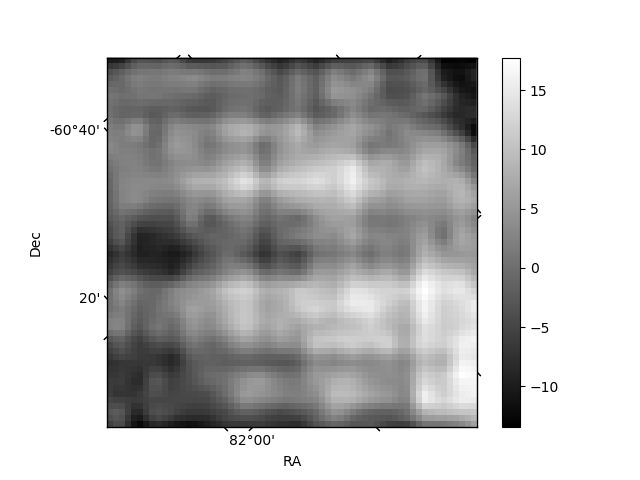
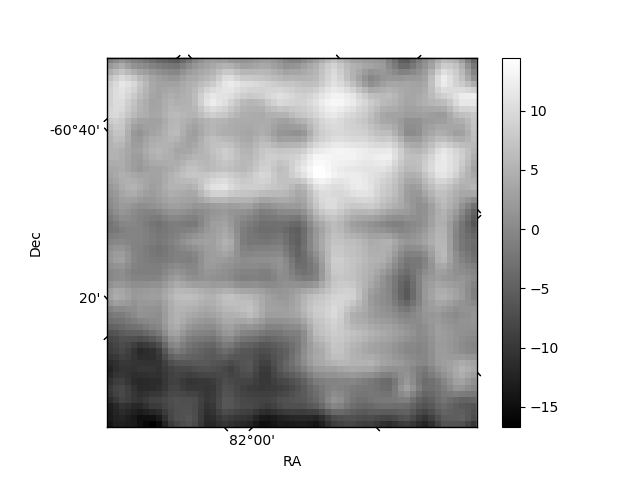
Histogram calculated using DETX and DETY for each event in the final _common_clean file
| Quadrant A | 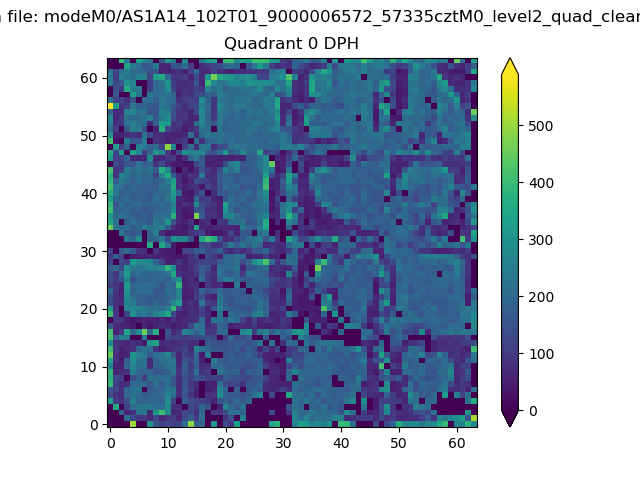 |
 |
Quadrant B |
|---|---|---|---|
| Quadrant D | 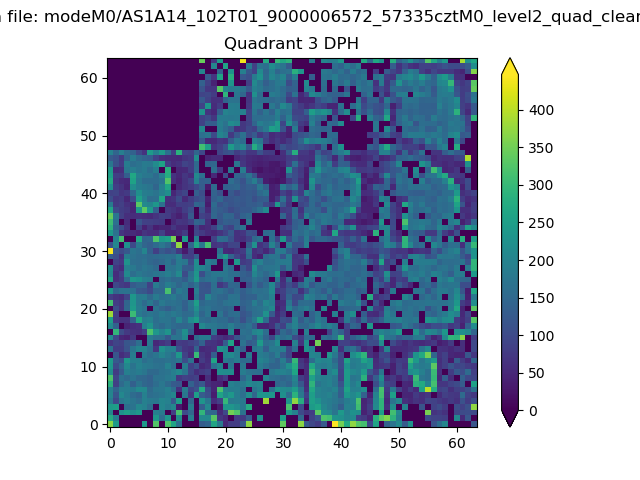 |
 |
Quadrant C |
| Plot type | Count rate plots | Images |
|---|---|---|
| Comparison with Poisson distribution Blue bars denote a histogram of data divided into 1 sec bins. Red curve is a Poisson curve with rate = median count rate of data. |
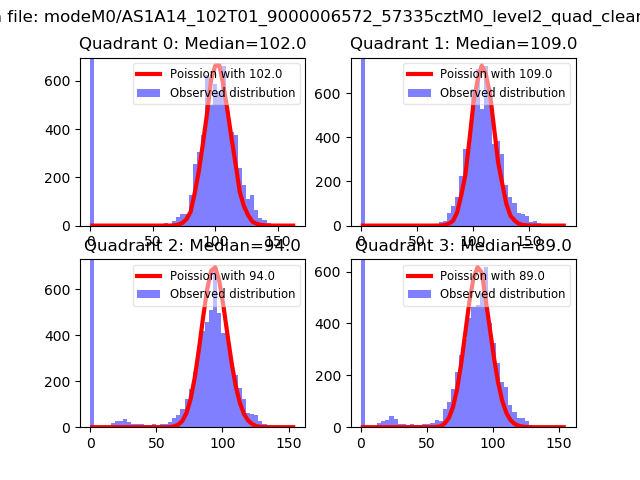 |
 |
| Quadrant-wise count rates Data is divided into 100 sec bins |
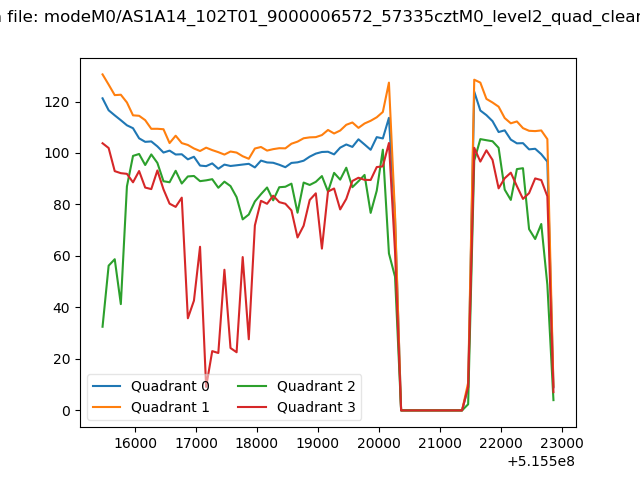 |
|
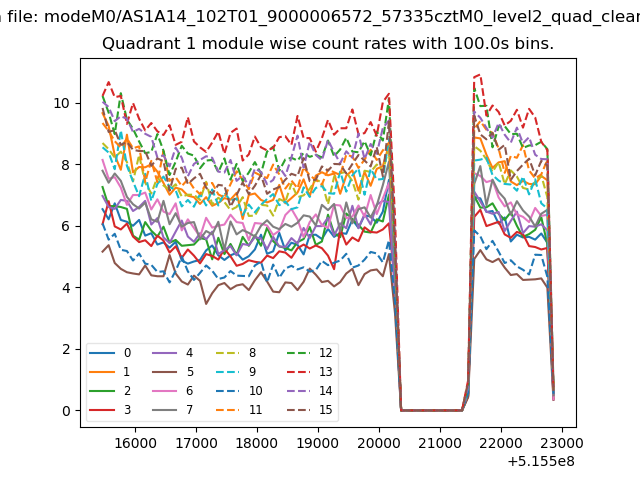
| Module-wise count rates for Quadrant A Data is divided into 100 sec bins |
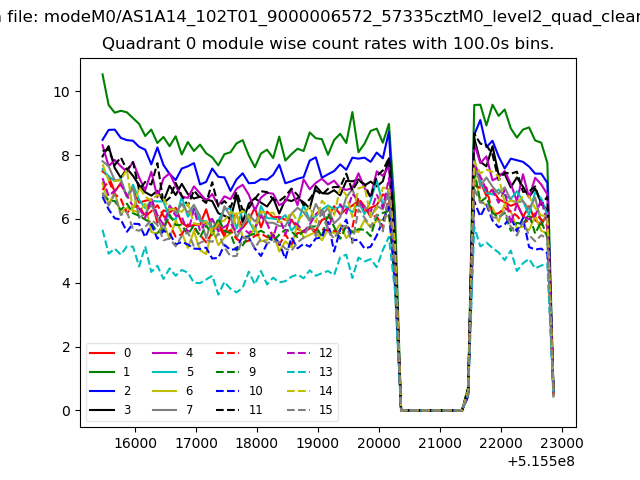 |
 |
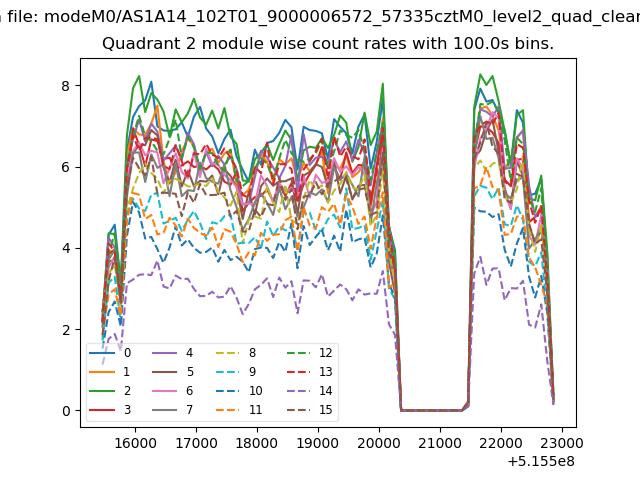
| Module-wise count rates for Quadrant B Data is divided into 100 sec bins |
 |
 |
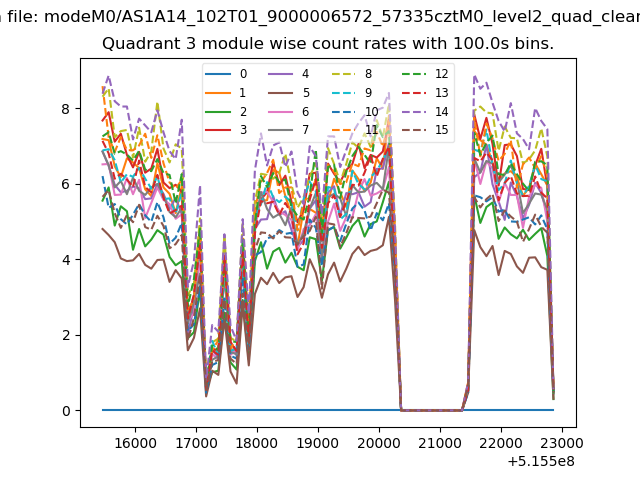
| Module-wise count rates for Quadrant C Data is divided into 100 sec bins |
 |
 |
| Module-wise count rates for Quadrant D Data is divided into 100 sec bins |
 |
 |
| Parameter | Plot |
|---|---|
| CZT HV Monitor | 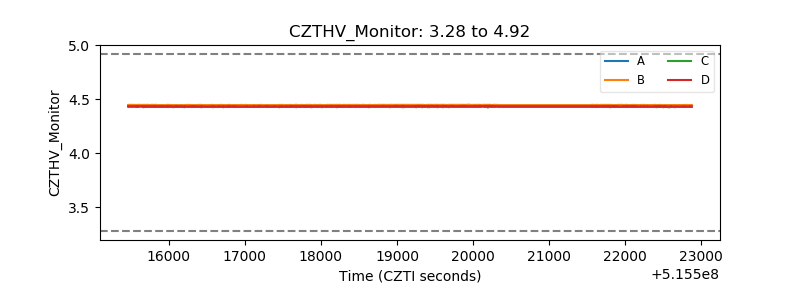 |
| D_VDD | 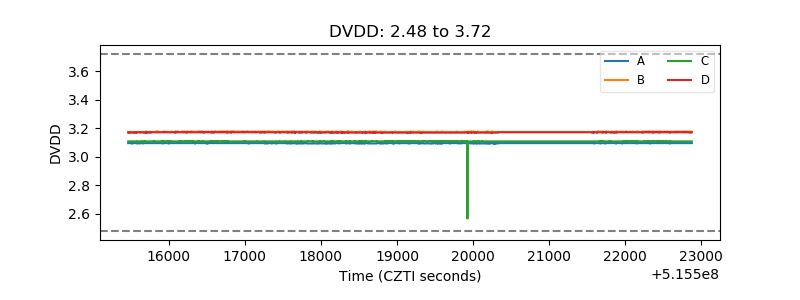 |
| Temperature 1 | 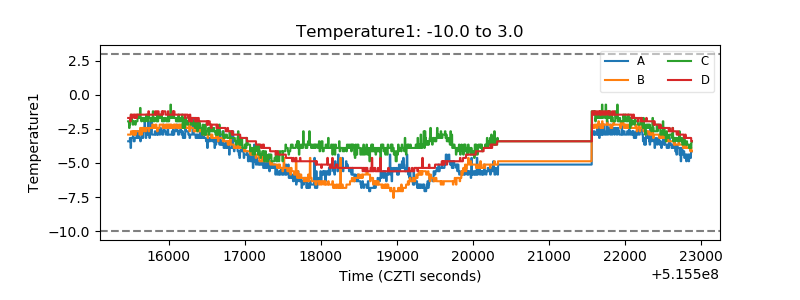 |
| Veto HV Monitor | 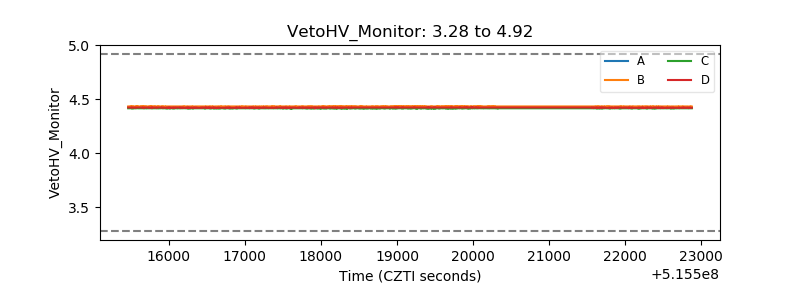 |
| Veto LLD | 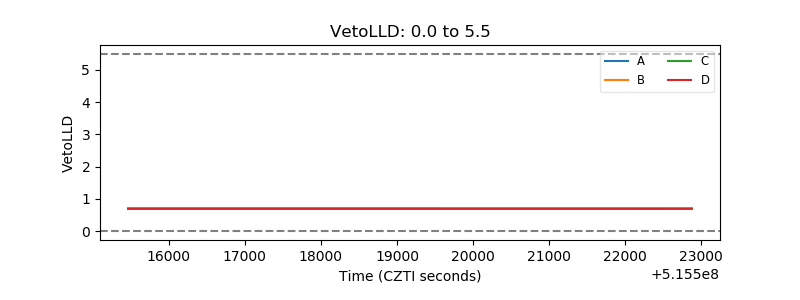 |
| Alpha Counter | 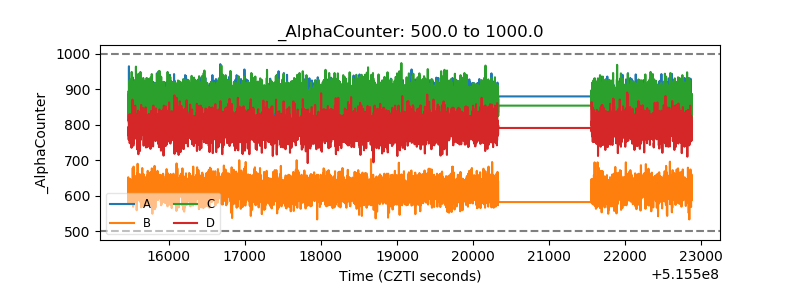 |
| _CPM_Rate | 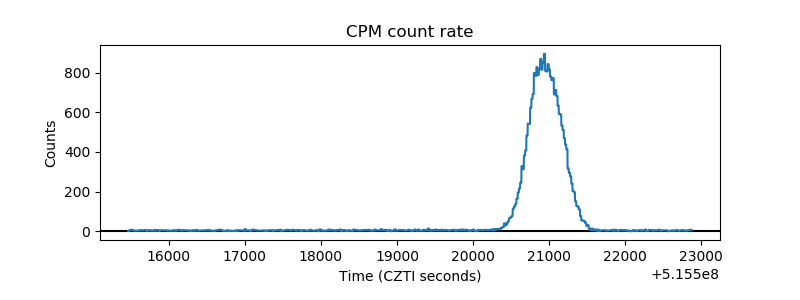 |
| CZT Counter | 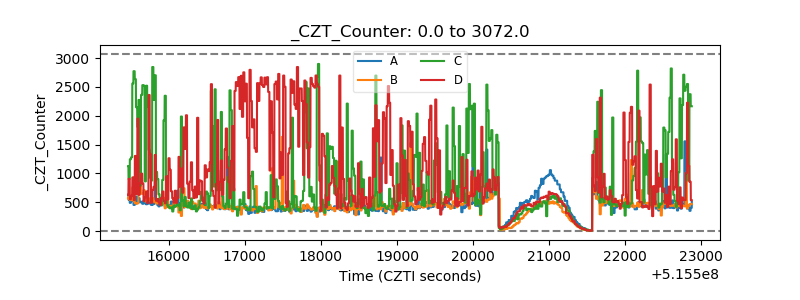 |
| +2.5 Volts monitor | 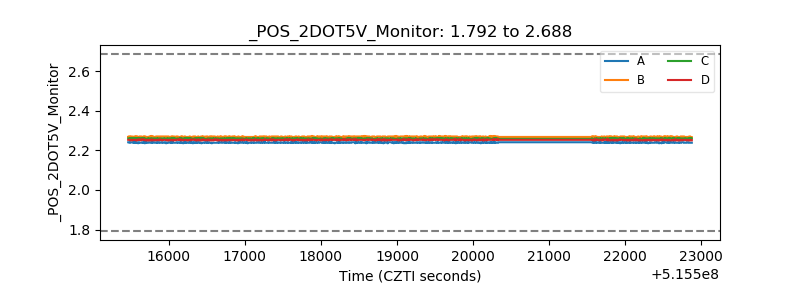 |
| +5 Volts monitor |  |
| _ROLL_ROT | 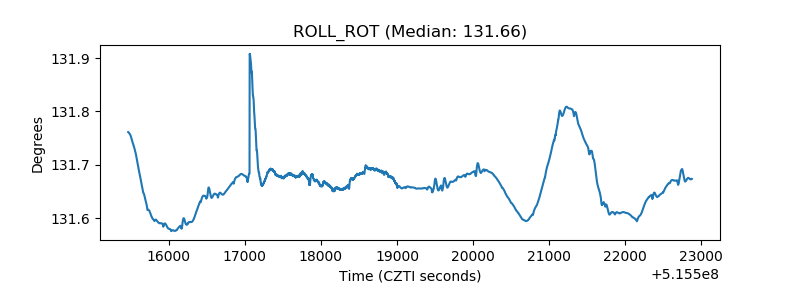 |
| _Roll_DEC | 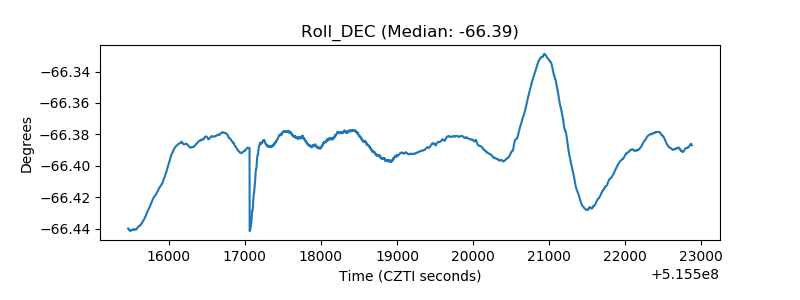 |
| _Roll_RA | 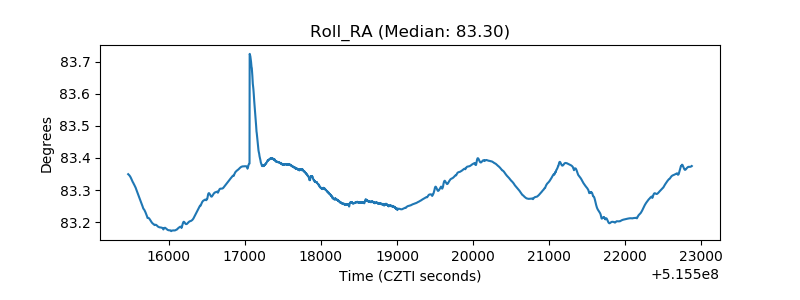 |
| Veto Counter | 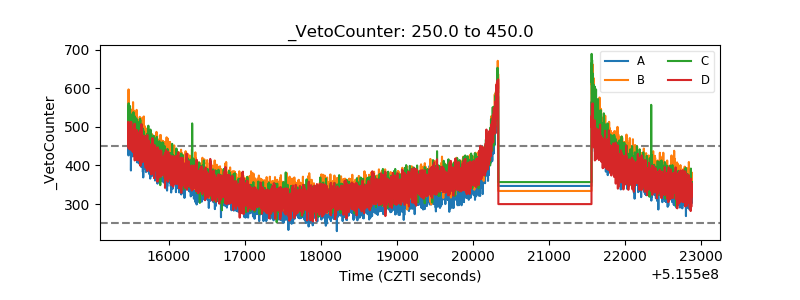 |