| Param | Original file | Final file |
|---|---|---|
| Filename | modeM0/AS1A14_102T01_9000006572_57336cztM0_level2.fits | modeM0/AS1A14_102T01_9000006572_57336cztM0_level2_quad_clean.evt |
| Size (bytes) | 495,976,320 | 95,264,640 |
| Size | 473.0 MB | 90.9 MB |
| Events in quadrant A | 2,893,397 | 649,241 |
| Events in quadrant B | 2,955,161 | 696,822 |
| Events in quadrant C | 6,515,623 | 545,315 |
| Events in quadrant D | 5,497,157 | 545,657 |
| Mode M0 | |||
|---|---|---|---|
| Quadrant | BADHDUFLAG | Total packets | Discarded packets |
| A | 0 | 13427 | 90 |
| B | 0 | 13398 | 80 |
| C | 0 | 24060 | 158 |
| D | 0 | 20877 | 159 |
| Mode M9 | |||
|---|---|---|---|
| Quadrant | BADHDUFLAG | Total packets | Discarded packets |
| A | 0 | 12 | 0 |
| B | 0 | 12 | 0 |
| C | 0 | 12 | 0 |
| D | 0 | 12 | 0 |
| Mode SS | |||
|---|---|---|---|
| Quadrant | BADHDUFLAG | Total packets | Discarded packets |
| A | 0 | 130 | 0 |
| B | 0 | 130 | 0 |
| C | 0 | 130 | 0 |
| D | 0 | 130 | 0 |
| Quadrant | Total seconds | Saturated seconds | Saturation percentage |
|---|---|---|---|
| A | 6413 | 47 | 0.732886% |
| B | 6417 | 45 | 0.701262% |
| C | 6414 | 910 | 14.187714% |
| D | 6409 | 522 | 8.144796% |
Noise dominated data is calculated using 1-second bins in cleaned event files. If a bin has >2000 counts, and if more than 50% of those come from <1% of pixels, then it is considered to be noise-dominated and hence unusable.
| Quadrant | # 1 sec bins | Bins with >0 counts | Bins with >2000 counts | High rate bins dominated by noise | Noise dominated (total time) | Noise dominated (detector-on time) | Marked lightcurve |
|---|---|---|---|---|---|---|---|
| A | 7620 | 6430 | 13 | 13 | 0.17% | 0.20% | 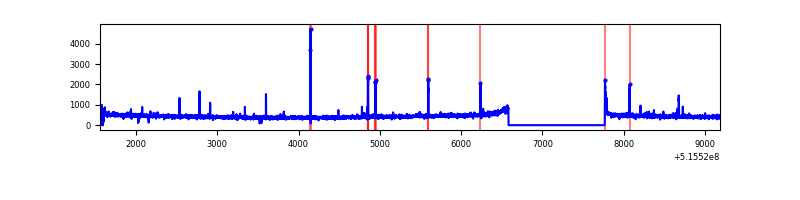 |
| B | 7627 | 6427 | 4 | 4 | 0.05% | 0.06% | 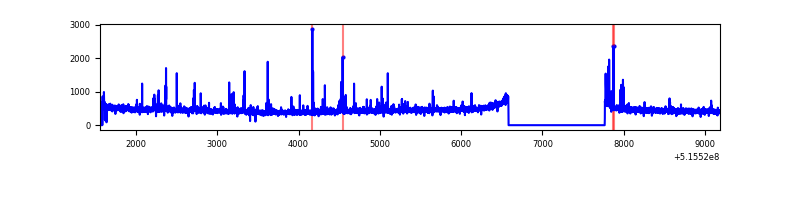 |
| C | 7616 | 6423 | 753 | 753 | 9.89% | 11.72% | 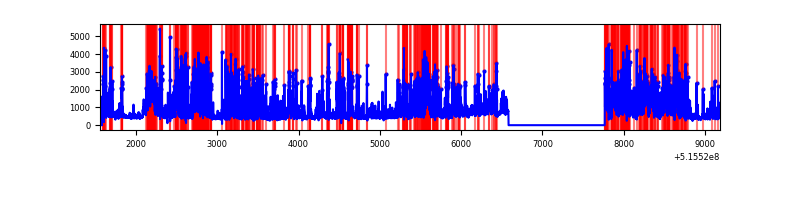 |
| D | 7626 | 6422 | 384 | 384 | 5.04% | 5.98% | 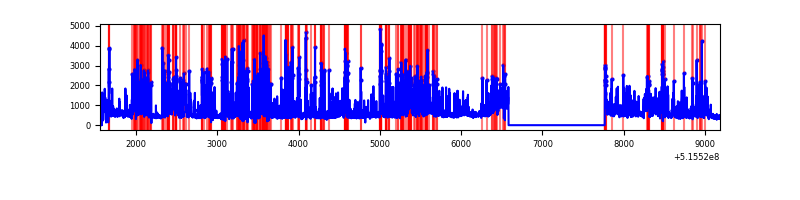 |
Top three noisy pixels from each quadrant. If the there are fewer than three noisy pixels in the level2.evt file, extra rows are filled as -1
| Pixel properties | Quadrant properties | ||||||
|---|---|---|---|---|---|---|---|
| Quadrant | DetID | PixID | Counts | Sigma | Mean | Median | Sigma |
| A | 0 | 12 | 106901 | 608.93 | 707 | 689 | 174.4 |
| A | 3 | 245 | 11361 | 61.18 | 707 | 689 | 174.4 |
| A | 13 | 254 | 9298 | 49.36 | 707 | 689 | 174.4 |
| B | 0 | 197 | 35173 | 230.09 | 700 | 675 | 149.9 |
| B | 0 | 213 | 27399 | 178.24 | 700 | 675 | 149.9 |
| B | 4 | 201 | 18882 | 121.43 | 700 | 675 | 149.9 |
| C | 15 | 224 | 3420313 | 19596.98 | 638 | 630 | 174.5 |
| C | 12 | 252 | 309488 | 1769.96 | 638 | 630 | 174.5 |
| C | 14 | 254 | 136084 | 776.24 | 638 | 630 | 174.5 |
| D | 3 | 224 | 2245930 | 12119.04 | 652 | 622 | 185.3 |
| D | 8 | 240 | 346321 | 1865.91 | 652 | 622 | 185.3 |
| D | 2 | 249 | 166228 | 893.86 | 652 | 622 | 185.3 |
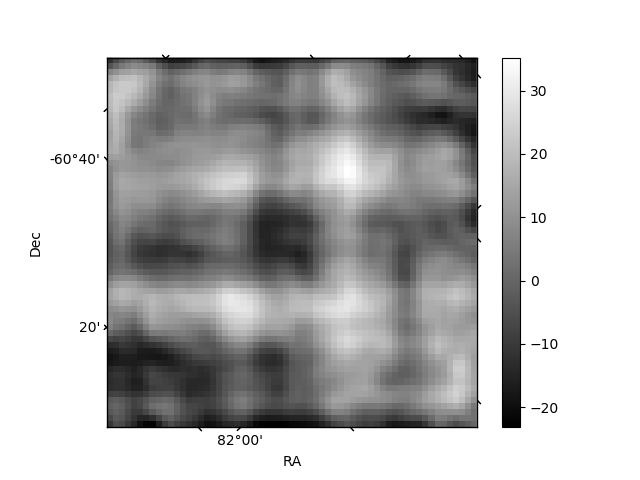
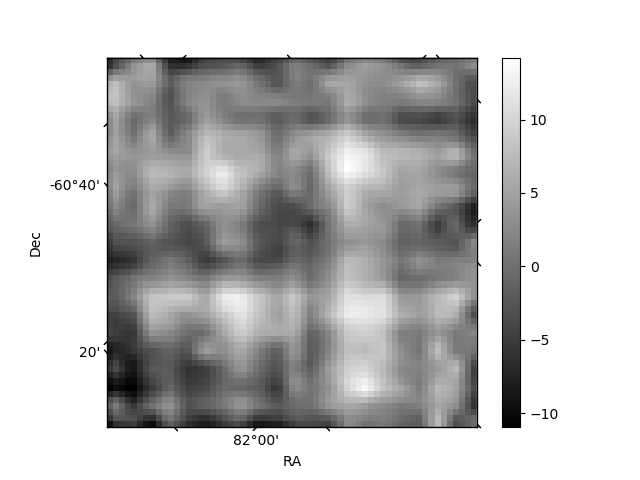
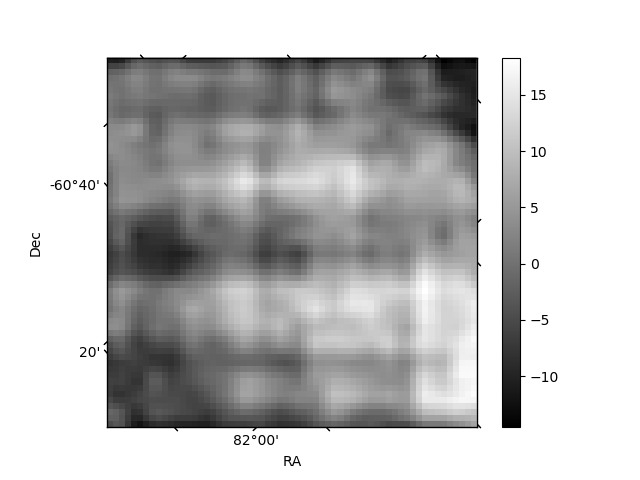
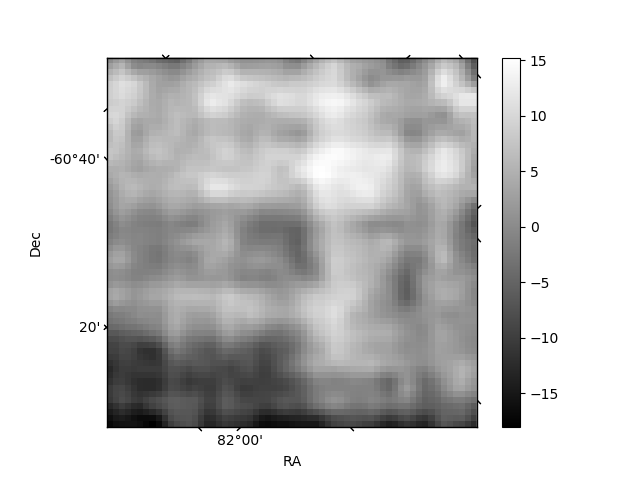
Histogram calculated using DETX and DETY for each event in the final _common_clean file
| Quadrant A | 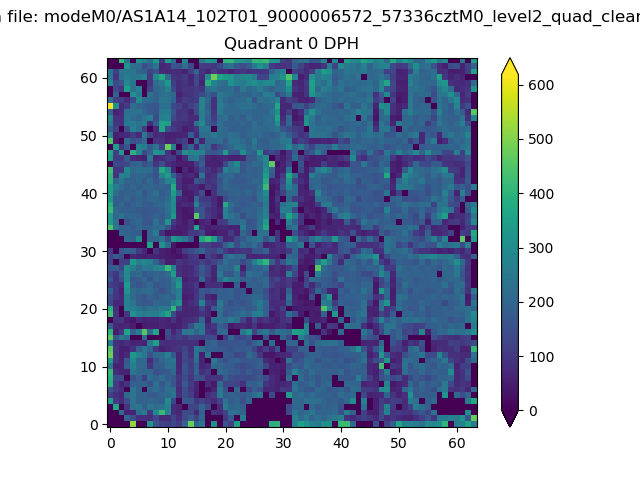 |
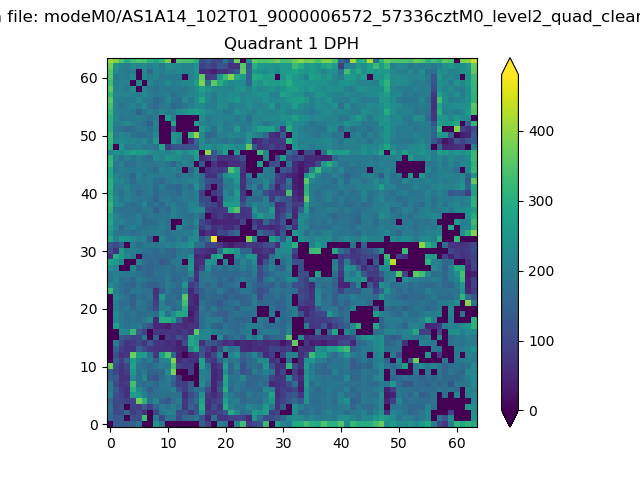 |
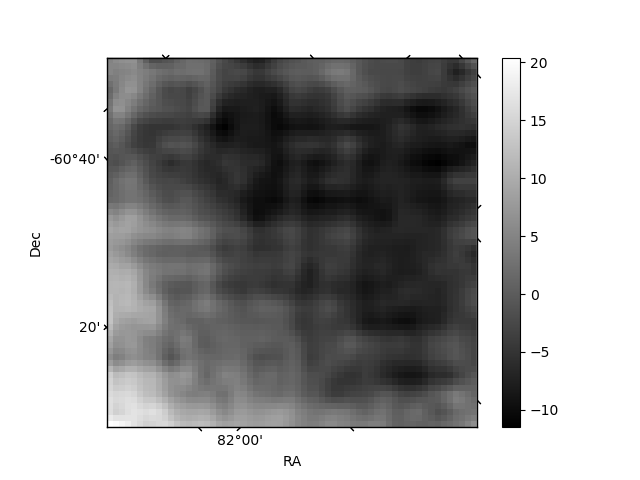
Quadrant B |
|---|---|---|---|
| Quadrant D | 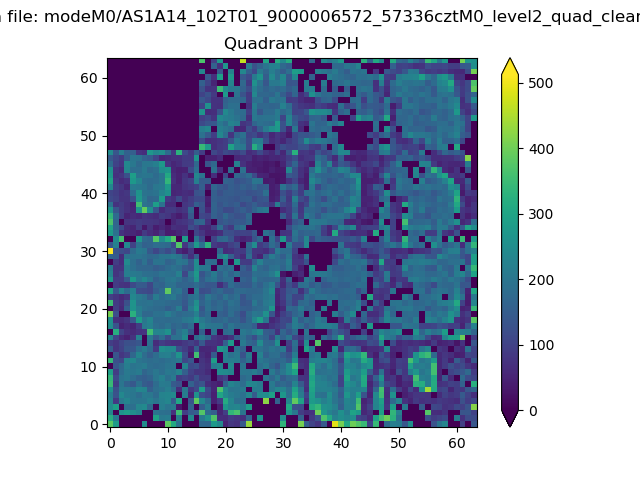 |
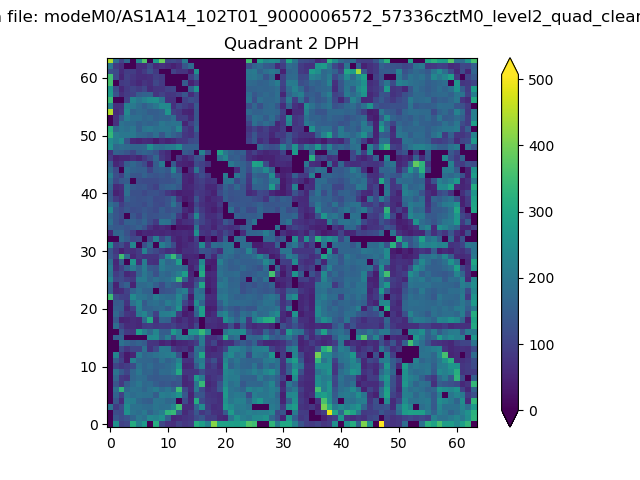 |
Quadrant C |
| Plot type | Count rate plots | Images |
|---|---|---|
| Comparison with Poisson distribution Blue bars denote a histogram of data divided into 1 sec bins. Red curve is a Poisson curve with rate = median count rate of data. |
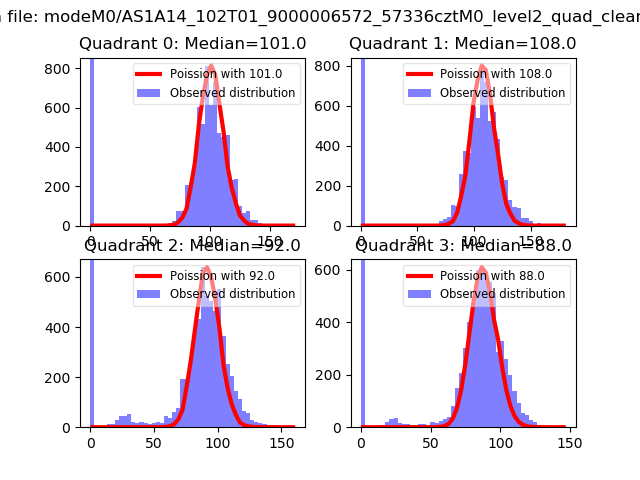 |
 |
| Quadrant-wise count rates Data is divided into 100 sec bins |
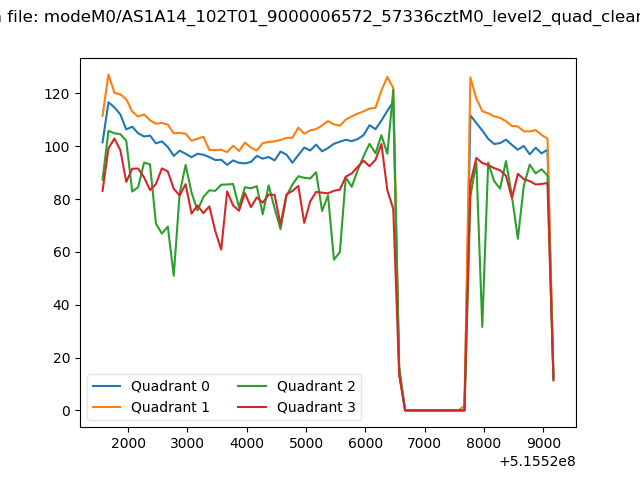 |
|
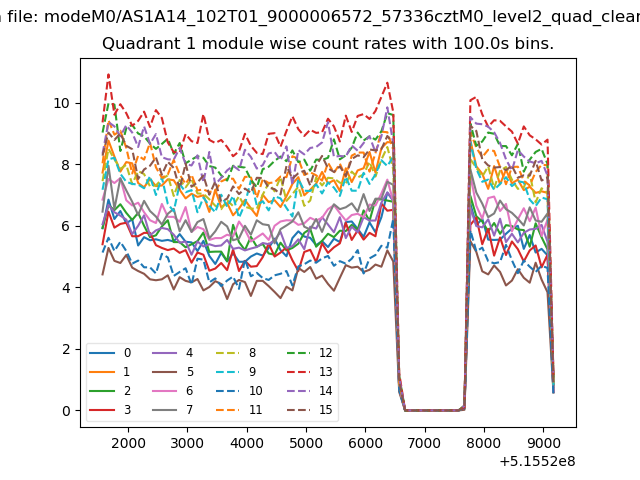
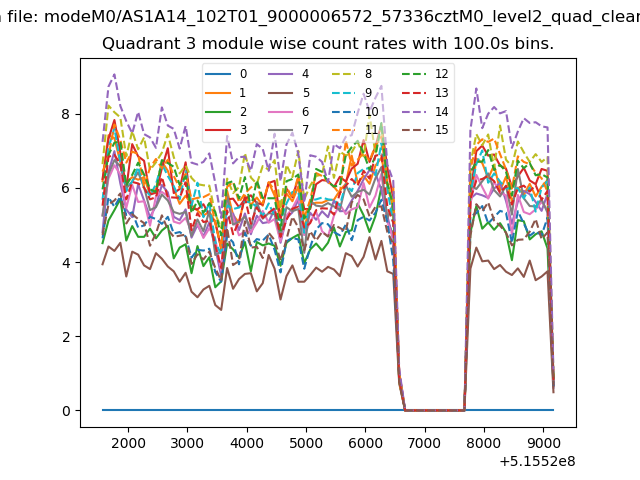
| Module-wise count rates for Quadrant A Data is divided into 100 sec bins |
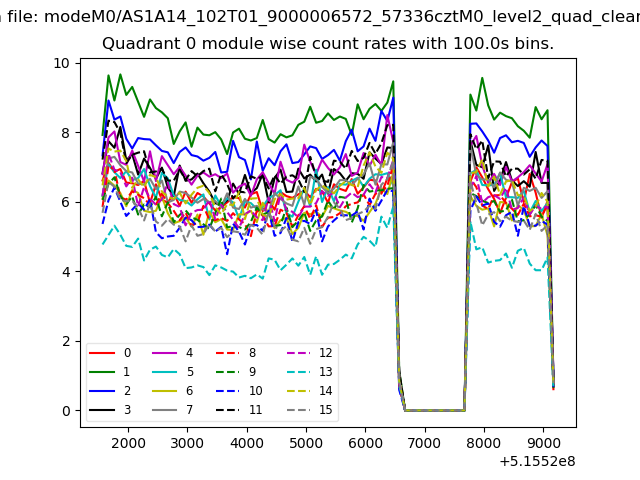 |
 |
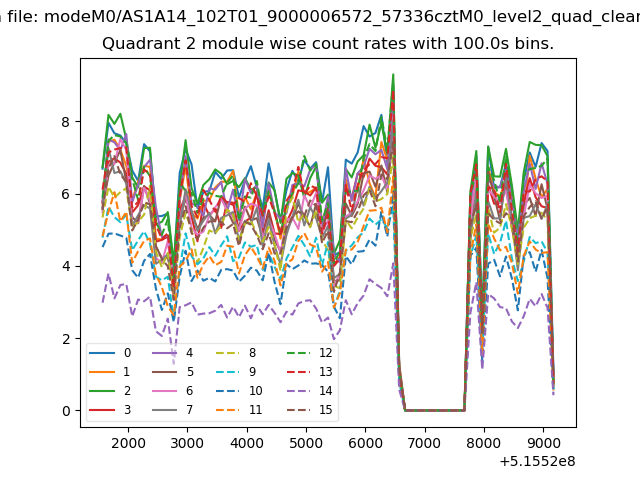
| Module-wise count rates for Quadrant B Data is divided into 100 sec bins |
 |
 |
| Module-wise count rates for Quadrant C Data is divided into 100 sec bins |
 |
 |
| Module-wise count rates for Quadrant D Data is divided into 100 sec bins |
 |
 |
| Parameter | Plot |
|---|---|
| CZT HV Monitor | 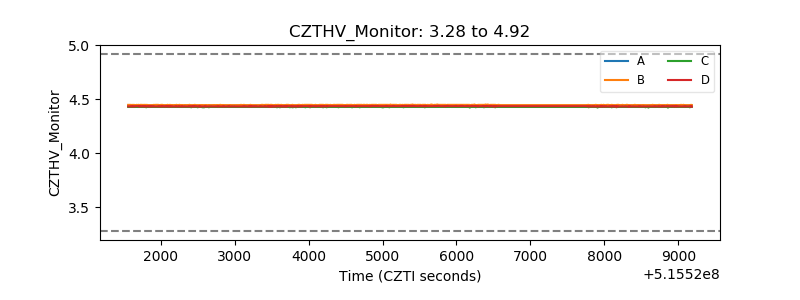 |
| D_VDD | 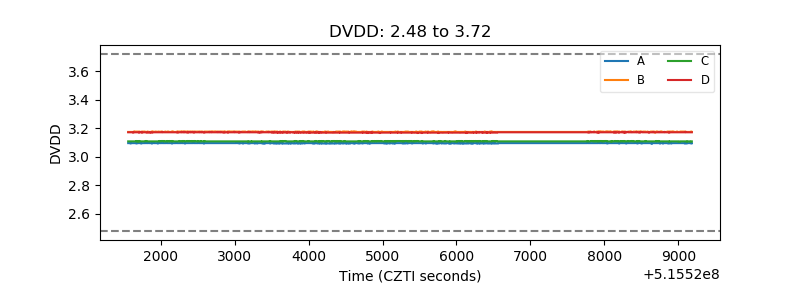 |
| Temperature 1 | 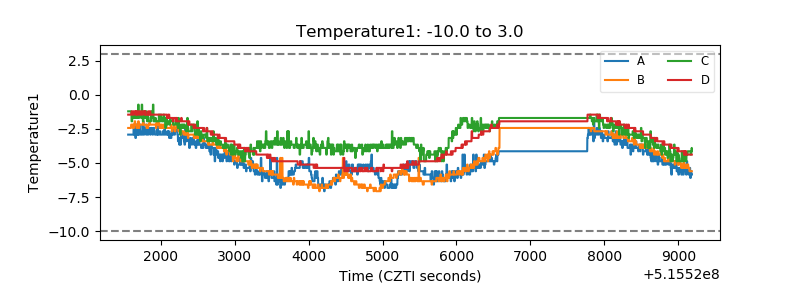 |
| Veto HV Monitor |  |
| Veto LLD | 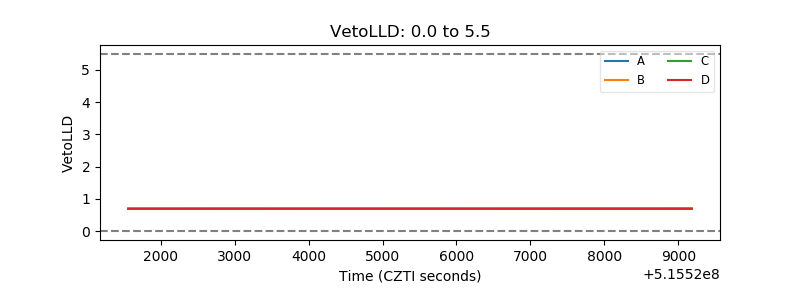 |
| Alpha Counter | 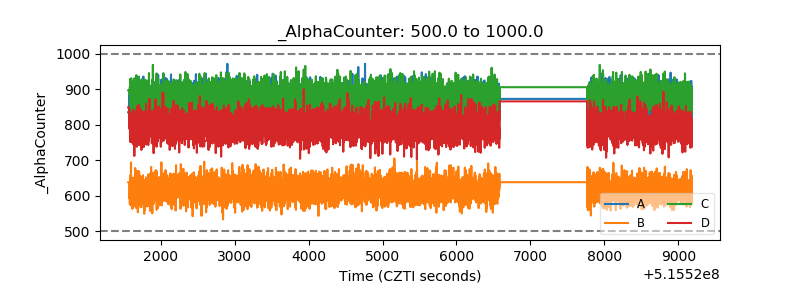 |
| _CPM_Rate | 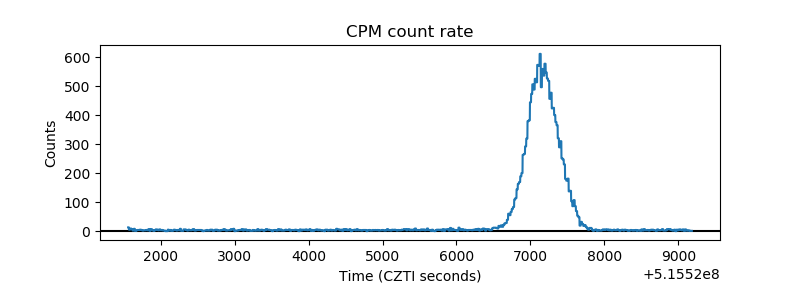 |
| CZT Counter | 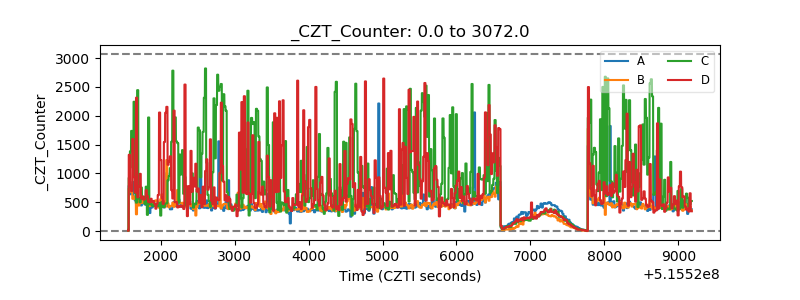 |
| +2.5 Volts monitor | 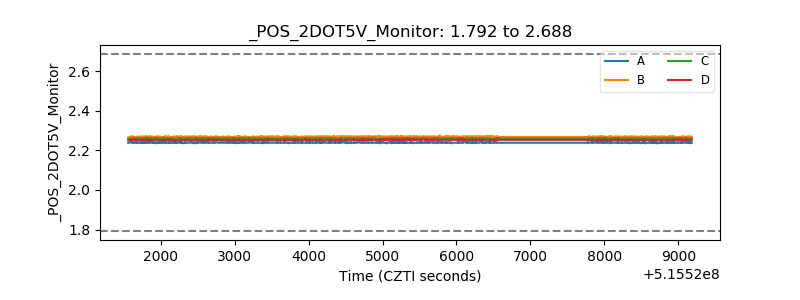 |
| +5 Volts monitor | 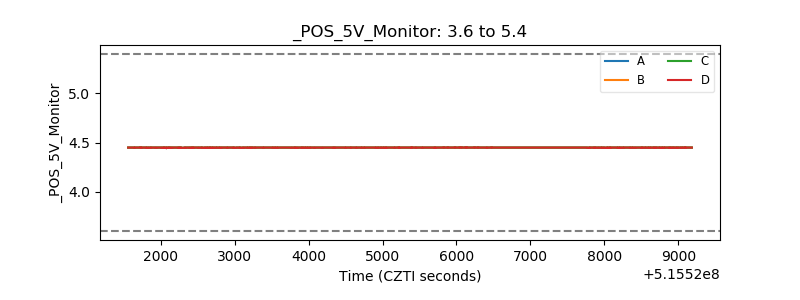 |
| _ROLL_ROT | 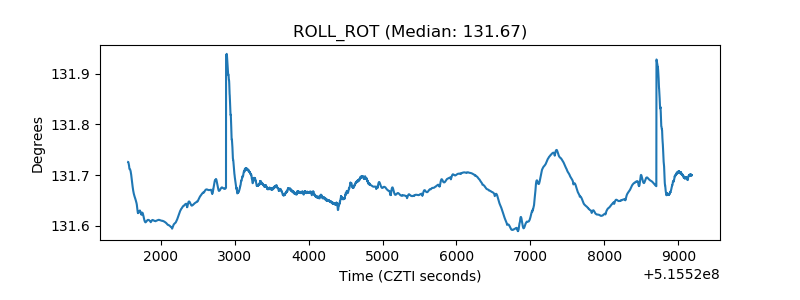 |
| _Roll_DEC | 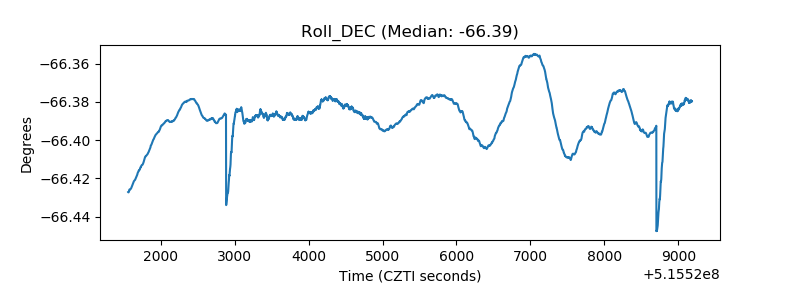 |
| _Roll_RA | 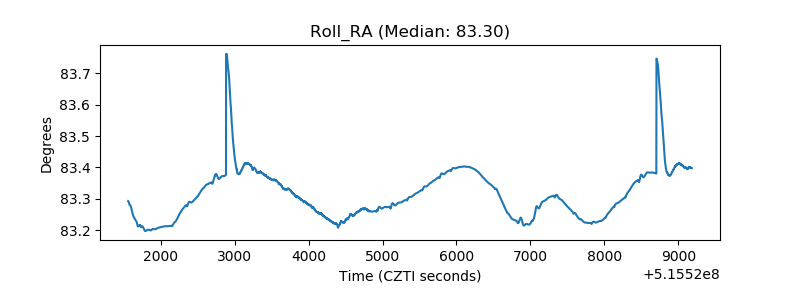 |
| Veto Counter | 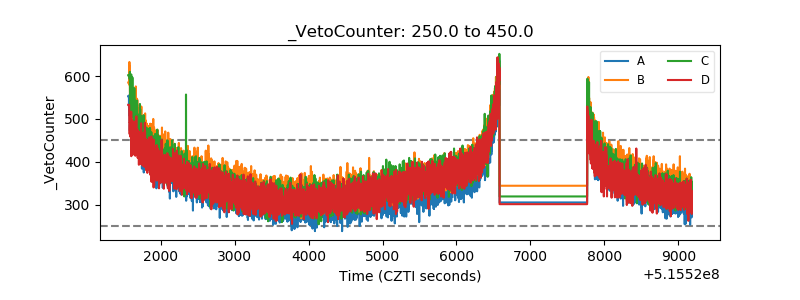 |