| Param | Original file | Final file |
|---|---|---|
| Filename | modeM0/AS1A14_102T01_9000006572_57337cztM0_level2.fits | modeM0/AS1A14_102T01_9000006572_57337cztM0_level2_quad_clean.evt |
| Size (bytes) | 503,994,240 | 94,060,800 |
| Size | 480.6 MB | 89.7 MB |
| Events in quadrant A | 2,858,037 | 639,261 |
| Events in quadrant B | 3,227,829 | 679,379 |
| Events in quadrant C | 6,377,727 | 545,208 |
| Events in quadrant D | 5,688,489 | 530,965 |
| Mode M0 | |||
|---|---|---|---|
| Quadrant | BADHDUFLAG | Total packets | Discarded packets |
| A | 0 | 13584 | 196 |
| B | 0 | 14519 | 183 |
| C | 0 | 24012 | 475 |
| D | 0 | 21680 | 295 |
| Mode M9 | |||
|---|---|---|---|
| Quadrant | BADHDUFLAG | Total packets | Discarded packets |
| A | 0 | 11 | 1 |
| B | 0 | 11 | 0 |
| C | 0 | 11 | 1 |
| D | 0 | 11 | 1 |
| Mode SS | |||
|---|---|---|---|
| Quadrant | BADHDUFLAG | Total packets | Discarded packets |
| A | 0 | 134 | 0 |
| B | 0 | 134 | 0 |
| C | 0 | 134 | 0 |
| D | 0 | 134 | 0 |
| Quadrant | Total seconds | Saturated seconds | Saturation percentage |
|---|---|---|---|
| A | 6501 | 21 | 0.323027% |
| B | 6496 | 129 | 1.985837% |
| C | 6475 | 796 | 12.293436% |
| D | 6488 | 537 | 8.276819% |
Noise dominated data is calculated using 1-second bins in cleaned event files. If a bin has >2000 counts, and if more than 50% of those come from <1% of pixels, then it is considered to be noise-dominated and hence unusable.
| Quadrant | # 1 sec bins | Bins with >0 counts | Bins with >2000 counts | High rate bins dominated by noise | Noise dominated (total time) | Noise dominated (detector-on time) | Marked lightcurve |
|---|---|---|---|---|---|---|---|
| A | 7570 | 6515 | 5 | 5 | 0.07% | 0.08% | 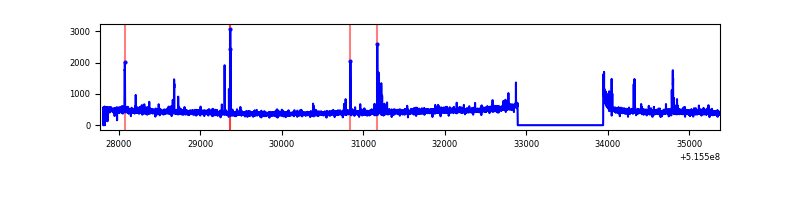 |
| B | 7594 | 6519 | 63 | 63 | 0.83% | 0.97% | 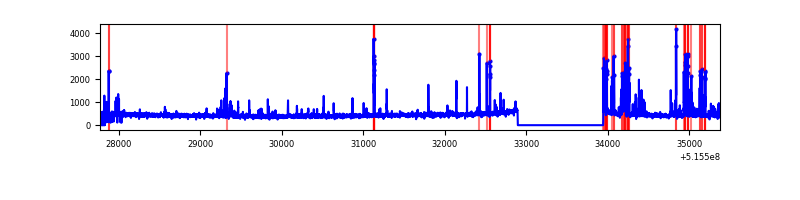 |
| C | 7564 | 6496 | 612 | 612 | 8.09% | 9.42% | 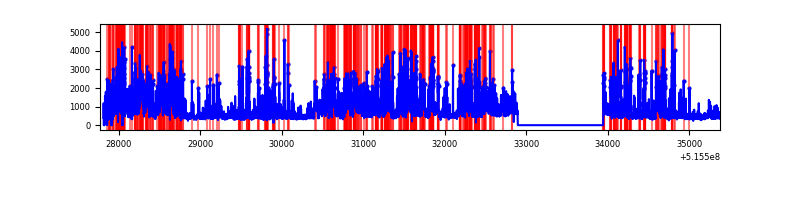 |
| D | 7608 | 6510 | 491 | 491 | 6.45% | 7.54% | 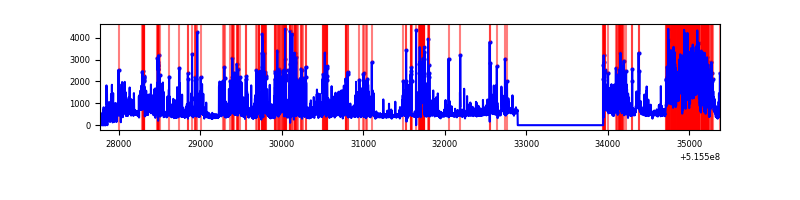 |
Top three noisy pixels from each quadrant. If the there are fewer than three noisy pixels in the level2.evt file, extra rows are filled as -1
| Pixel properties | Quadrant properties | ||||||
|---|---|---|---|---|---|---|---|
| Quadrant | DetID | PixID | Counts | Sigma | Mean | Median | Sigma |
| A | 0 | 12 | 58714 | 337.41 | 701 | 684 | 172.0 |
| A | 3 | 14 | 17753 | 99.25 | 701 | 684 | 172.0 |
| A | 4 | 3 | 12159 | 66.72 | 701 | 684 | 172.0 |
| B | 10 | 16 | 157013 | 1049.33 | 691 | 665 | 149.0 |
| B | 5 | 185 | 104518 | 697.01 | 691 | 665 | 149.0 |
| B | 7 | 252 | 103763 | 691.94 | 691 | 665 | 149.0 |
| C | 15 | 224 | 2096550 | 11996.14 | 637 | 631 | 174.7 |
| C | 6 | 223 | 934035 | 5342.4 | 637 | 631 | 174.7 |
| C | 12 | 252 | 485693 | 2776.29 | 637 | 631 | 174.7 |
| D | 3 | 224 | 1725023 | 9361.43 | 647 | 618 | 184.2 |
| D | 5 | 32 | 558685 | 3029.63 | 647 | 618 | 184.2 |
| D | 8 | 240 | 255946 | 1386.12 | 647 | 618 | 184.2 |
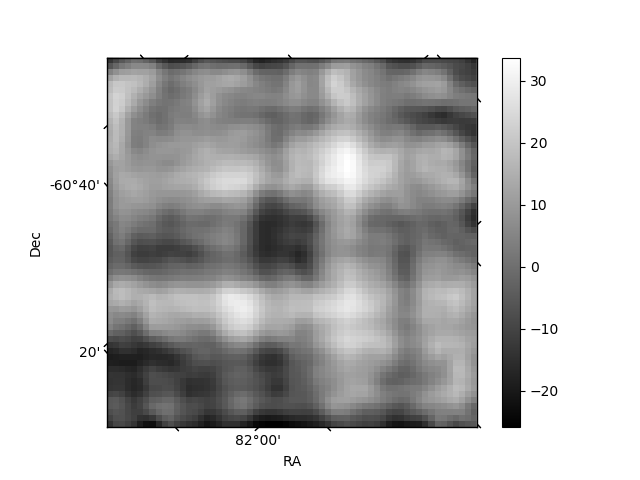
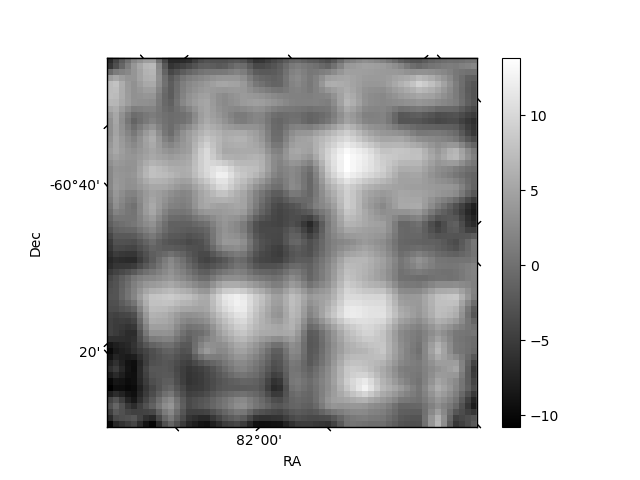
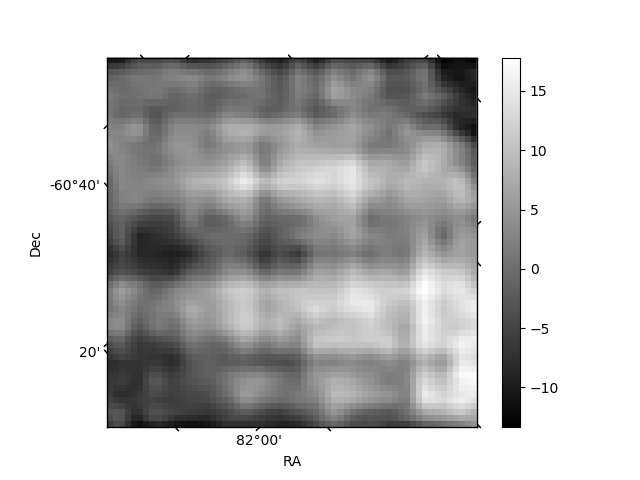
Histogram calculated using DETX and DETY for each event in the final _common_clean file
| Quadrant A | 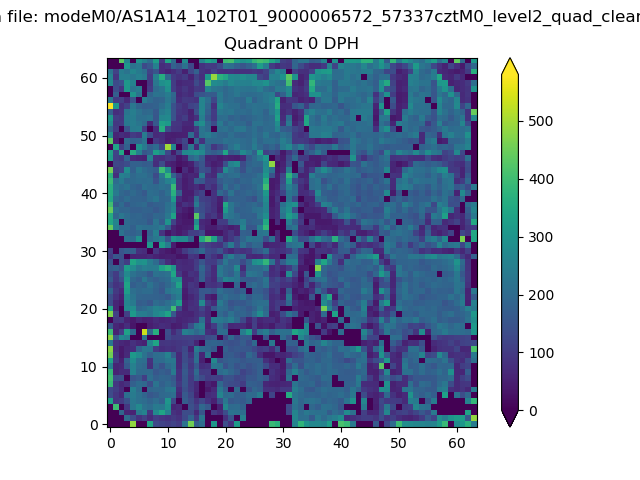 |
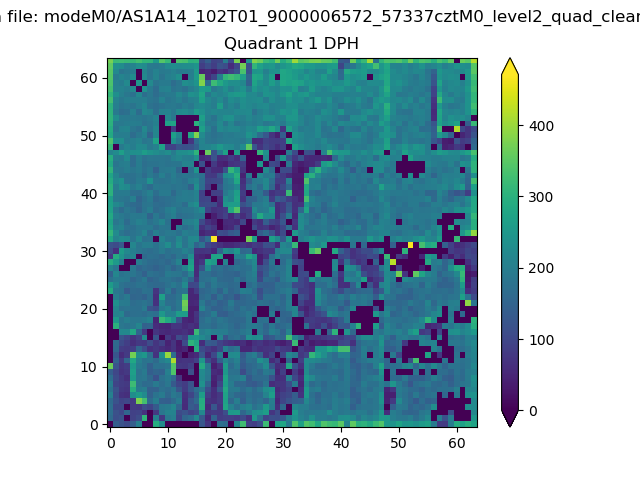 |
Quadrant B |
|---|---|---|---|
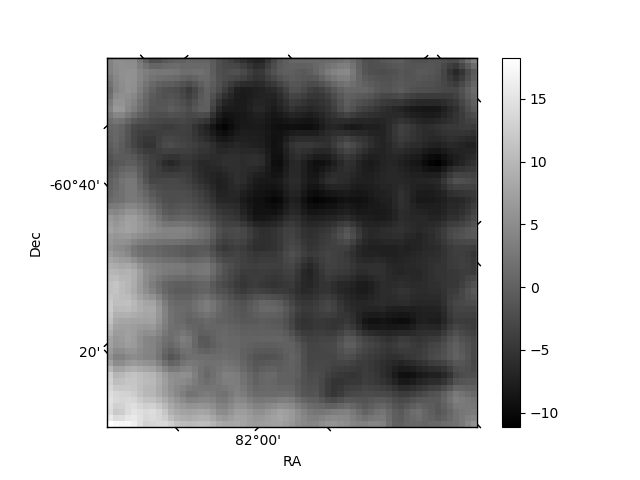
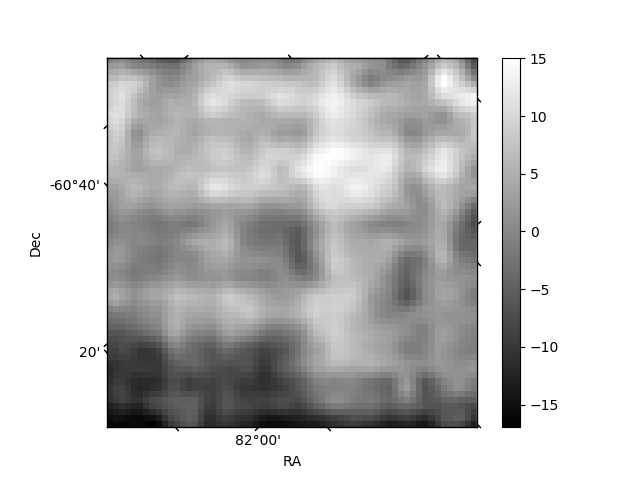
| Quadrant D | 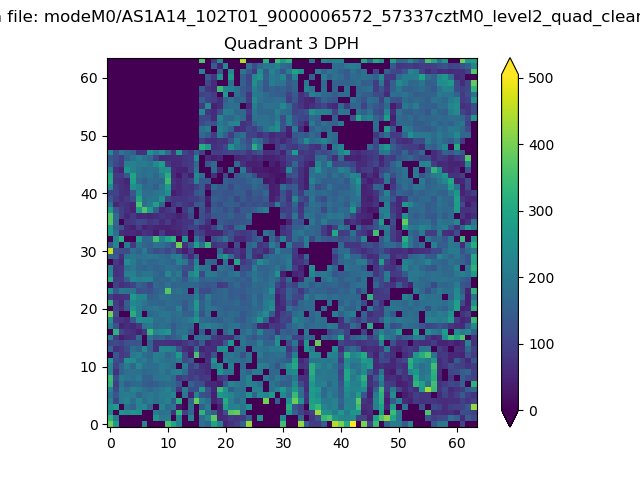 |
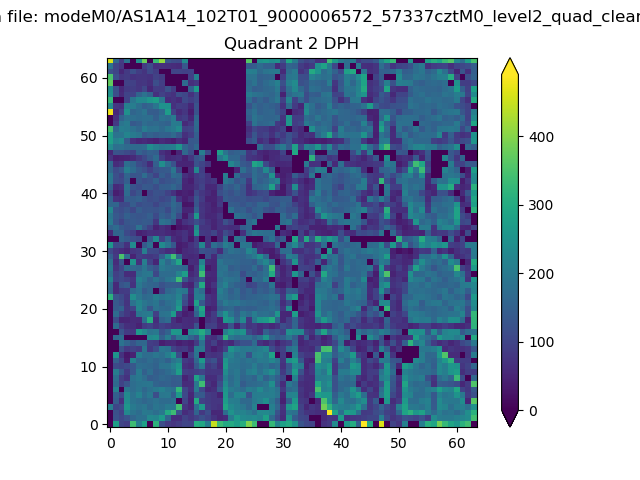 |
Quadrant C |
| Plot type | Count rate plots | Images |
|---|---|---|
| Comparison with Poisson distribution Blue bars denote a histogram of data divided into 1 sec bins. Red curve is a Poisson curve with rate = median count rate of data. |
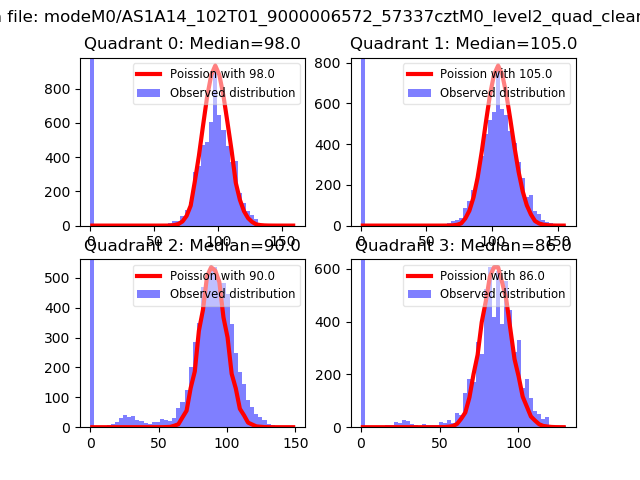 |
 |
| Quadrant-wise count rates Data is divided into 100 sec bins |
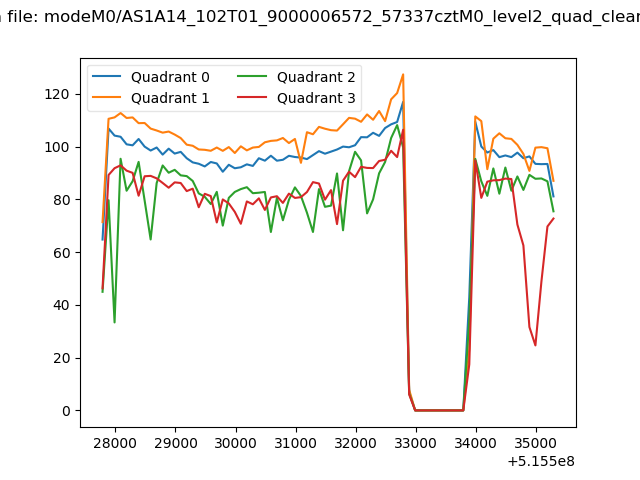 |
|
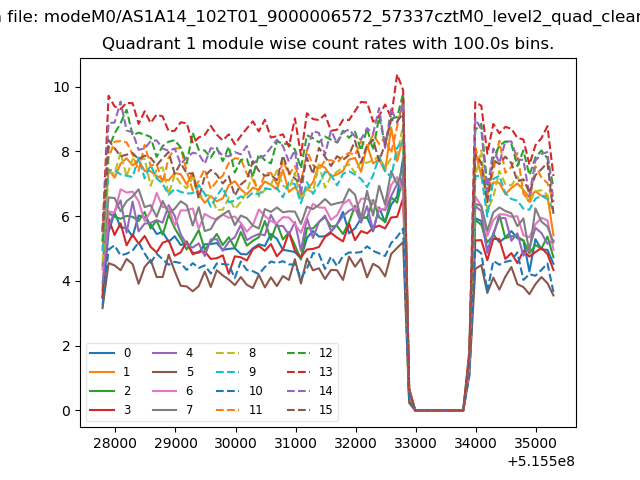
| Module-wise count rates for Quadrant A Data is divided into 100 sec bins |
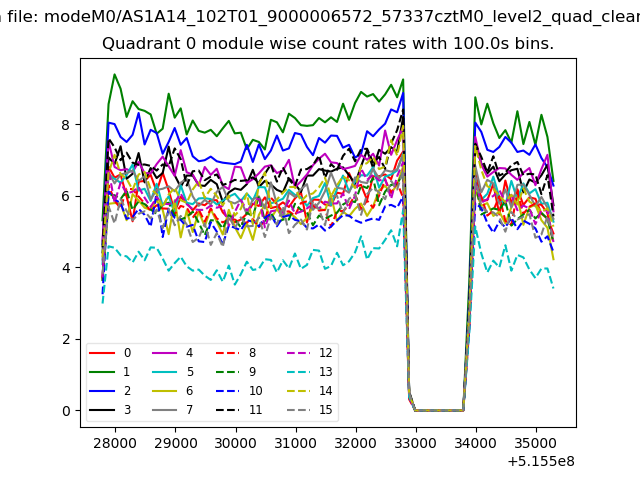 |
 |
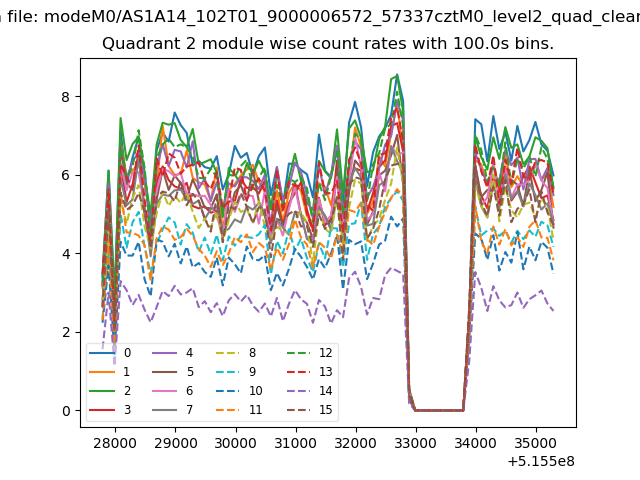
| Module-wise count rates for Quadrant B Data is divided into 100 sec bins |
 |
 |
| Module-wise count rates for Quadrant C Data is divided into 100 sec bins |
 |
 |
| Module-wise count rates for Quadrant D Data is divided into 100 sec bins |
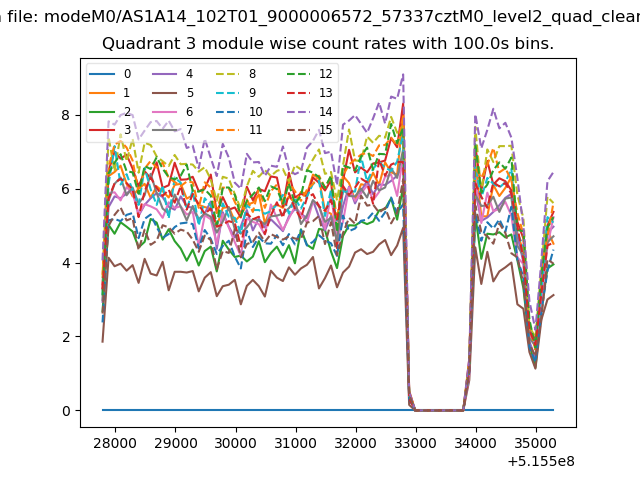 |
 |
| Parameter | Plot |
|---|---|
| CZT HV Monitor | 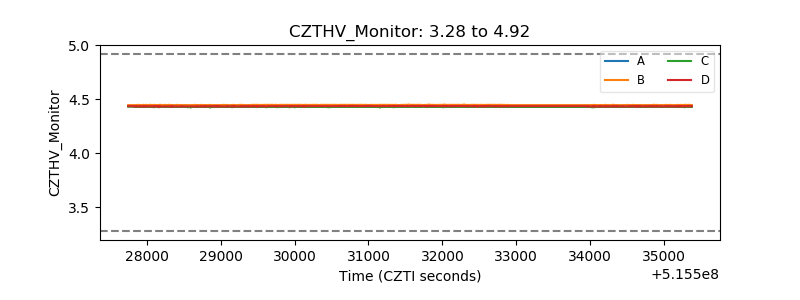 |
| D_VDD | 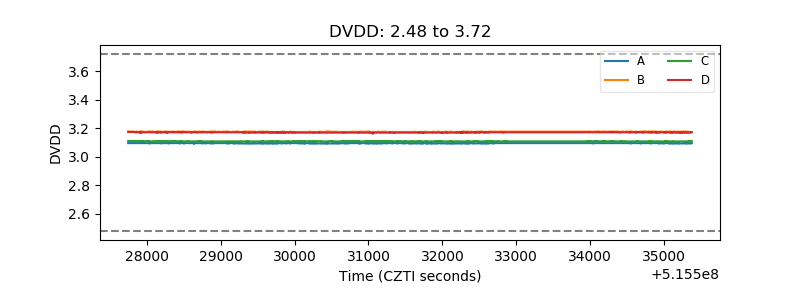 |
| Temperature 1 | 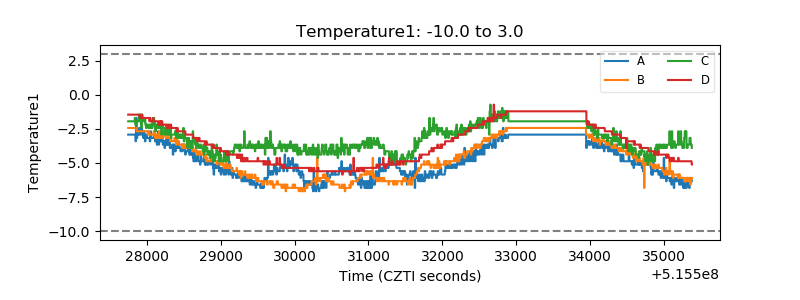 |
| Veto HV Monitor | 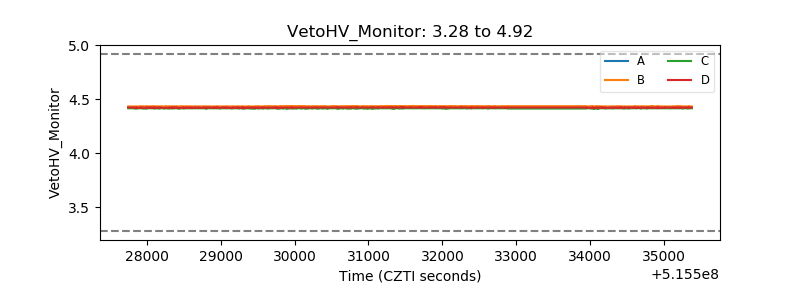 |
| Veto LLD | 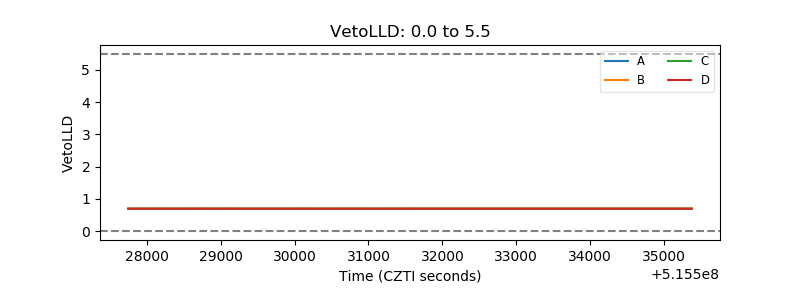 |
| Alpha Counter | 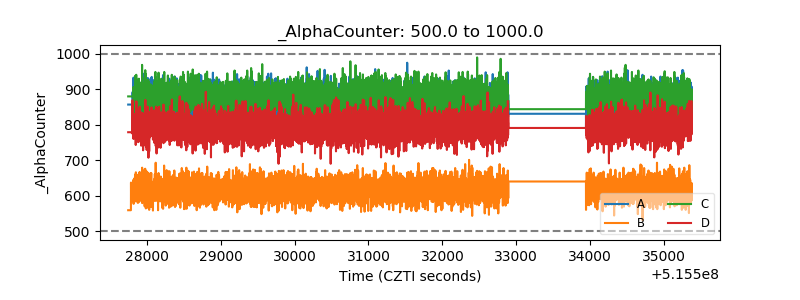 |
| _CPM_Rate | 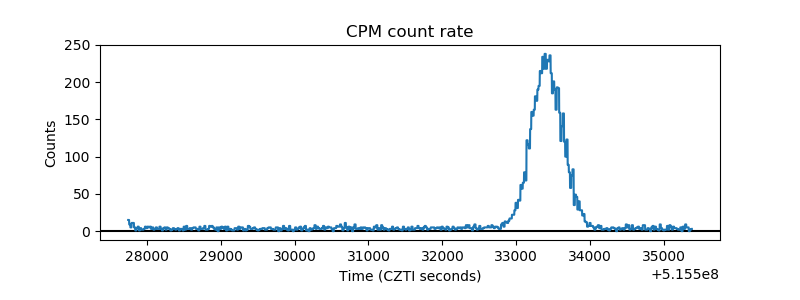 |
| CZT Counter | 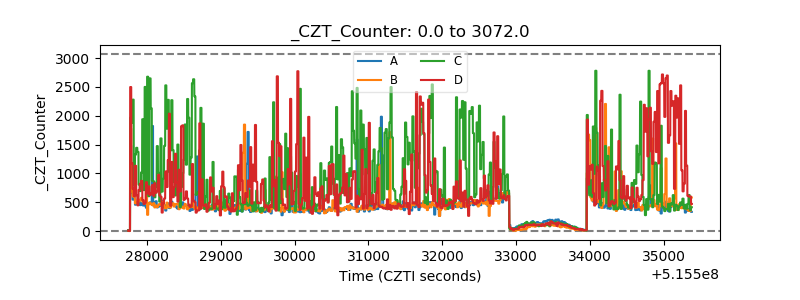 |
| +2.5 Volts monitor |  |
| +5 Volts monitor |  |
| _ROLL_ROT | 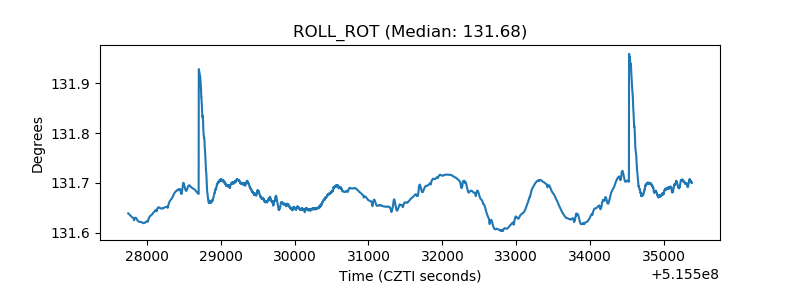 |
| _Roll_DEC | 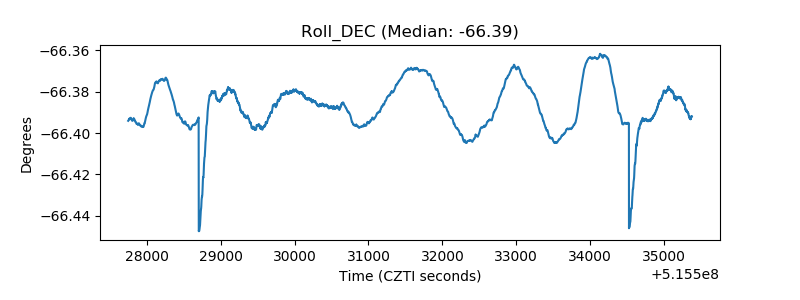 |
| _Roll_RA | 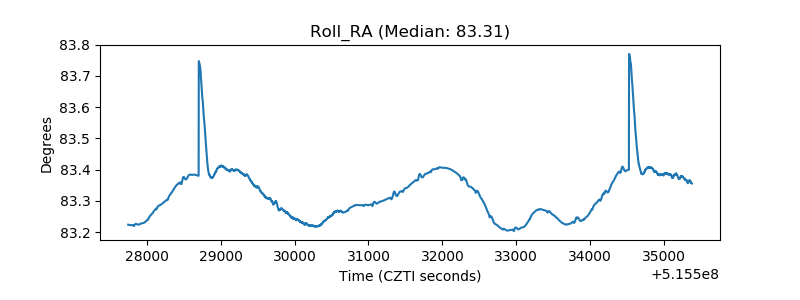 |
| Veto Counter | 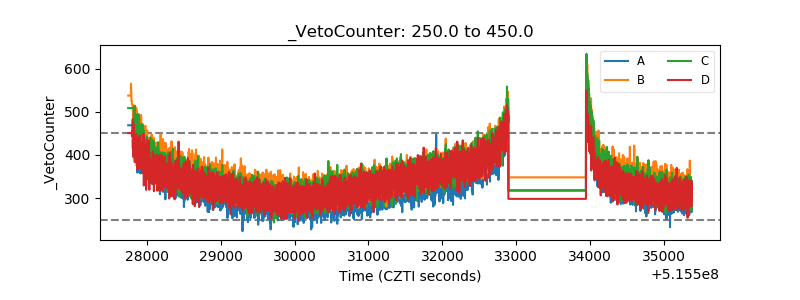 |