| Param | Original file | Final file |
|---|---|---|
| Filename | modeM0/AS1A14_102T01_9000006572_57338cztM0_level2.fits | modeM0/AS1A14_102T01_9000006572_57338cztM0_level2_quad_clean.evt |
| Size (bytes) | 553,521,600 | 86,826,240 |
| Size | 527.9 MB | 82.8 MB |
| Events in quadrant A | 3,565,482 | 579,827 |
| Events in quadrant B | 5,166,656 | 574,344 |
| Events in quadrant C | 4,848,204 | 531,321 |
| Events in quadrant D | 6,377,864 | 465,950 |
| Mode M0 | |||
|---|---|---|---|
| Quadrant | BADHDUFLAG | Total packets | Discarded packets |
| A | 0 | 15759 | 1 |
| B | 0 | 20320 | 1 |
| C | 0 | 19246 | 1 |
| D | 0 | 23744 | 1 |
| Mode M9 | |||
|---|---|---|---|
| Quadrant | BADHDUFLAG | Total packets | Discarded packets |
| A | 0 | 7 | 0 |
| B | 0 | 7 | 0 |
| C | 0 | 7 | 0 |
| D | 0 | 7 | 0 |
| Mode SS | |||
|---|---|---|---|
| Quadrant | BADHDUFLAG | Total packets | Discarded packets |
| A | 0 | 140 | 0 |
| B | 0 | 140 | 0 |
| C | 0 | 140 | 0 |
| D | 0 | 140 | 0 |
| Quadrant | Total seconds | Saturated seconds | Saturation percentage |
|---|---|---|---|
| A | 6844 | 76 | 1.110462% |
| B | 6845 | 903 | 13.192111% |
| C | 6845 | 337 | 4.923302% |
| D | 6845 | 682 | 9.963477% |
Noise dominated data is calculated using 1-second bins in cleaned event files. If a bin has >2000 counts, and if more than 50% of those come from <1% of pixels, then it is considered to be noise-dominated and hence unusable.
| Quadrant | # 1 sec bins | Bins with >0 counts | Bins with >2000 counts | High rate bins dominated by noise | Noise dominated (total time) | Noise dominated (detector-on time) | Marked lightcurve |
|---|---|---|---|---|---|---|---|
| A | 7844 | 7120 | 39 | 39 | 0.50% | 0.55% | 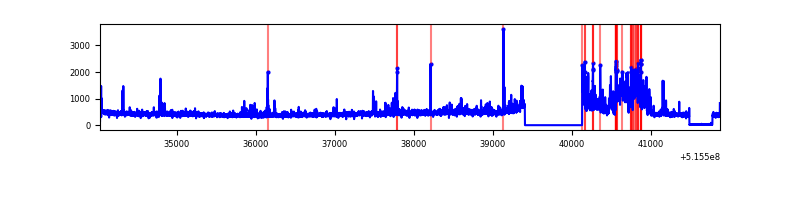 |
| B | 7845 | 7121 | 643 | 643 | 8.20% | 9.03% |  |
| C | 7845 | 7121 | 271 | 271 | 3.45% | 3.81% | 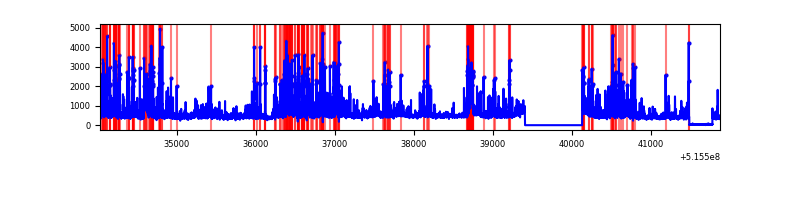 |
| D | 7845 | 7121 | 603 | 603 | 7.69% | 8.47% | 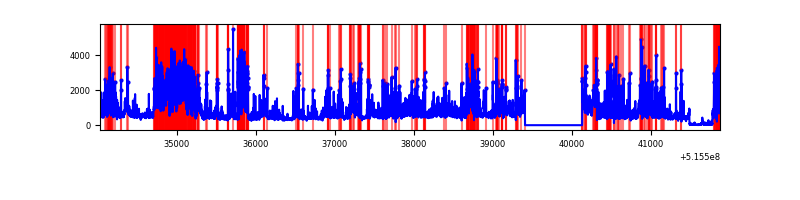 |
Top three noisy pixels from each quadrant. If the there are fewer than three noisy pixels in the level2.evt file, extra rows are filled as -1
| Pixel properties | Quadrant properties | ||||||
|---|---|---|---|---|---|---|---|
| Quadrant | DetID | PixID | Counts | Sigma | Mean | Median | Sigma |
| A | 0 | 12 | 635462 | 3545.85 | 729 | 711 | 179.0 |
| A | 3 | 14 | 64431 | 355.95 | 729 | 711 | 179.0 |
| A | 13 | 248 | 15919 | 84.95 | 729 | 711 | 179.0 |
| B | 5 | 185 | 2058573 | 14240.99 | 671 | 646 | 144.5 |
| B | 10 | 16 | 148734 | 1024.78 | 671 | 646 | 144.5 |
| B | 7 | 252 | 138341 | 952.86 | 671 | 646 | 144.5 |
| C | 15 | 224 | 1379942 | 7368.9 | 687 | 681 | 187.2 |
| C | 12 | 252 | 330559 | 1762.42 | 687 | 681 | 187.2 |
| C | 6 | 223 | 233008 | 1241.24 | 687 | 681 | 187.2 |
| D | 3 | 224 | 1973191 | 10404.79 | 672 | 641 | 189.6 |
| D | 5 | 32 | 591607 | 3117.22 | 672 | 641 | 189.6 |
| D | 15 | 142 | 395544 | 2083.03 | 672 | 641 | 189.6 |
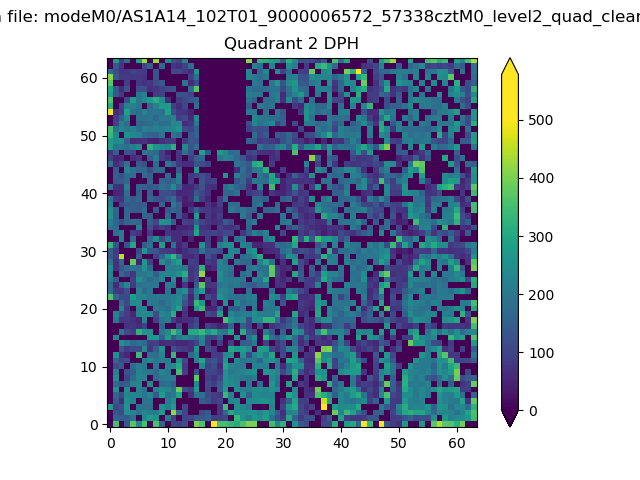
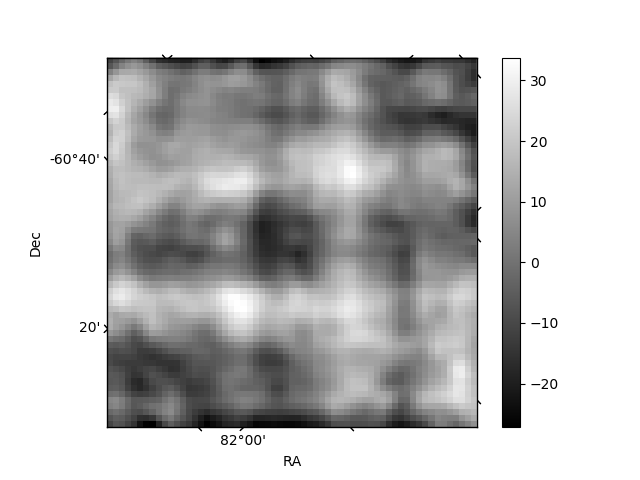
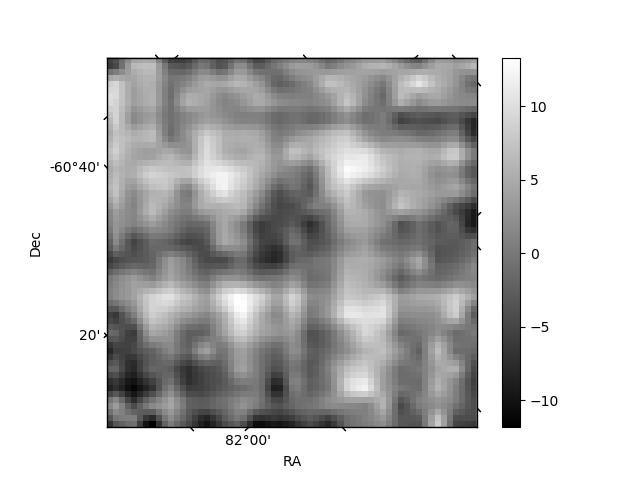
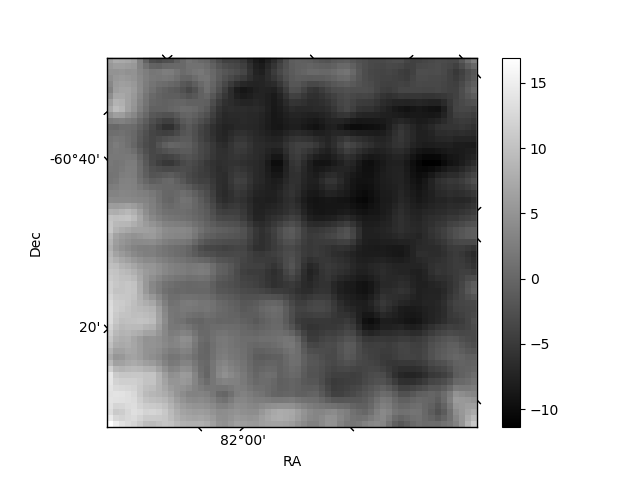
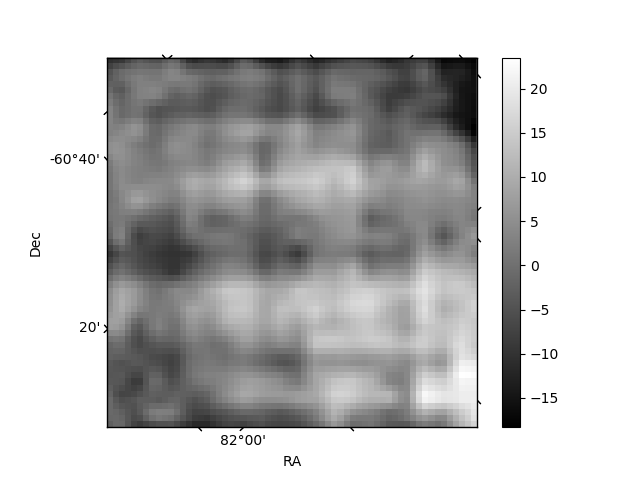
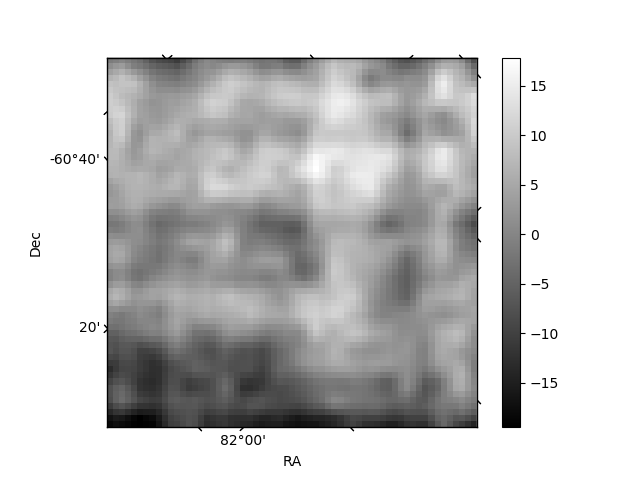
Histogram calculated using DETX and DETY for each event in the final _common_clean file
| Quadrant A | 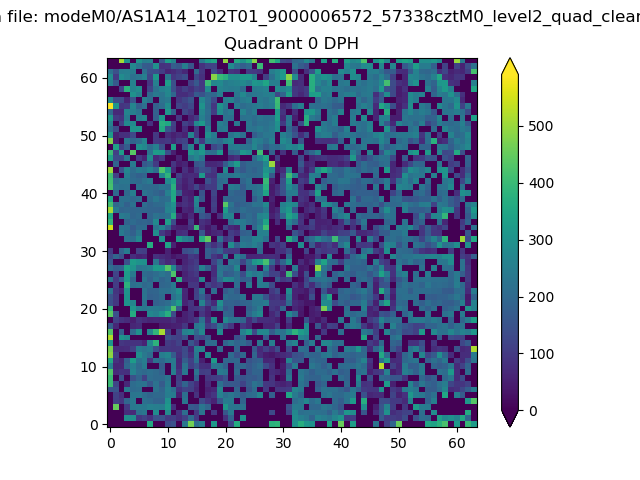 |
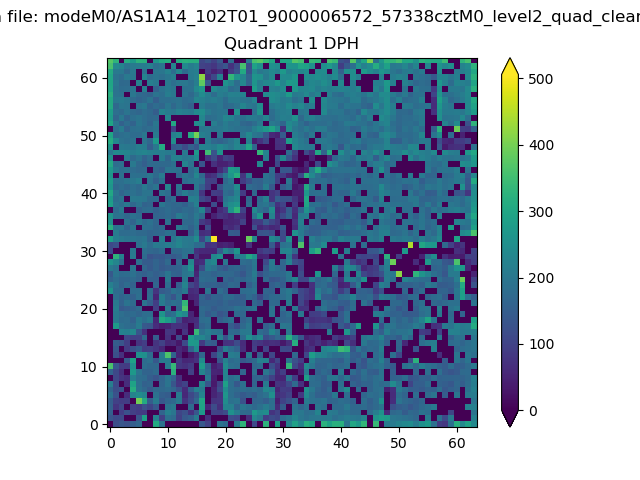 |
Quadrant B |
|---|---|---|---|
| Quadrant D | 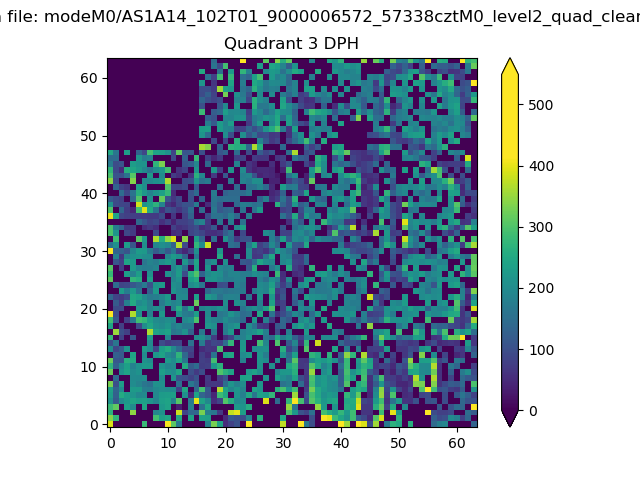 |
 |
Quadrant C |
| Plot type | Count rate plots | Images |
|---|---|---|
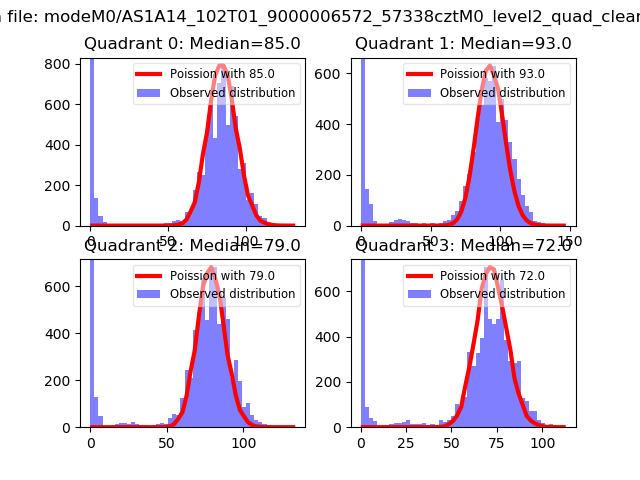
| Comparison with Poisson distribution Blue bars denote a histogram of data divided into 1 sec bins. Red curve is a Poisson curve with rate = median count rate of data. |
 |
 |
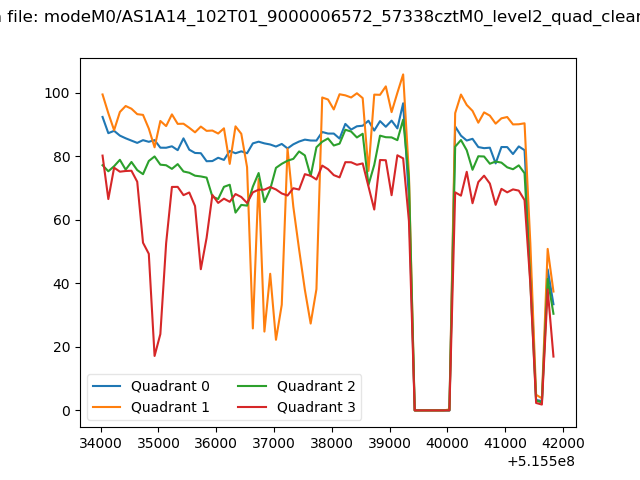
| Quadrant-wise count rates Data is divided into 100 sec bins |
 |
|
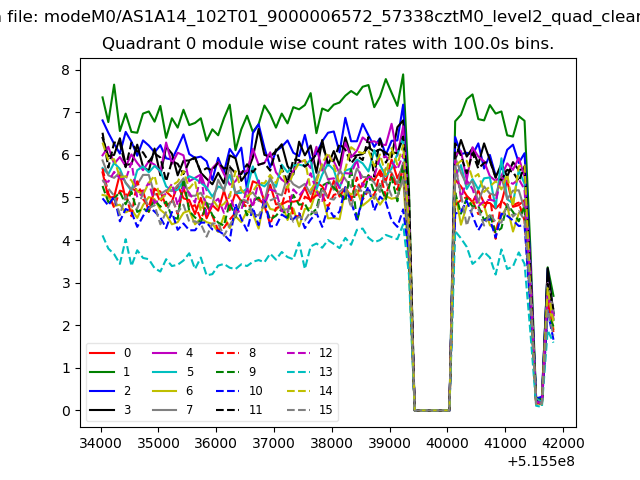
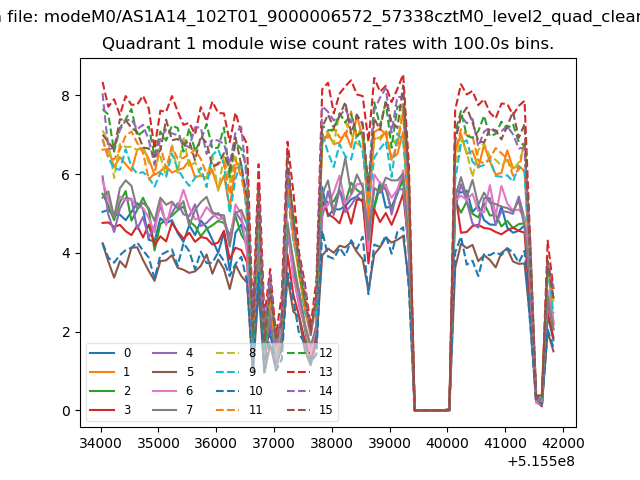
| Module-wise count rates for Quadrant A Data is divided into 100 sec bins |
 |
 |
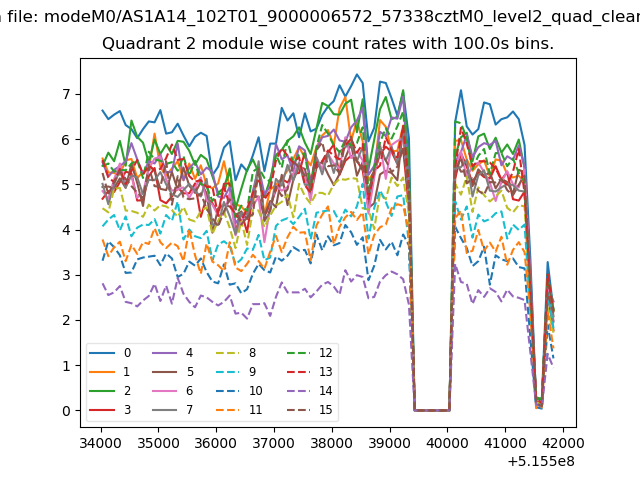
| Module-wise count rates for Quadrant B Data is divided into 100 sec bins |
 |
 |
| Module-wise count rates for Quadrant C Data is divided into 100 sec bins |
 |
 |
| Module-wise count rates for Quadrant D Data is divided into 100 sec bins |
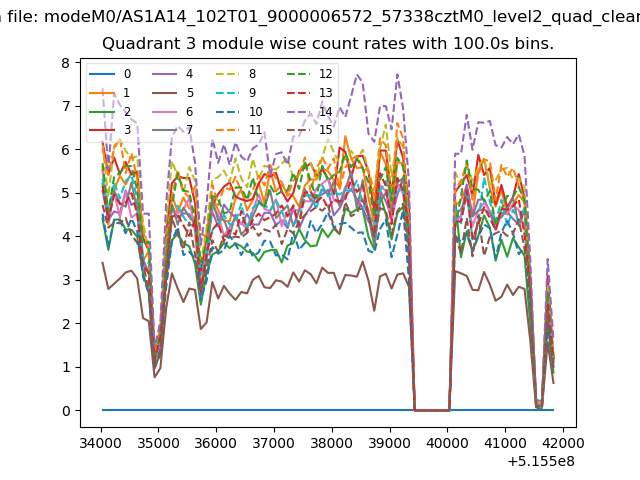 |
 |
| Parameter | Plot |
|---|---|
| CZT HV Monitor | 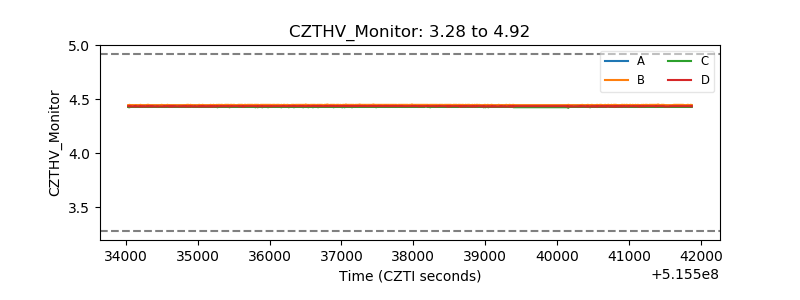 |
| D_VDD | 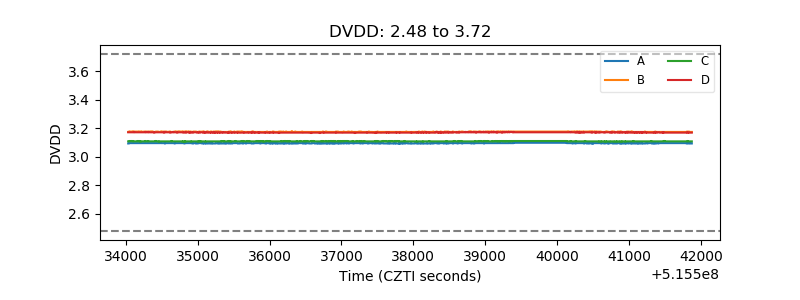 |
| Temperature 1 | 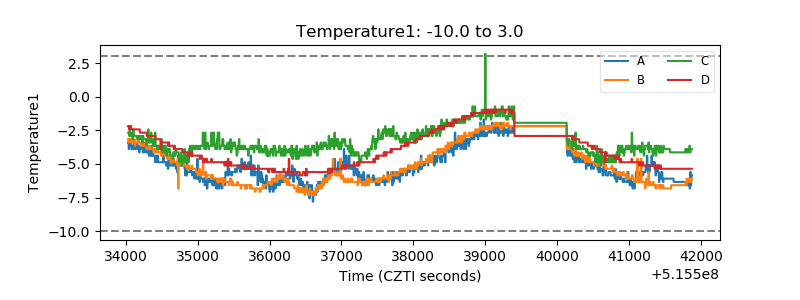 |
| Veto HV Monitor | 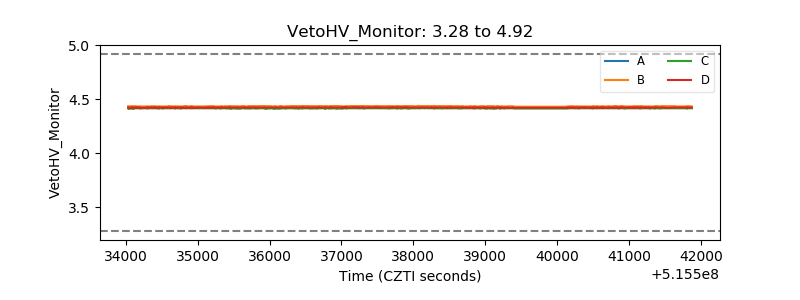 |
| Veto LLD | 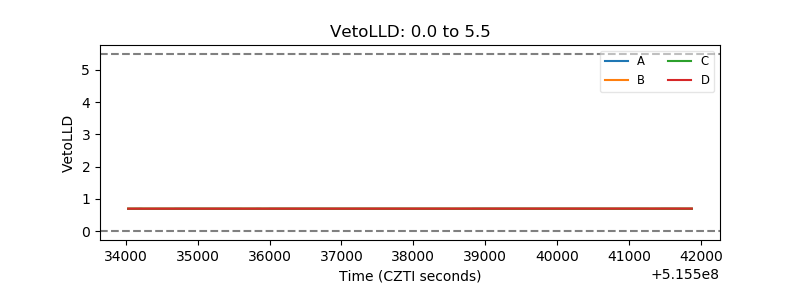 |
| Alpha Counter | 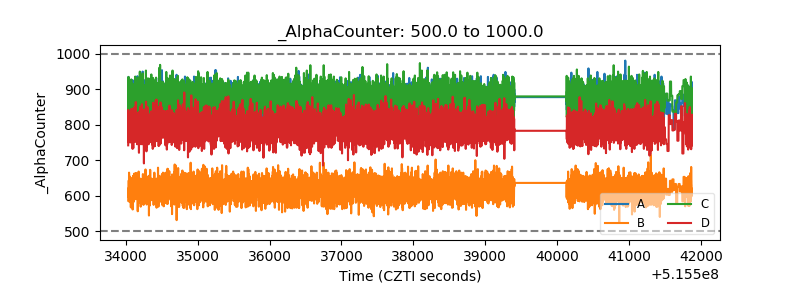 |
| _CPM_Rate | 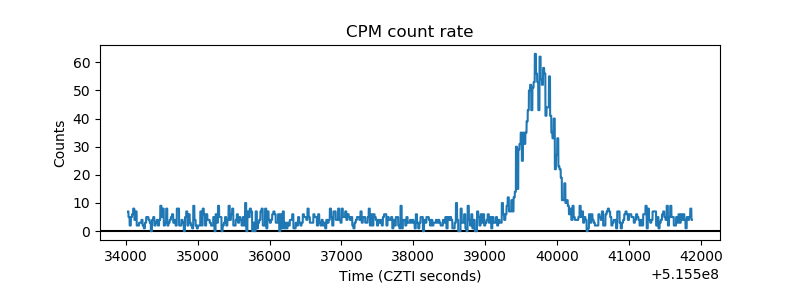 |
| CZT Counter | 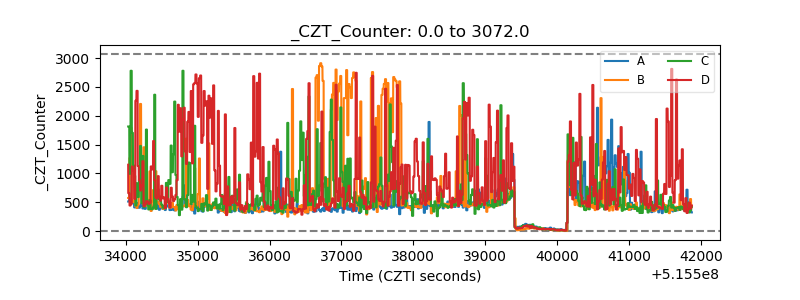 |
| +2.5 Volts monitor | 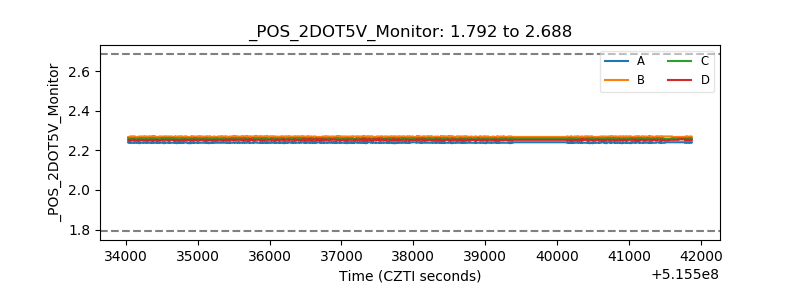 |
| +5 Volts monitor | 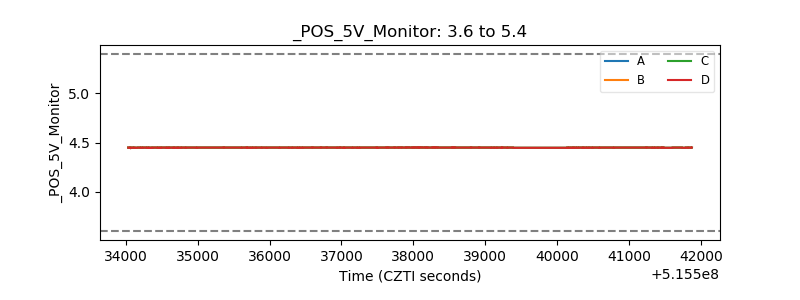 |
| _ROLL_ROT | 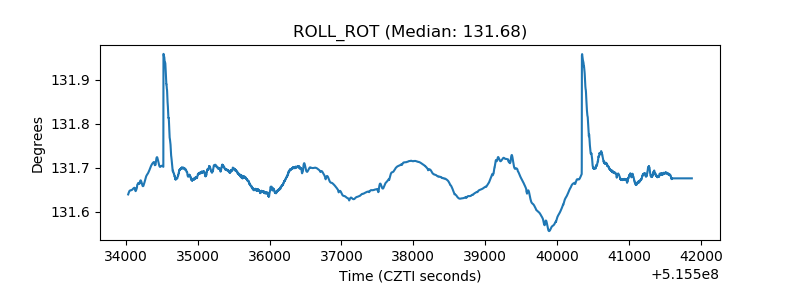 |
| _Roll_DEC | 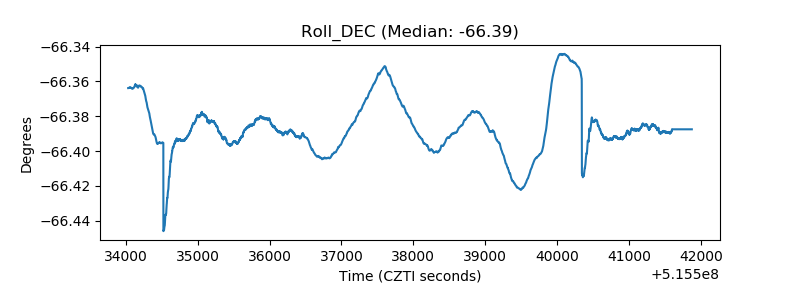 |
| _Roll_RA | 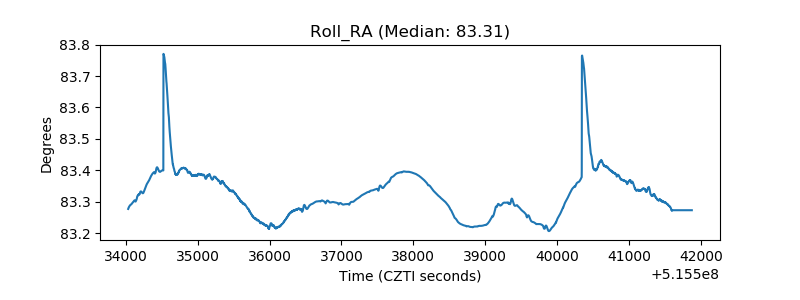 |
| Veto Counter | 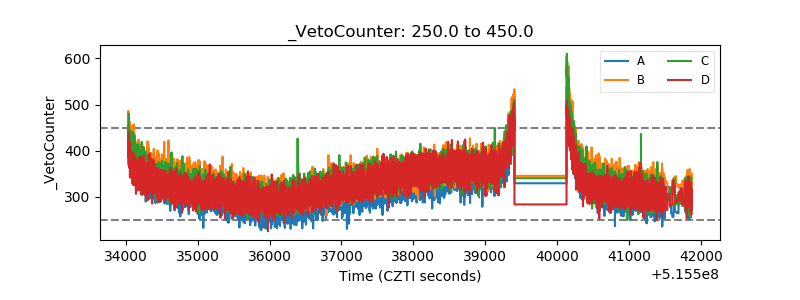 |