| Param | Original file | Final file |
|---|---|---|
| Filename | modeM0/AS1A14_102T01_9000006572_57340cztM0_level2.fits | modeM0/AS1A14_102T01_9000006572_57340cztM0_level2_quad_clean.evt |
| Size (bytes) | 627,238,080 | 109,296,000 |
| Size | 598.2 MB | 104.2 MB |
| Events in quadrant A | 5,213,678 | 698,221 |
| Events in quadrant B | 4,350,359 | 760,578 |
| Events in quadrant C | 5,834,164 | 642,315 |
| Events in quadrant D | 7,146,649 | 604,036 |
| Mode M0 | |||
|---|---|---|---|
| Quadrant | BADHDUFLAG | Total packets | Discarded packets |
| A | 0 | 21874 | 1 |
| B | 0 | 19158 | 1 |
| C | 0 | 23566 | 1 |
| D | 0 | 27301 | 1 |
| Mode SS | |||
|---|---|---|---|
| Quadrant | BADHDUFLAG | Total packets | Discarded packets |
| A | 0 | 176 | 0 |
| B | 0 | 176 | 0 |
| C | 0 | 176 | 0 |
| D | 0 | 176 | 0 |
| Quadrant | Total seconds | Saturated seconds | Saturation percentage |
|---|---|---|---|
| A | 8688 | 126 | 1.450276% |
| B | 8689 | 177 | 2.037058% |
| C | 8689 | 310 | 3.567729% |
| D | 8688 | 521 | 5.996777% |
Noise dominated data is calculated using 1-second bins in cleaned event files. If a bin has >2000 counts, and if more than 50% of those come from <1% of pixels, then it is considered to be noise-dominated and hence unusable.
| Quadrant | # 1 sec bins | Bins with >0 counts | Bins with >2000 counts | High rate bins dominated by noise | Noise dominated (total time) | Noise dominated (detector-on time) | Marked lightcurve |
|---|---|---|---|---|---|---|---|
| A | 9003 | 8964 | 49 | 49 | 0.54% | 0.55% | 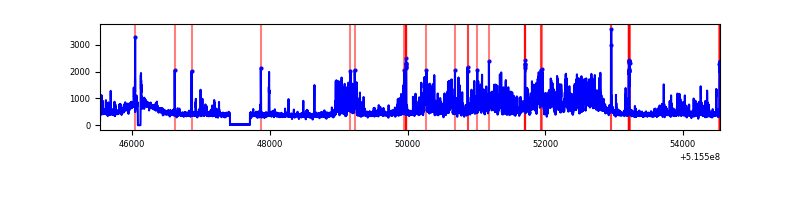 |
| B | 9004 | 8965 | 34 | 34 | 0.38% | 0.38% | 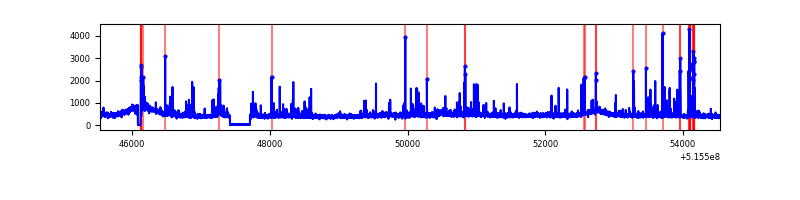 |
| C | 9004 | 8965 | 222 | 222 | 2.47% | 2.48% | 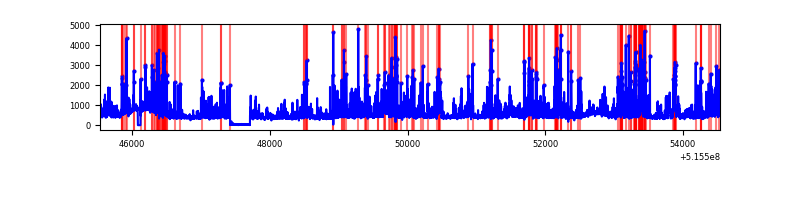 |
| D | 9003 | 8964 | 389 | 389 | 4.32% | 4.34% | 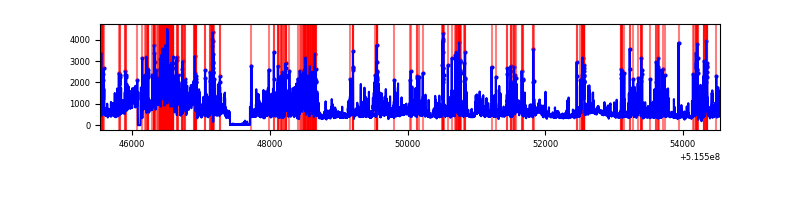 |
Top three noisy pixels from each quadrant. If the there are fewer than three noisy pixels in the level2.evt file, extra rows are filled as -1
| Pixel properties | Quadrant properties | ||||||
|---|---|---|---|---|---|---|---|
| Quadrant | DetID | PixID | Counts | Sigma | Mean | Median | Sigma |
| A | 0 | 12 | 1425122 | 6035.28 | 959 | 934 | 236.0 |
| A | 4 | 3 | 21804 | 88.44 | 959 | 934 | 236.0 |
| A | 8 | 4 | 19907 | 80.4 | 959 | 934 | 236.0 |
| B | 0 | 213 | 165020 | 805.57 | 949 | 913 | 203.7 |
| B | 5 | 185 | 78875 | 382.7 | 949 | 913 | 203.7 |
| B | 7 | 252 | 76367 | 370.39 | 949 | 913 | 203.7 |
| C | 15 | 224 | 1684050 | 6832.83 | 916 | 905 | 246.3 |
| C | 14 | 254 | 161225 | 650.83 | 916 | 905 | 246.3 |
| C | 6 | 223 | 156718 | 632.53 | 916 | 905 | 246.3 |
| D | 3 | 224 | 2018084 | 7906.32 | 907 | 864 | 255.1 |
| D | 3 | 12 | 442685 | 1731.68 | 907 | 864 | 255.1 |
| D | 8 | 240 | 424044 | 1658.62 | 907 | 864 | 255.1 |
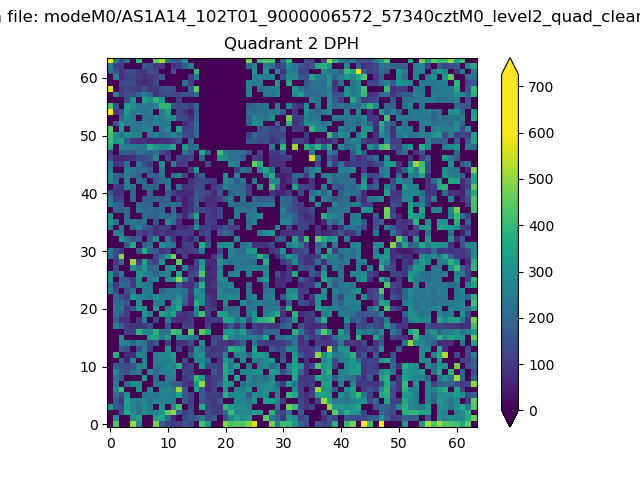
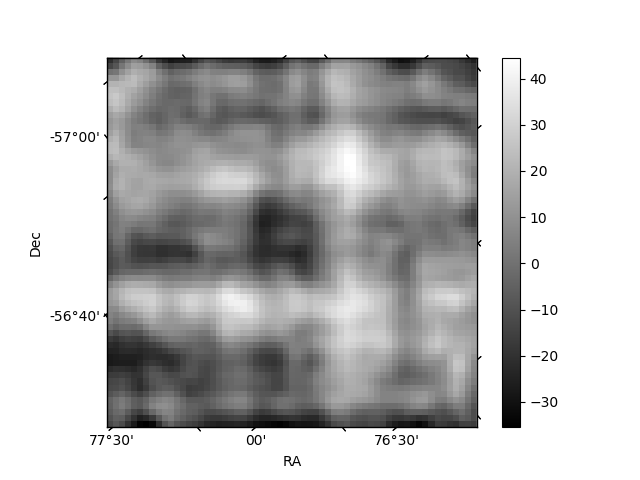
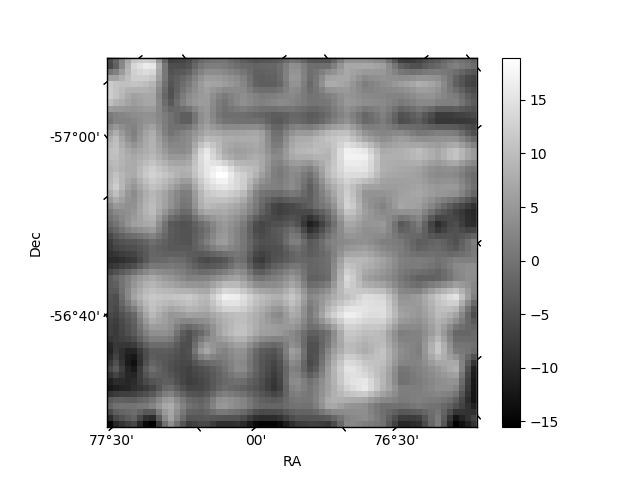
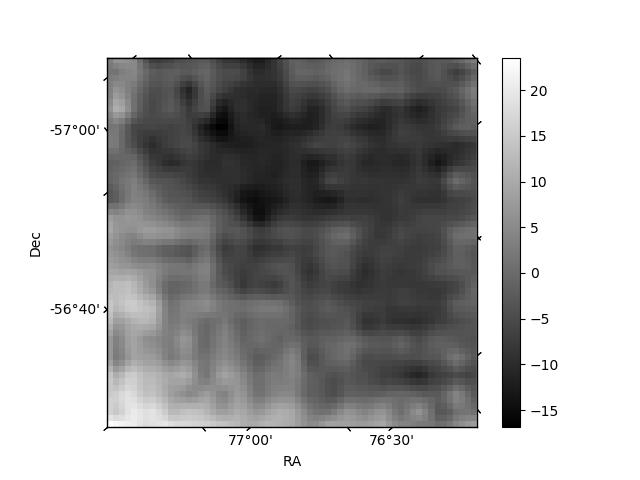
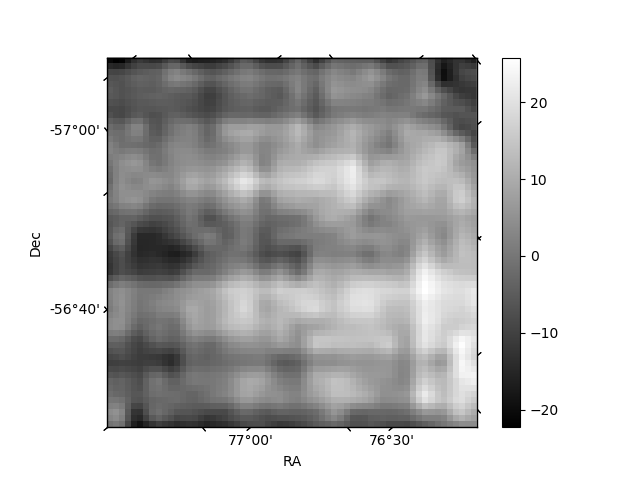
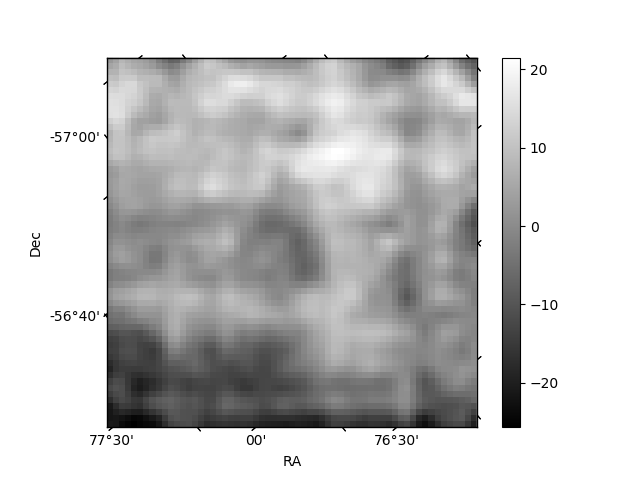
Histogram calculated using DETX and DETY for each event in the final _common_clean file
| Quadrant A | 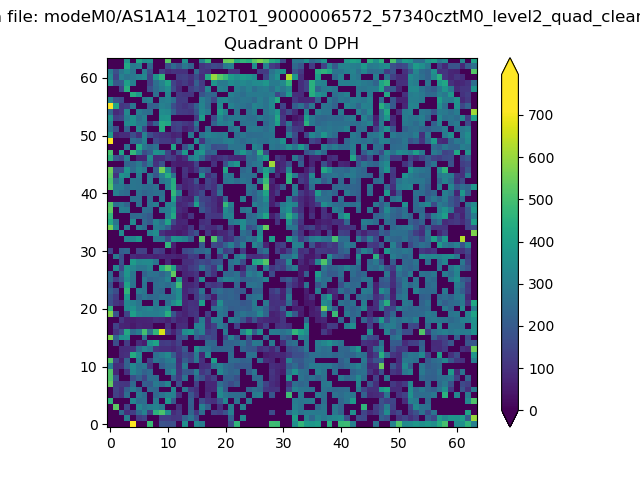 |
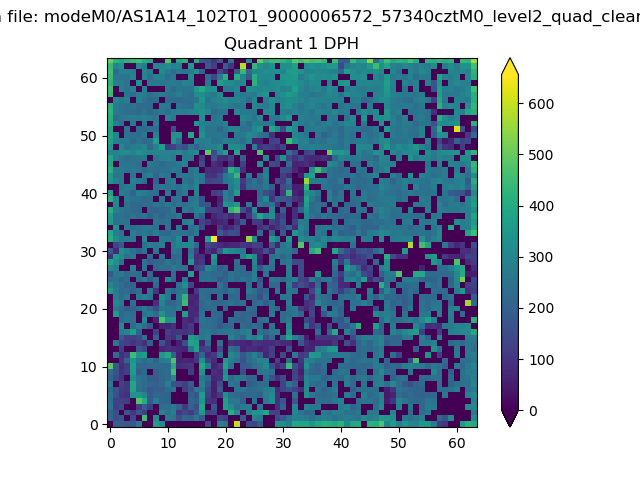 |
Quadrant B |
|---|---|---|---|
| Quadrant D | 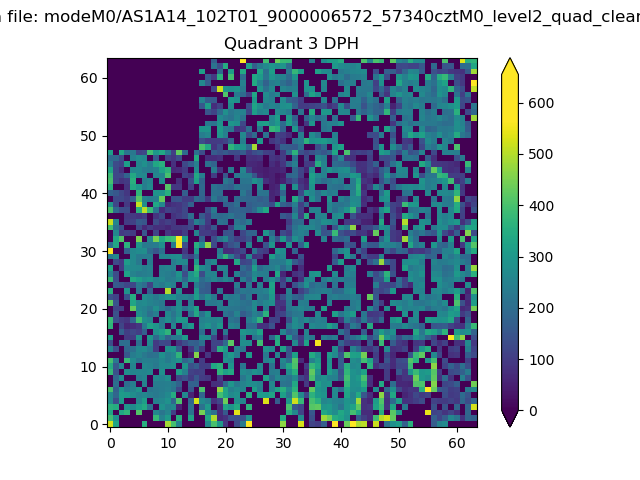 |
 |
Quadrant C |
| Plot type | Count rate plots | Images |
|---|---|---|
| Comparison with Poisson distribution Blue bars denote a histogram of data divided into 1 sec bins. Red curve is a Poisson curve with rate = median count rate of data. |
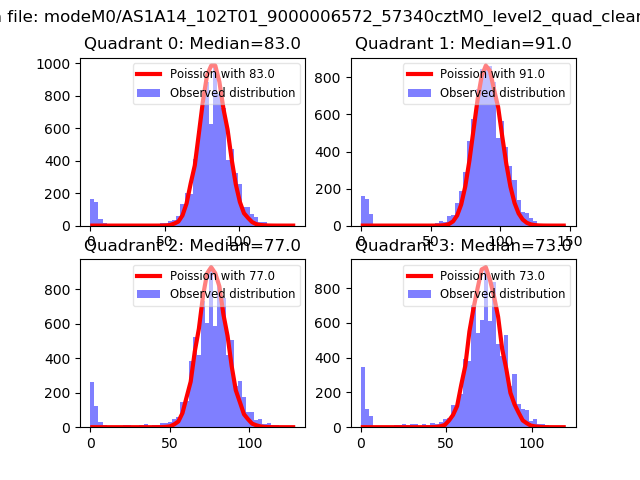 |
 |
| Quadrant-wise count rates Data is divided into 100 sec bins |
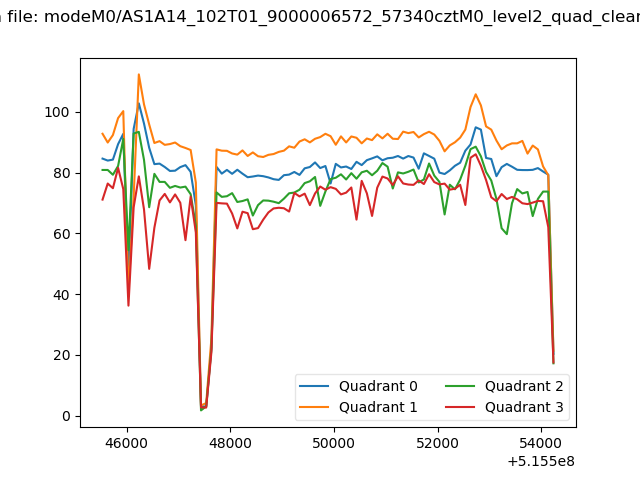 |
|
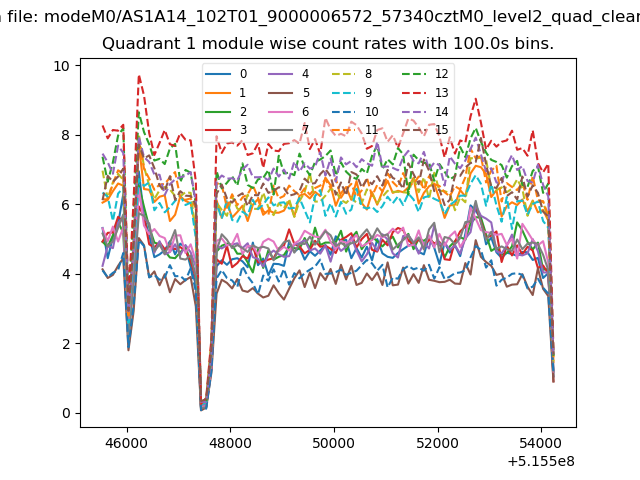
| Module-wise count rates for Quadrant A Data is divided into 100 sec bins |
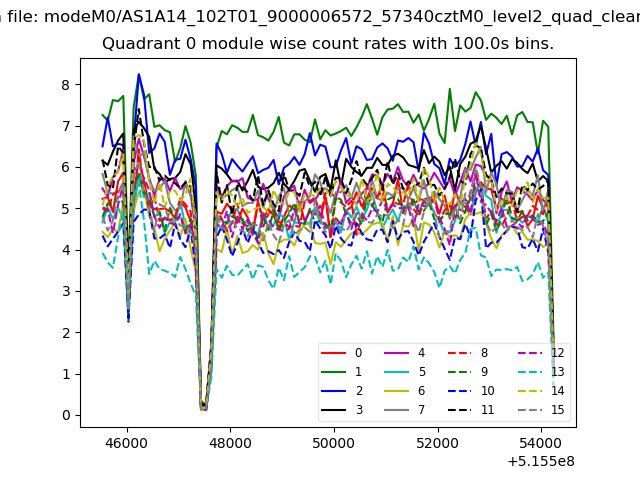 |
 |
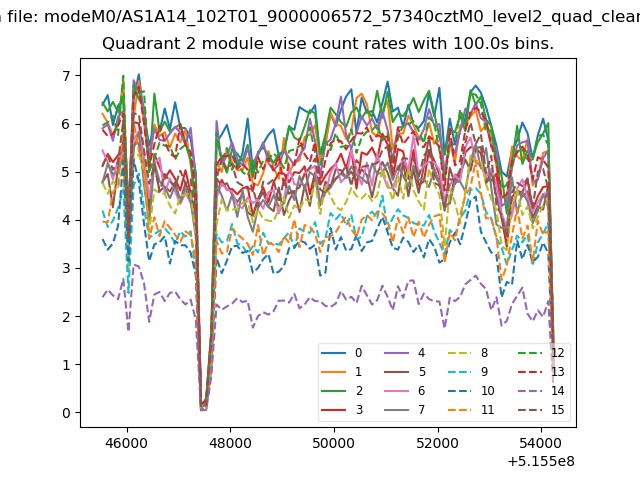
| Module-wise count rates for Quadrant B Data is divided into 100 sec bins |
 |
 |
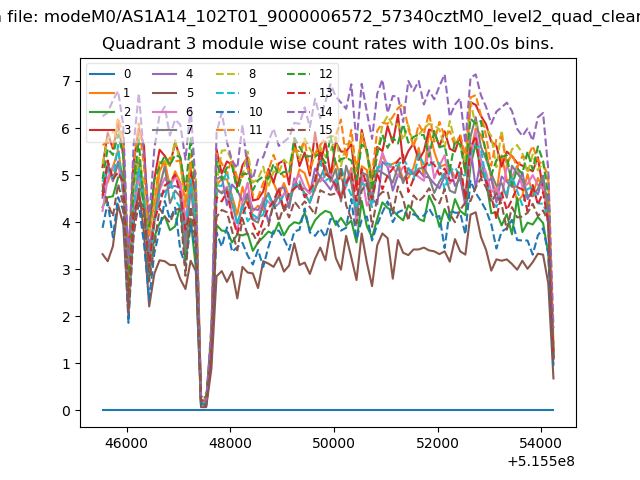
| Module-wise count rates for Quadrant C Data is divided into 100 sec bins |
 |
 |
| Module-wise count rates for Quadrant D Data is divided into 100 sec bins |
 |
 |
| Parameter | Plot |
|---|---|
| CZT HV Monitor |  |
| D_VDD | 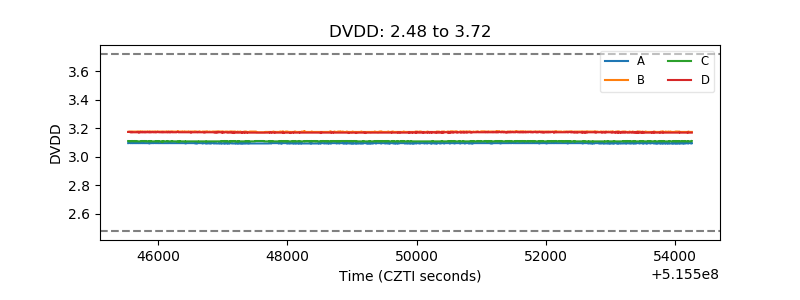 |
| Temperature 1 | 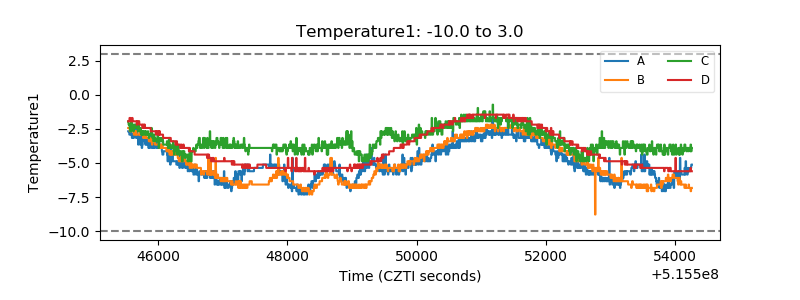 |
| Veto HV Monitor | 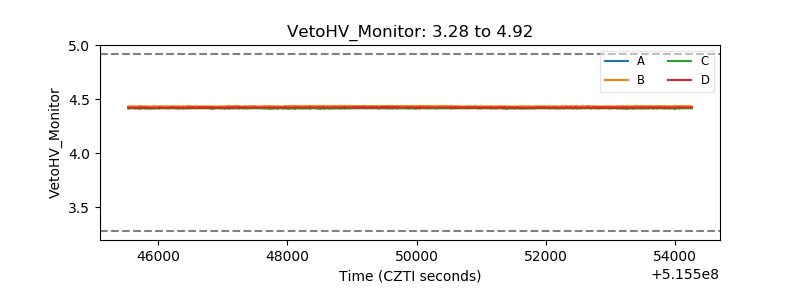 |
| Veto LLD | 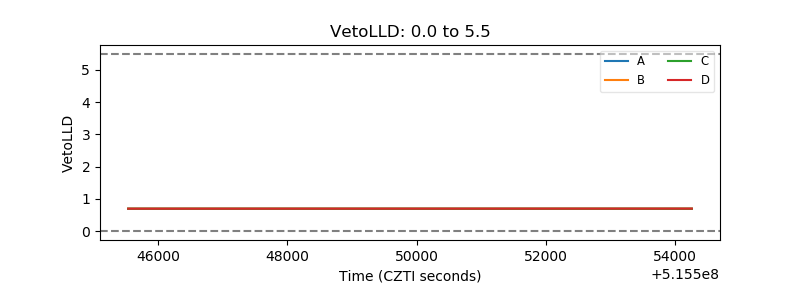 |
| Alpha Counter | 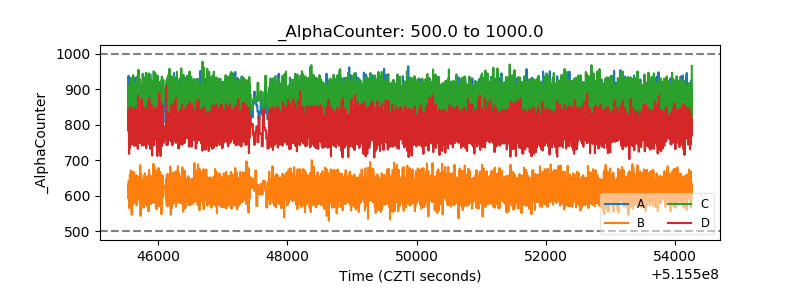 |
| _CPM_Rate |  |
| CZT Counter | 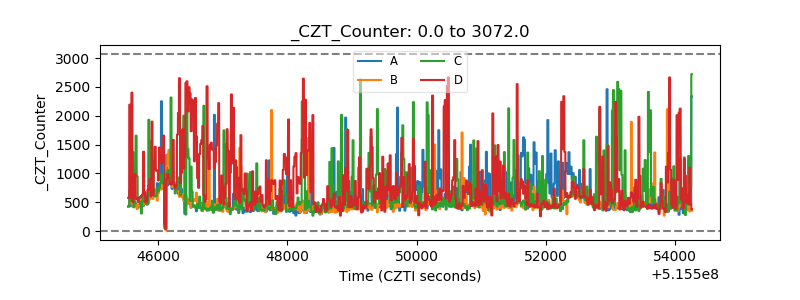 |
| +2.5 Volts monitor |  |
| +5 Volts monitor |  |
| _ROLL_ROT | 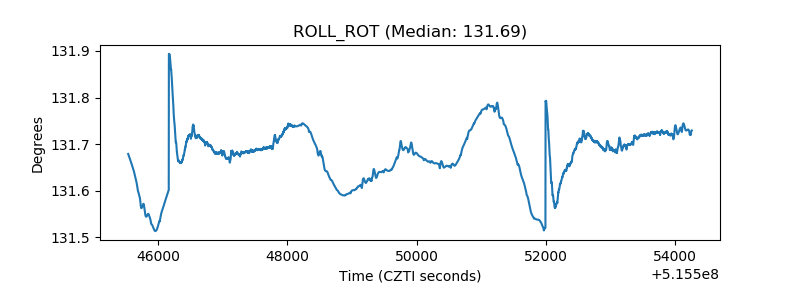 |
| _Roll_DEC | 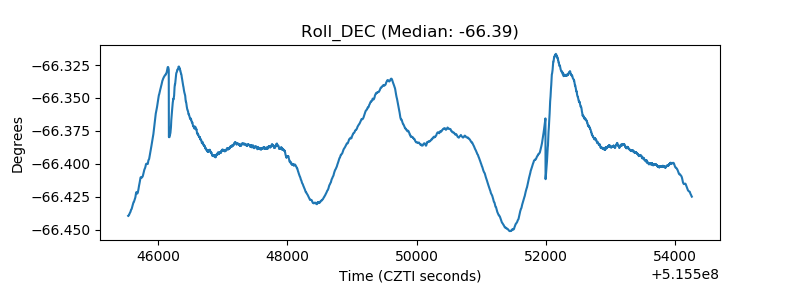 |
| _Roll_RA | 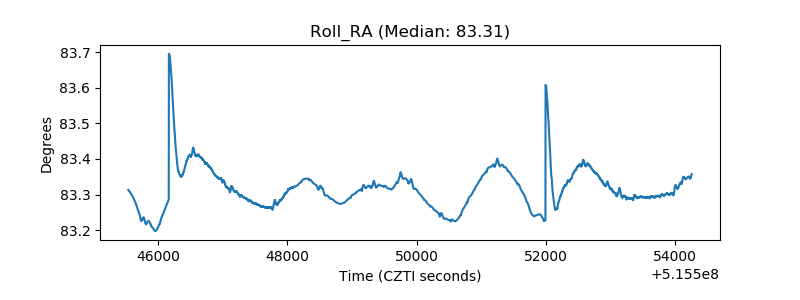 |
| Veto Counter | 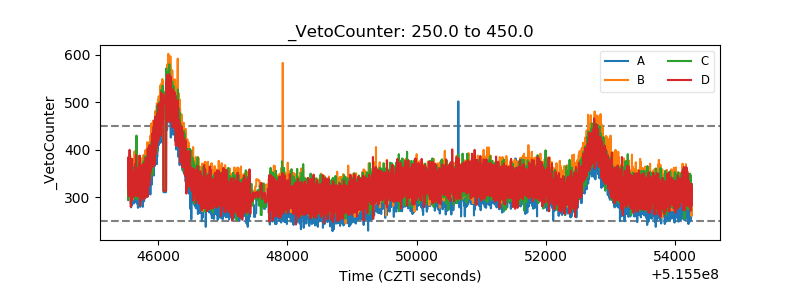 |