| Param | Original file | Final file |
|---|---|---|
| Filename | modeM0/AS1A14_102T01_9000006572_57341cztM0_level2.fits | modeM0/AS1A14_102T01_9000006572_57341cztM0_level2_quad_clean.evt |
| Size (bytes) | 545,356,800 | 111,052,800 |
| Size | 520.1 MB | 105.9 MB |
| Events in quadrant A | 3,787,232 | 733,318 |
| Events in quadrant B | 3,650,891 | 791,120 |
| Events in quadrant C | 5,511,275 | 671,839 |
| Events in quadrant D | 6,631,485 | 622,827 |
| Mode M0 | |||
|---|---|---|---|
| Quadrant | BADHDUFLAG | Total packets | Discarded packets |
| A | 0 | 17095 | 0 |
| B | 0 | 16667 | 0 |
| C | 0 | 21895 | 0 |
| D | 0 | 25179 | 0 |
| Mode SS | |||
|---|---|---|---|
| Quadrant | BADHDUFLAG | Total packets | Discarded packets |
| A | 0 | 156 | 0 |
| B | 0 | 156 | 0 |
| C | 0 | 156 | 0 |
| D | 0 | 156 | 0 |
| Quadrant | Total seconds | Saturated seconds | Saturation percentage |
|---|---|---|---|
| A | 7812 | 53 | 0.678443% |
| B | 7812 | 89 | 1.139273% |
| C | 7813 | 366 | 4.684500% |
| D | 7813 | 532 | 6.809164% |
Noise dominated data is calculated using 1-second bins in cleaned event files. If a bin has >2000 counts, and if more than 50% of those come from <1% of pixels, then it is considered to be noise-dominated and hence unusable.
| Quadrant | # 1 sec bins | Bins with >0 counts | Bins with >2000 counts | High rate bins dominated by noise | Noise dominated (total time) | Noise dominated (detector-on time) | Marked lightcurve |
|---|---|---|---|---|---|---|---|
| A | 7812 | 7812 | 39 | 39 | 0.50% | 0.50% | 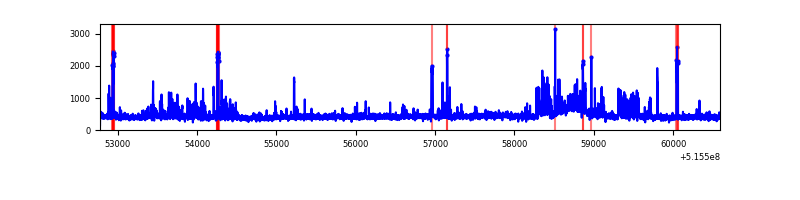 |
| B | 7812 | 7812 | 32 | 32 | 0.41% | 0.41% | 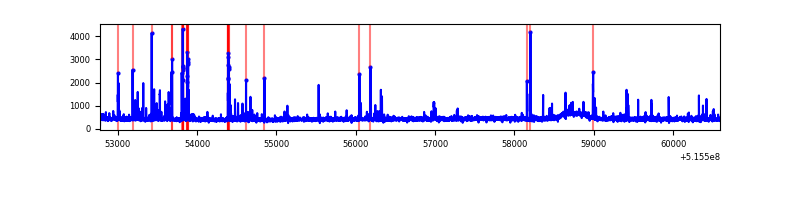 |
| C | 7813 | 7813 | 268 | 268 | 3.43% | 3.43% | 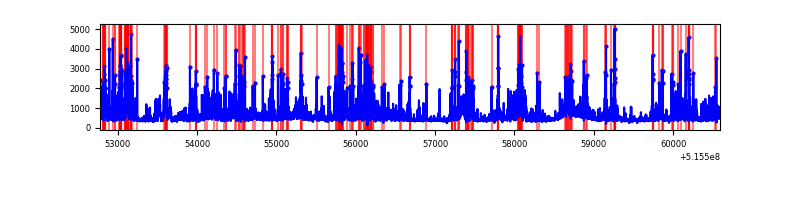 |
| D | 7813 | 7813 | 493 | 493 | 6.31% | 6.31% | 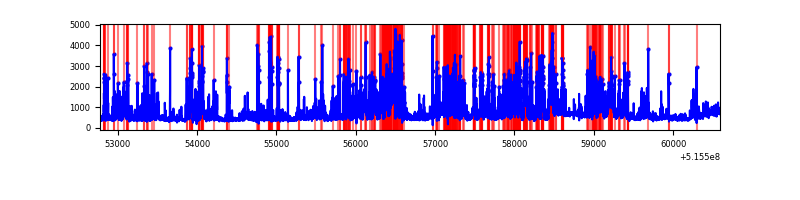 |
Top three noisy pixels from each quadrant. If the there are fewer than three noisy pixels in the level2.evt file, extra rows are filled as -1
| Pixel properties | Quadrant properties | ||||||
|---|---|---|---|---|---|---|---|
| Quadrant | DetID | PixID | Counts | Sigma | Mean | Median | Sigma |
| A | 0 | 12 | 517255 | 2501.95 | 834 | 812 | 206.4 |
| A | 13 | 248 | 16453 | 75.77 | 834 | 812 | 206.4 |
| A | 4 | 3 | 16354 | 75.29 | 834 | 812 | 206.4 |
| B | 4 | 171 | 91437 | 515.6 | 829 | 796 | 175.8 |
| B | 0 | 213 | 61029 | 342.62 | 829 | 796 | 175.8 |
| B | 7 | 252 | 43737 | 244.26 | 829 | 796 | 175.8 |
| C | 15 | 224 | 2067965 | 9555.92 | 798 | 791 | 216.3 |
| C | 14 | 254 | 118994 | 546.42 | 798 | 791 | 216.3 |
| C | 12 | 252 | 87602 | 401.3 | 798 | 791 | 216.3 |
| D | 3 | 224 | 1588704 | 7238.32 | 784 | 748 | 219.4 |
| D | 2 | 249 | 601591 | 2738.8 | 784 | 748 | 219.4 |
| D | 8 | 240 | 535209 | 2436.21 | 784 | 748 | 219.4 |
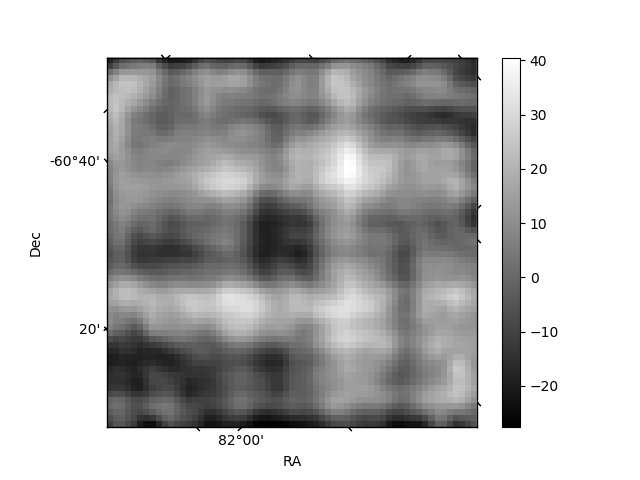
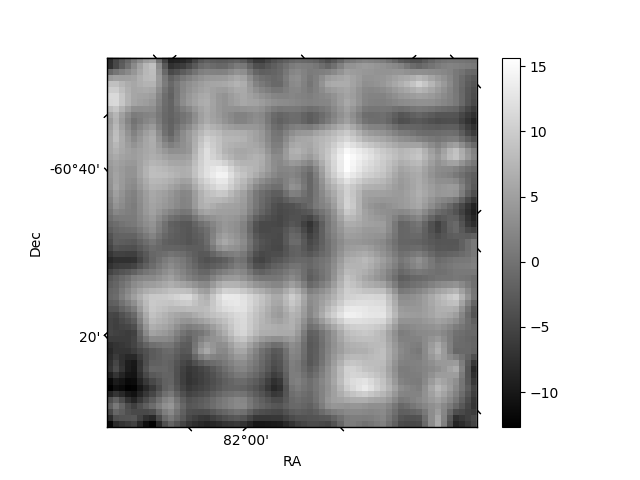
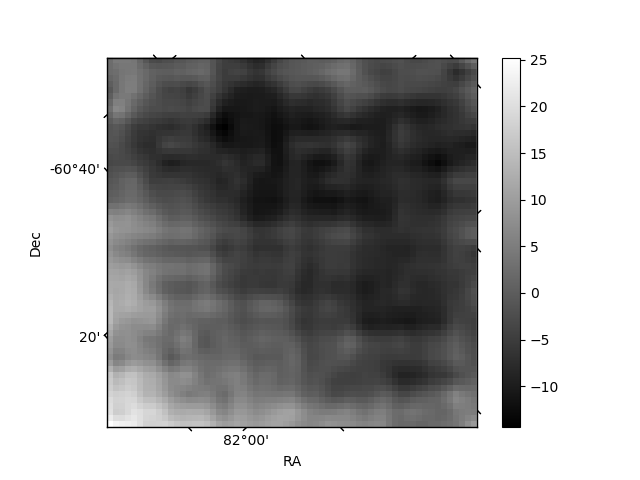
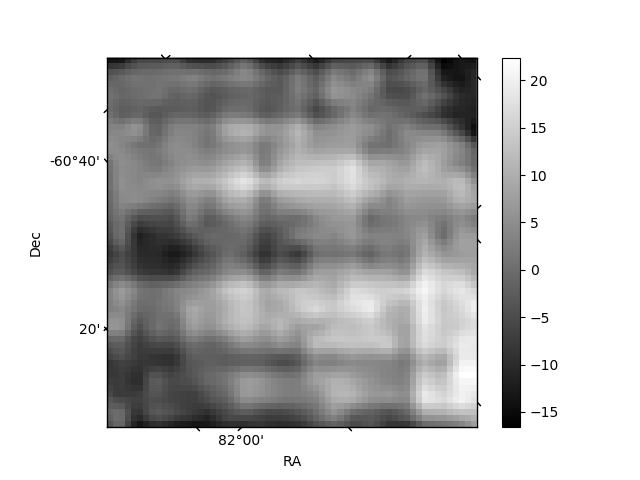
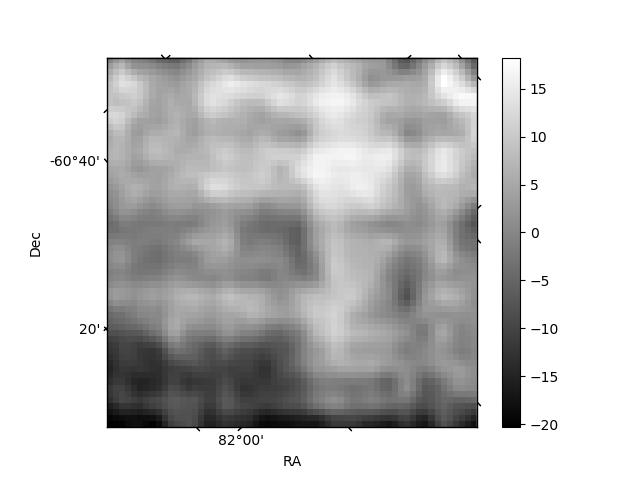
Histogram calculated using DETX and DETY for each event in the final _common_clean file
| Quadrant A | 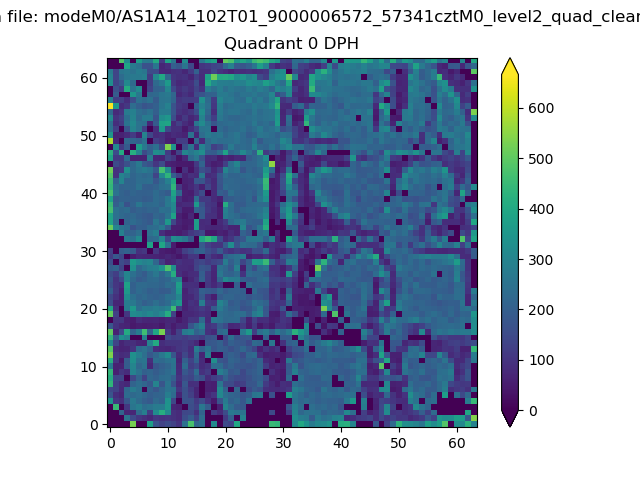 |
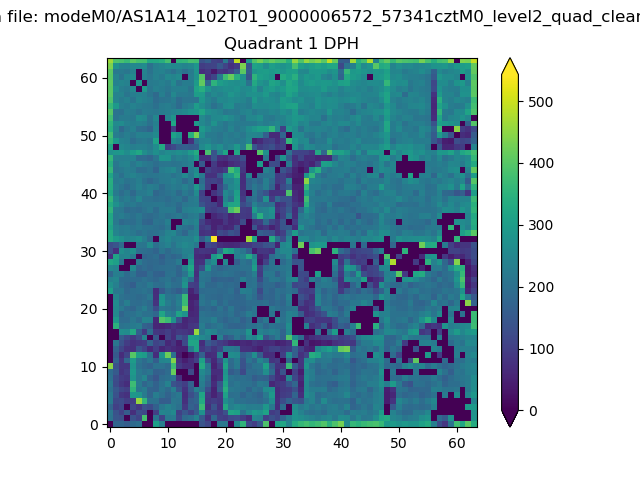 |
Quadrant B |
|---|---|---|---|
| Quadrant D | 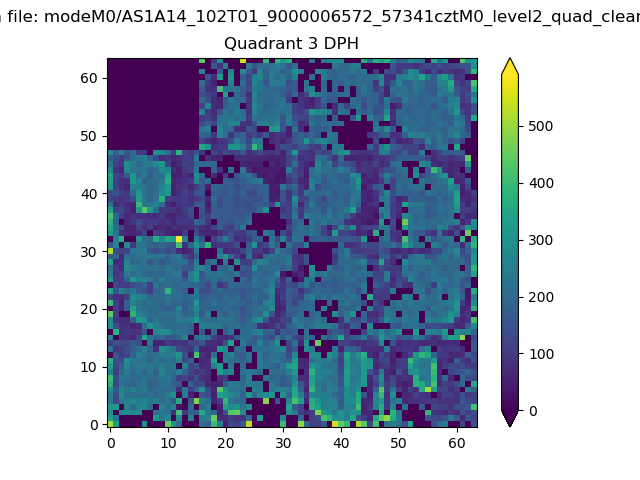 |
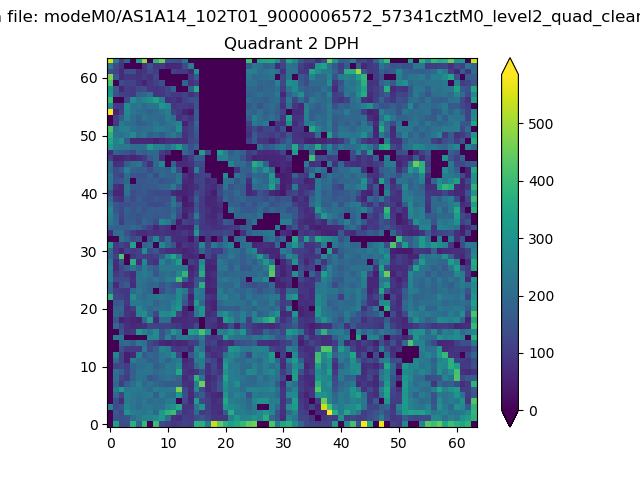 |
Quadrant C |
| Plot type | Count rate plots | Images |
|---|---|---|
| Comparison with Poisson distribution Blue bars denote a histogram of data divided into 1 sec bins. Red curve is a Poisson curve with rate = median count rate of data. |
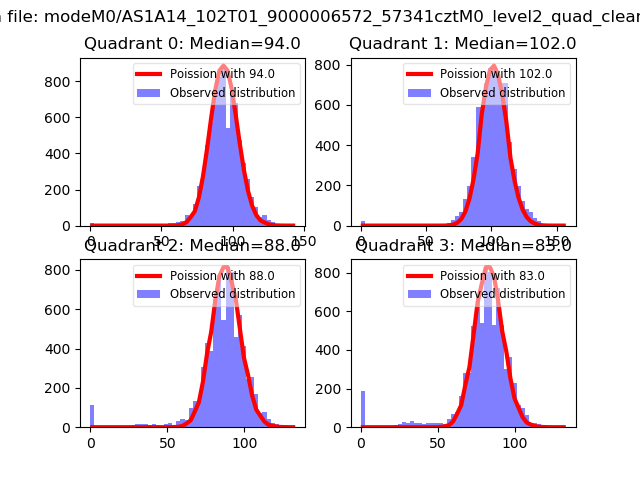 |
 |
| Quadrant-wise count rates Data is divided into 100 sec bins |
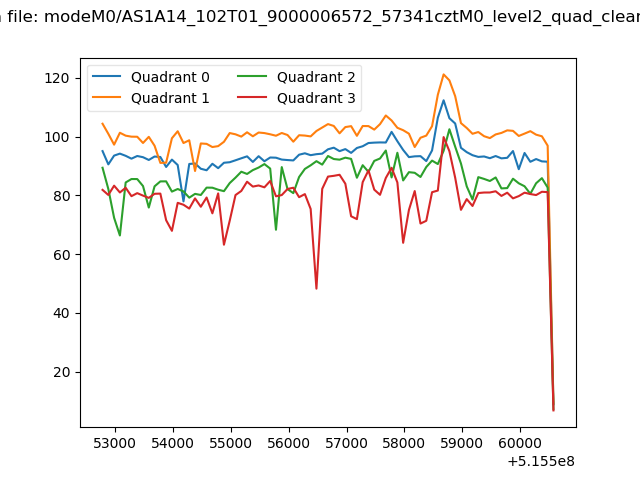 |
|
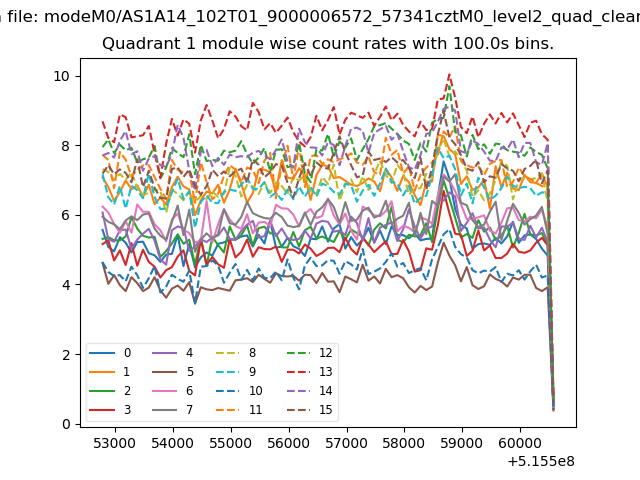
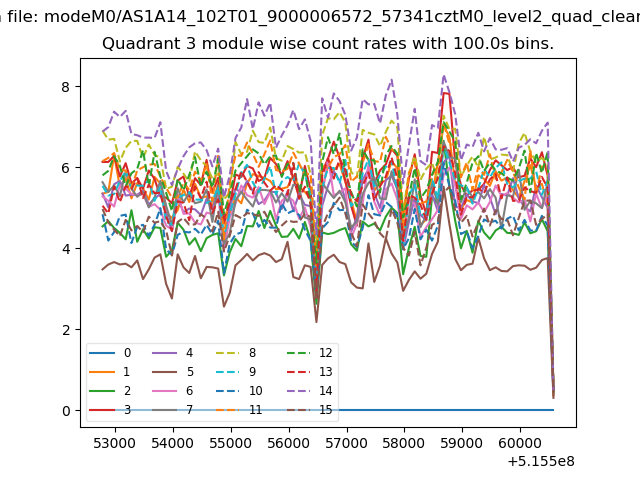
| Module-wise count rates for Quadrant A Data is divided into 100 sec bins |
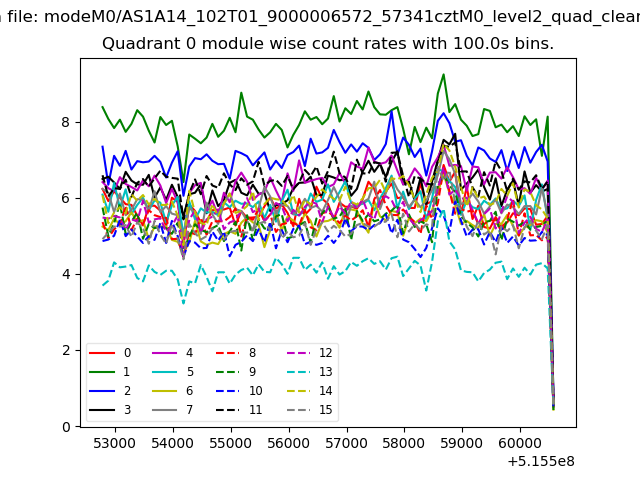 |
 |
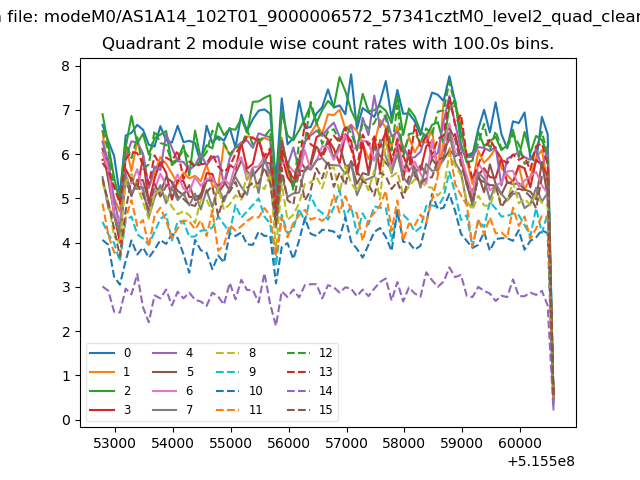
| Module-wise count rates for Quadrant B Data is divided into 100 sec bins |
 |
 |
| Module-wise count rates for Quadrant C Data is divided into 100 sec bins |
 |
 |
| Module-wise count rates for Quadrant D Data is divided into 100 sec bins |
 |
 |
| Parameter | Plot |
|---|---|
| CZT HV Monitor | 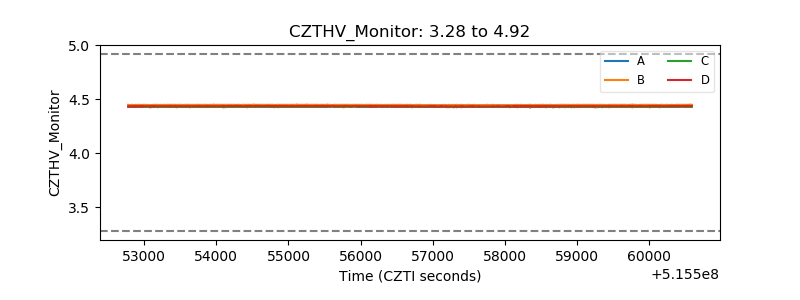 |
| D_VDD | 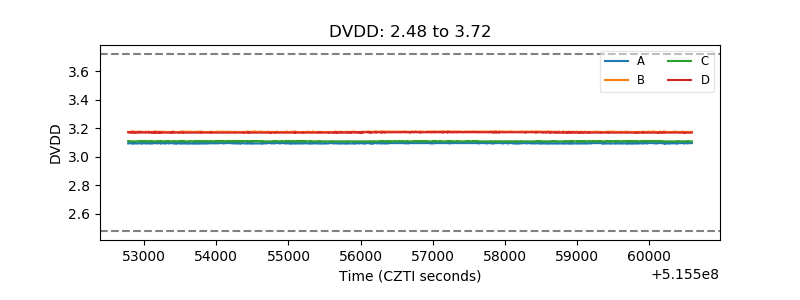 |
| Temperature 1 | 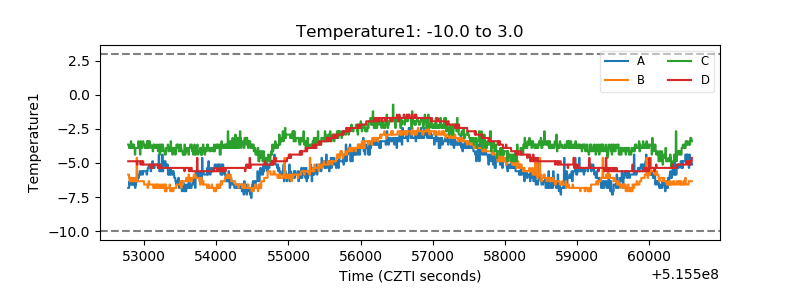 |
| Veto HV Monitor | 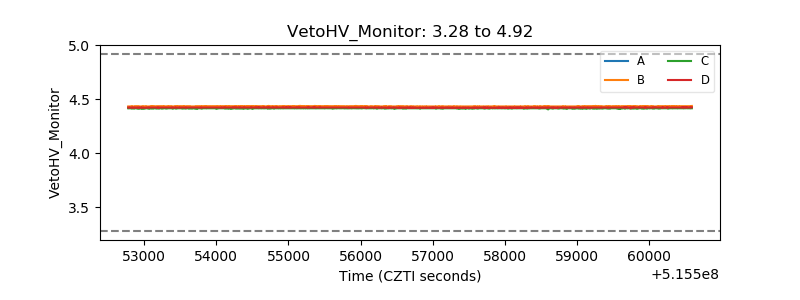 |
| Veto LLD | 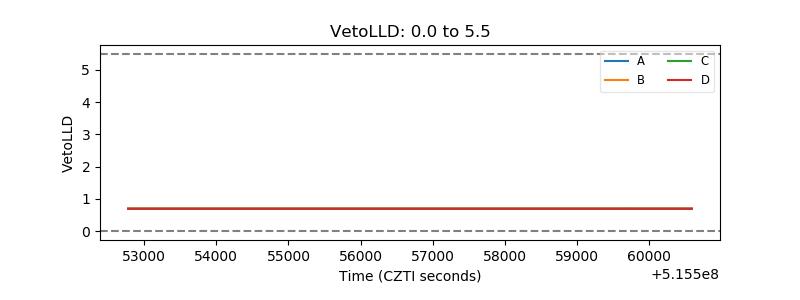 |
| Alpha Counter | 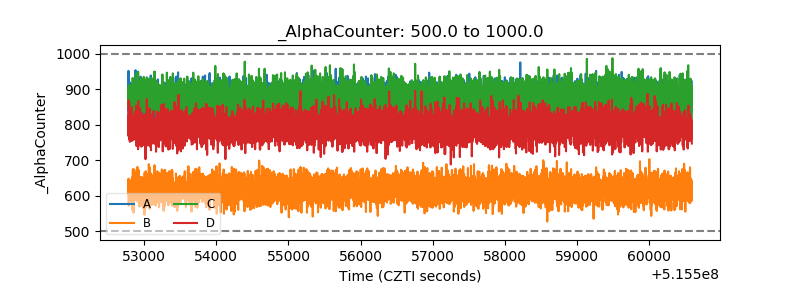 |
| _CPM_Rate | 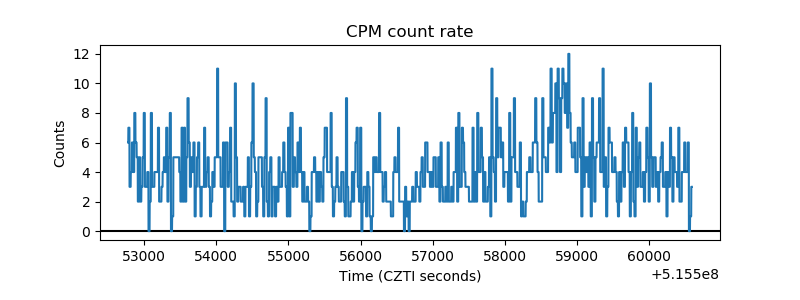 |
| CZT Counter | 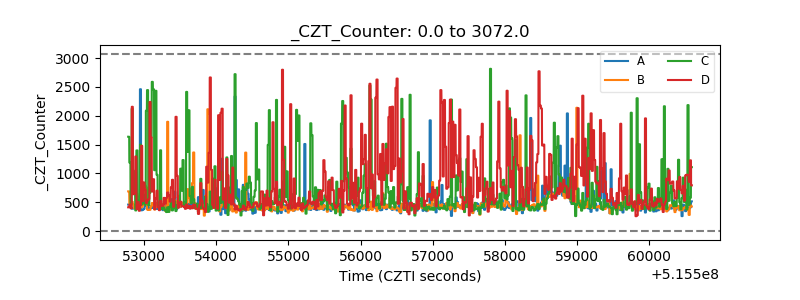 |
| +2.5 Volts monitor |  |
| +5 Volts monitor |  |
| _ROLL_ROT | 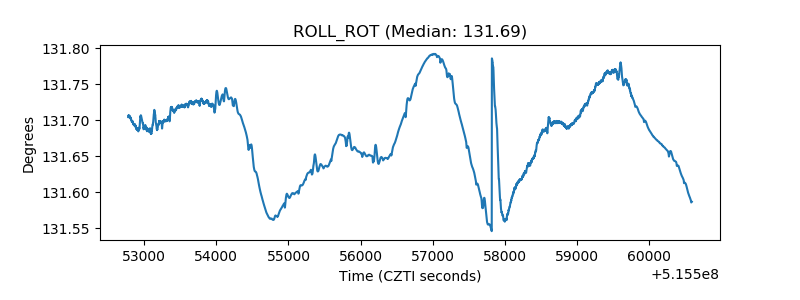 |
| _Roll_DEC | 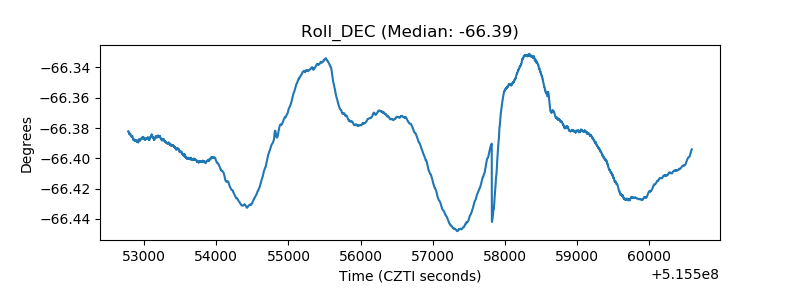 |
| _Roll_RA | 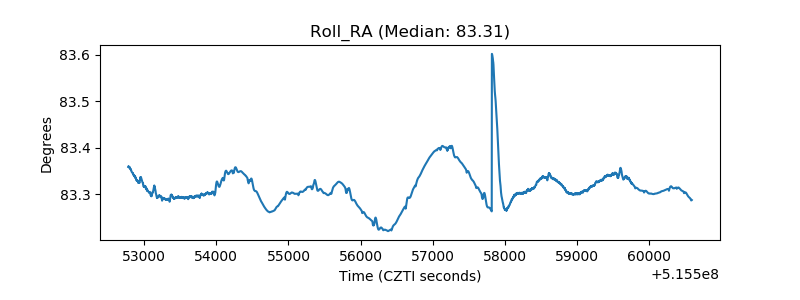 |
| Veto Counter | 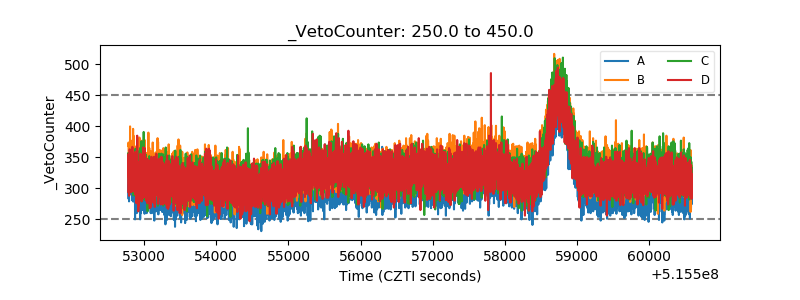 |