| Param | Original file | Final file |
|---|---|---|
| Filename | modeM0/AS1A14_102T01_9000006572_57344cztM0_level2.fits | modeM0/AS1A14_102T01_9000006572_57344cztM0_level2_quad_clean.evt |
| Size (bytes) | 1,369,546,560 | 271,696,320 |
| Size | 1.3 GB | 259.1 MB |
| Events in quadrant A | 9,542,264 | 1,804,180 |
| Events in quadrant B | 9,554,159 | 1,931,010 |
| Events in quadrant C | 13,381,813 | 1,633,581 |
| Events in quadrant D | 16,701,221 | 1,506,591 |
| Mode M0 | |||
|---|---|---|---|
| Quadrant | BADHDUFLAG | Total packets | Discarded packets |
| A | 0 | 42665 | 3 |
| B | 0 | 42607 | 3 |
| C | 0 | 53875 | 3 |
| D | 0 | 63146 | 3 |
| Mode M9 | |||
|---|---|---|---|
| Quadrant | BADHDUFLAG | Total packets | Discarded packets |
| A | 0 | 11 | 0 |
| B | 0 | 11 | 0 |
| C | 0 | 11 | 0 |
| D | 0 | 11 | 0 |
| Mode SS | |||
|---|---|---|---|
| Quadrant | BADHDUFLAG | Total packets | Discarded packets |
| A | 0 | 398 | 0 |
| B | 0 | 398 | 0 |
| C | 0 | 398 | 0 |
| D | 0 | 398 | 0 |
| Quadrant | Total seconds | Saturated seconds | Saturation percentage |
|---|---|---|---|
| A | 19594 | 463 | 2.362968% |
| B | 19594 | 612 | 3.123405% |
| C | 19595 | 1348 | 6.879306% |
| D | 19595 | 2070 | 10.563919% |
Noise dominated data is calculated using 1-second bins in cleaned event files. If a bin has >2000 counts, and if more than 50% of those come from <1% of pixels, then it is considered to be noise-dominated and hence unusable.
| Quadrant | # 1 sec bins | Bins with >0 counts | Bins with >2000 counts | High rate bins dominated by noise | Noise dominated (total time) | Noise dominated (detector-on time) | Marked lightcurve |
|---|---|---|---|---|---|---|---|
| A | 20774 | 19597 | 72 | 72 | 0.35% | 0.37% | 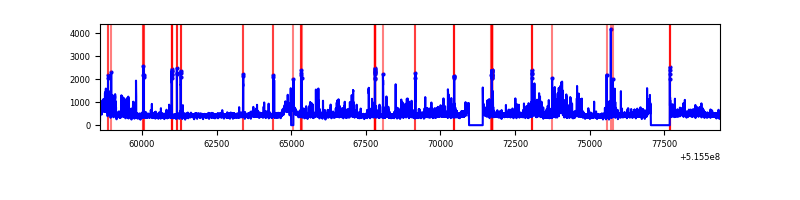 |
| B | 20774 | 19597 | 87 | 87 | 0.42% | 0.44% | 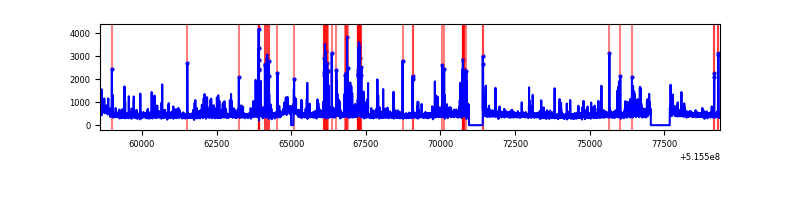 |
| C | 20775 | 19598 | 771 | 771 | 3.71% | 3.93% | 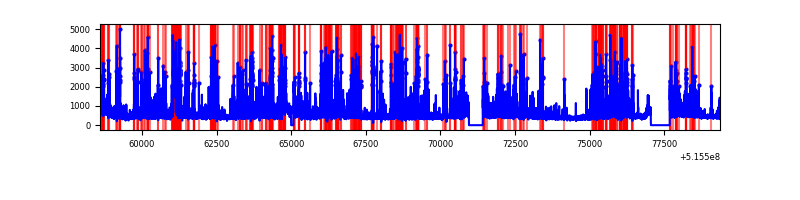 |
| D | 20775 | 19597 | 1380 | 1380 | 6.64% | 7.04% | 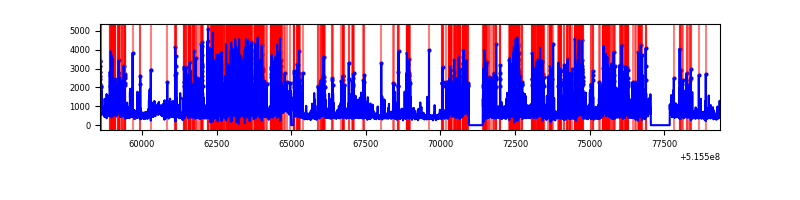 |
Top three noisy pixels from each quadrant. If the there are fewer than three noisy pixels in the level2.evt file, extra rows are filled as -1
| Pixel properties | Quadrant properties | ||||||
|---|---|---|---|---|---|---|---|
| Quadrant | DetID | PixID | Counts | Sigma | Mean | Median | Sigma |
| A | 0 | 12 | 1094269 | 2069.26 | 2146 | 2082 | 527.8 |
| A | 6 | 162 | 40932 | 73.6 | 2146 | 2082 | 527.8 |
| A | 4 | 3 | 29694 | 52.31 | 2146 | 2082 | 527.8 |
| B | 10 | 246 | 278190 | 611.62 | 2114 | 2025 | 451.5 |
| B | 0 | 213 | 228066 | 500.61 | 2114 | 2025 | 451.5 |
| B | 7 | 252 | 131590 | 286.95 | 2114 | 2025 | 451.5 |
| C | 15 | 224 | 3147580 | 5744.61 | 2043 | 2027 | 547.6 |
| C | 14 | 254 | 1379986 | 2516.52 | 2043 | 2027 | 547.6 |
| C | 12 | 250 | 353004 | 640.98 | 2043 | 2027 | 547.6 |
| D | 2 | 249 | 3910686 | 6995.59 | 2011 | 1925 | 558.7 |
| D | 3 | 224 | 2466265 | 4410.48 | 2011 | 1925 | 558.7 |
| D | 8 | 240 | 458212 | 816.63 | 2011 | 1925 | 558.7 |
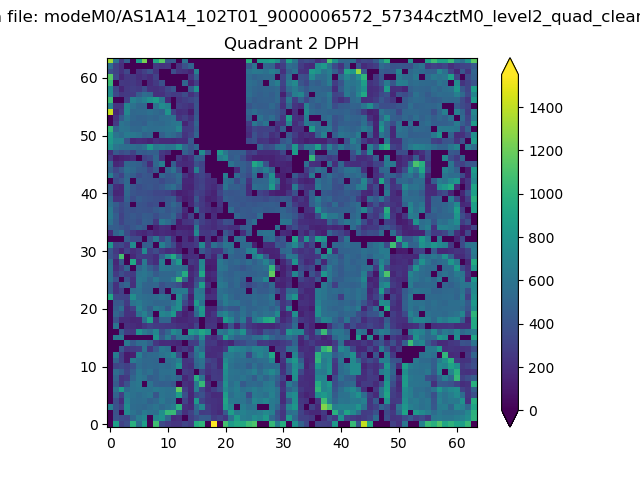
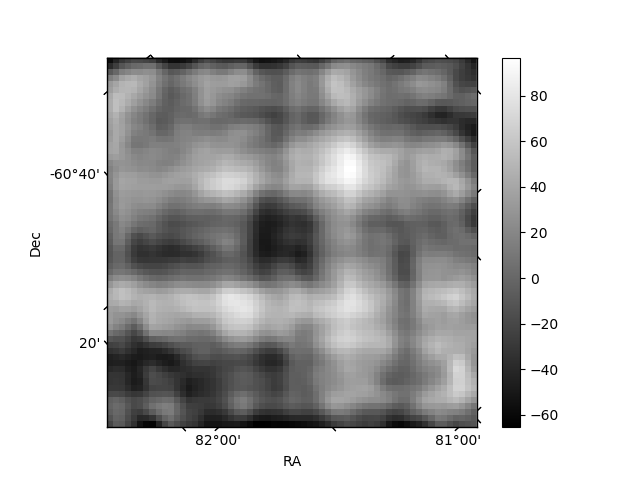
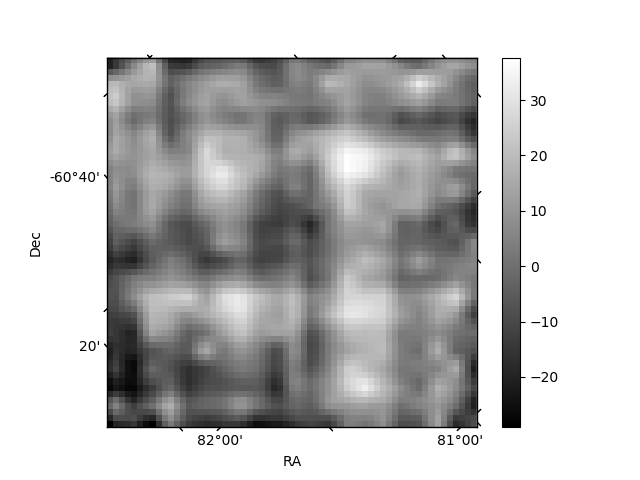
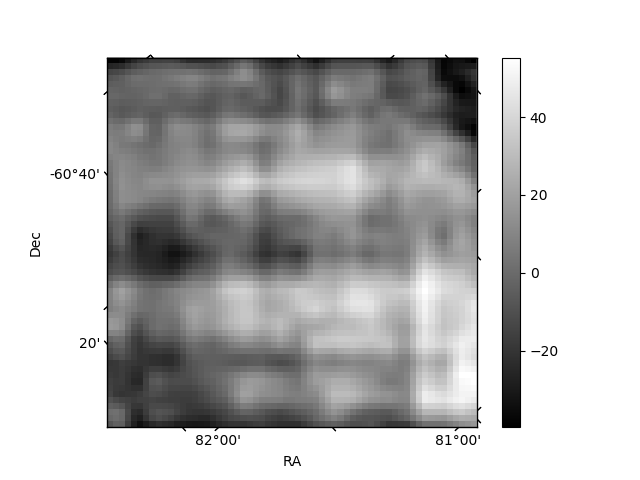
Histogram calculated using DETX and DETY for each event in the final _common_clean file
| Quadrant A | 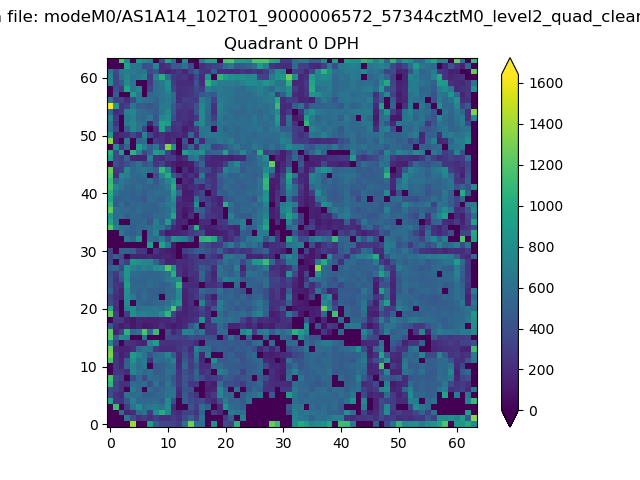 |
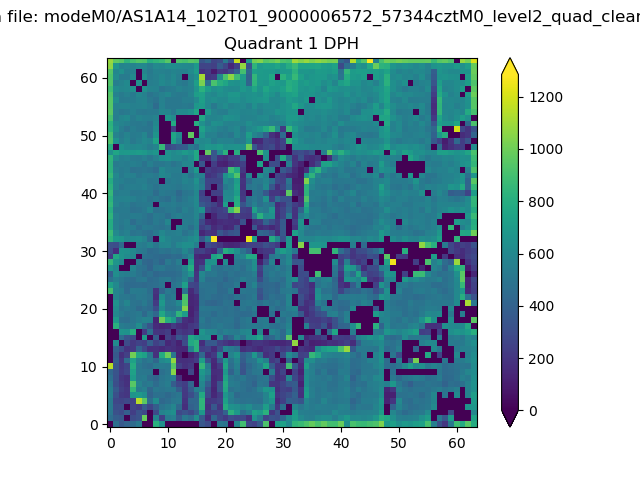 |
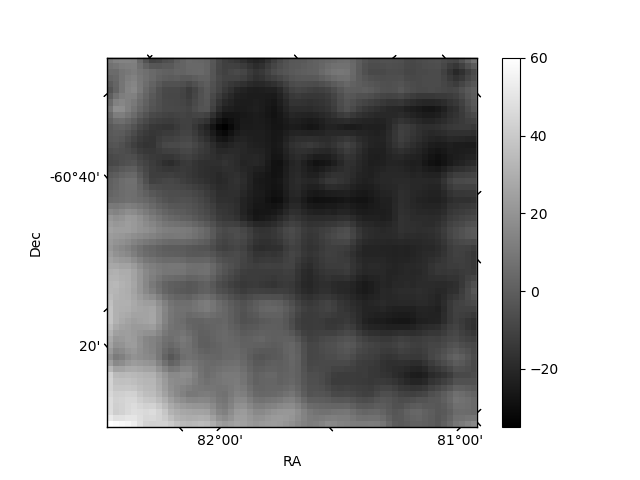
Quadrant B |
|---|---|---|---|
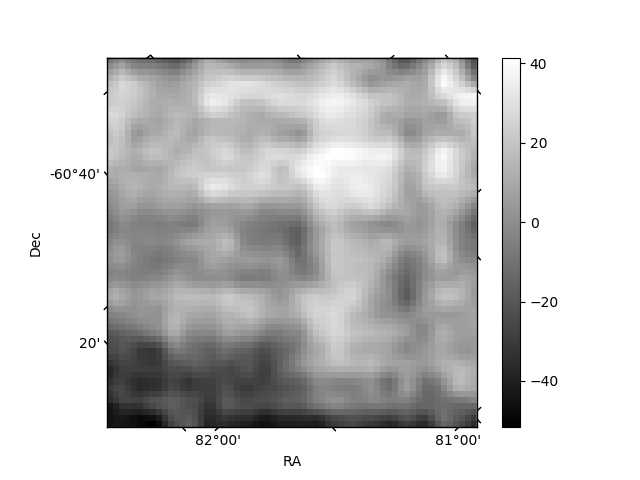
| Quadrant D | 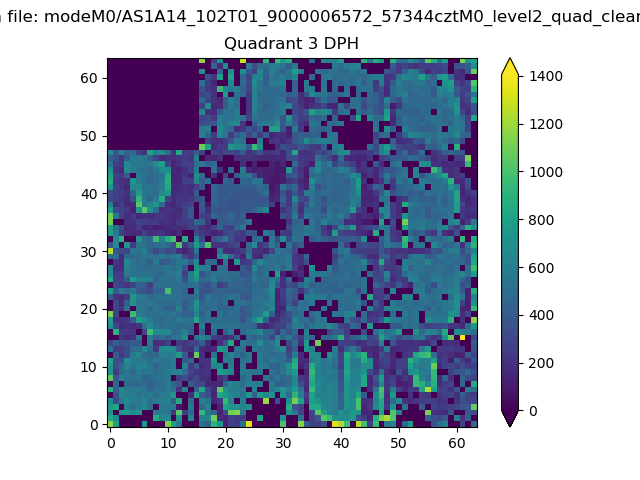 |
 |
Quadrant C |
| Plot type | Count rate plots | Images |
|---|---|---|
| Comparison with Poisson distribution Blue bars denote a histogram of data divided into 1 sec bins. Red curve is a Poisson curve with rate = median count rate of data. |
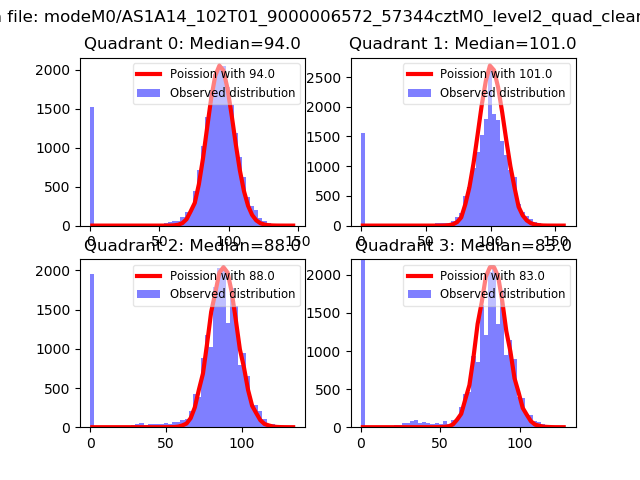 |
 |
| Quadrant-wise count rates Data is divided into 100 sec bins |
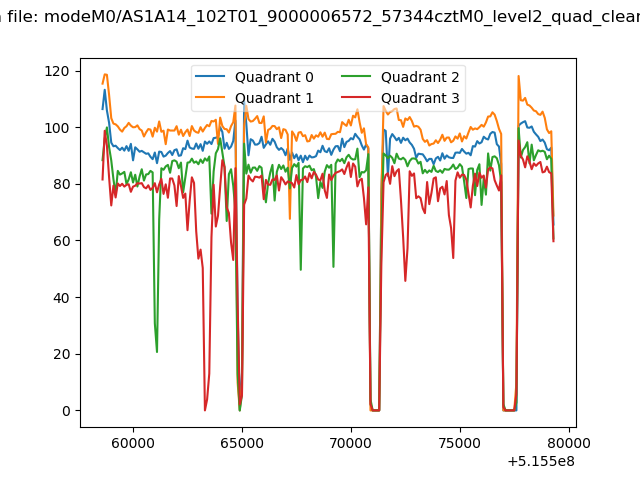 |
|
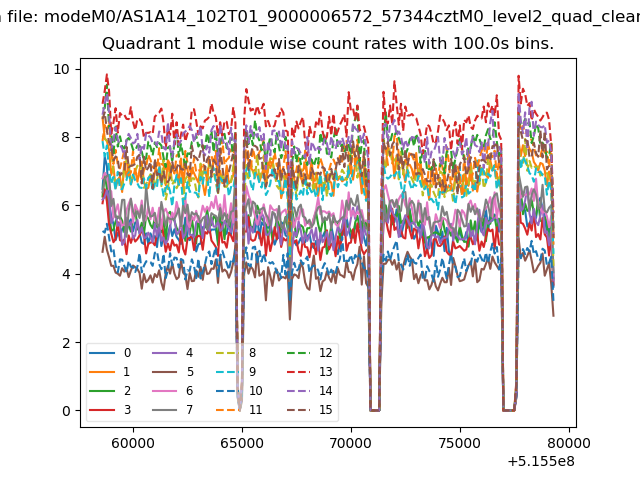
| Module-wise count rates for Quadrant A Data is divided into 100 sec bins |
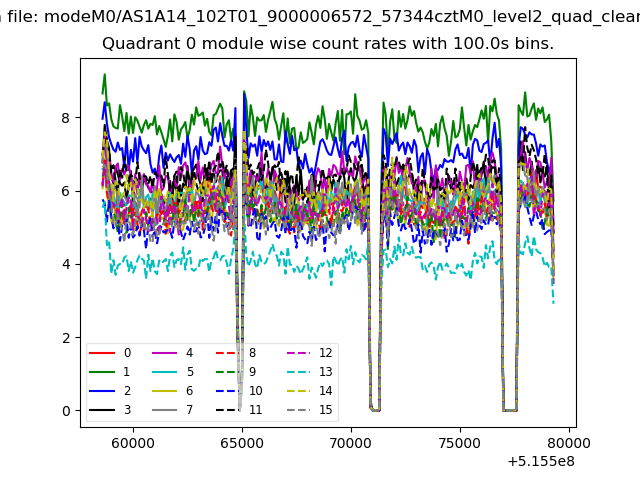 |
 |
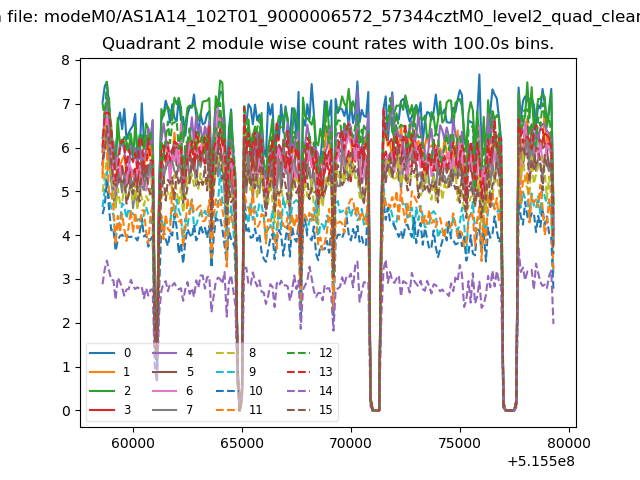
| Module-wise count rates for Quadrant B Data is divided into 100 sec bins |
 |
 |
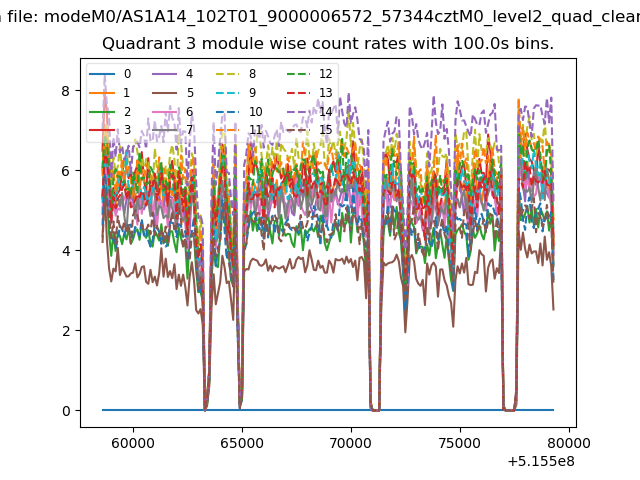
| Module-wise count rates for Quadrant C Data is divided into 100 sec bins |
 |
 |
| Module-wise count rates for Quadrant D Data is divided into 100 sec bins |
 |
 |
| Parameter | Plot |
|---|---|
| CZT HV Monitor | 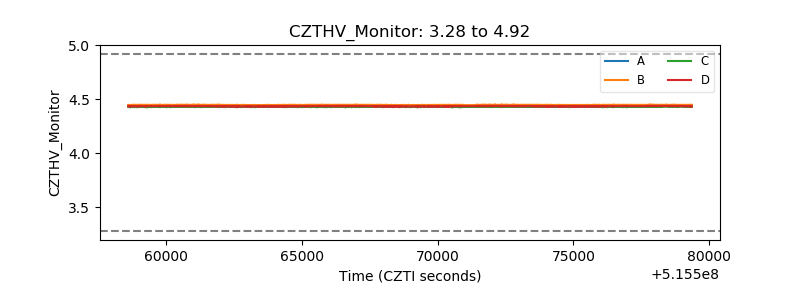 |
| D_VDD | 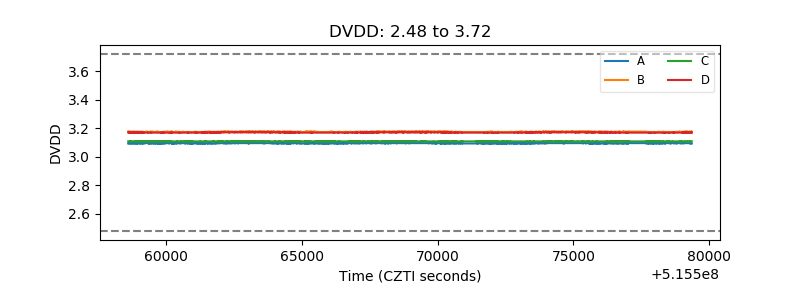 |
| Temperature 1 | 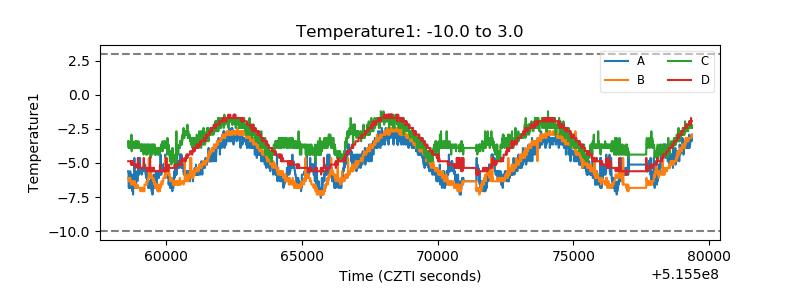 |
| Veto HV Monitor | 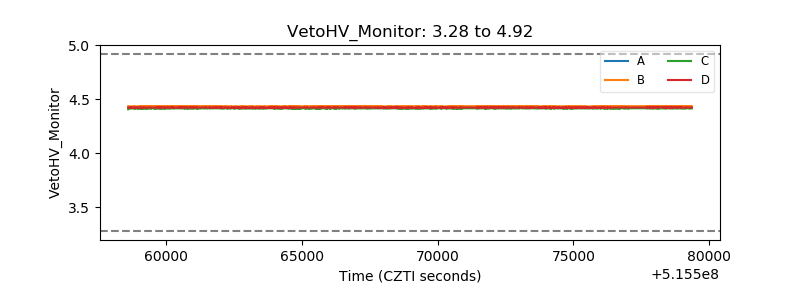 |
| Veto LLD | 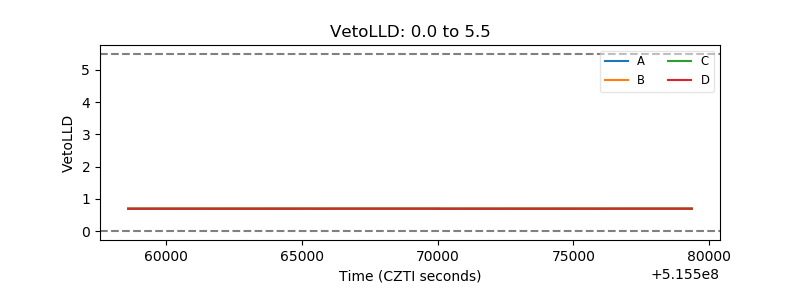 |
| Alpha Counter | 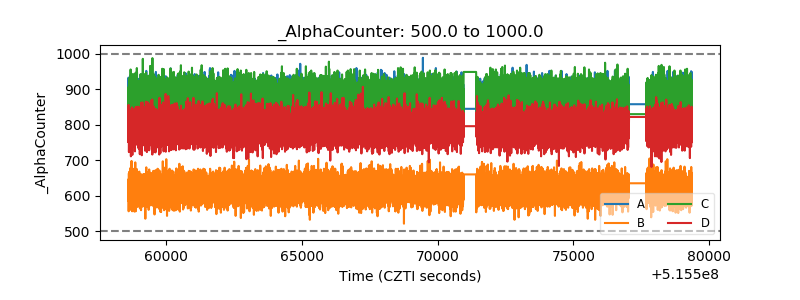 |
| _CPM_Rate | 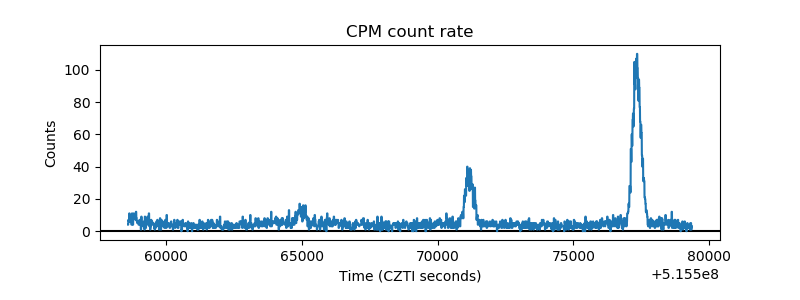 |
| CZT Counter | 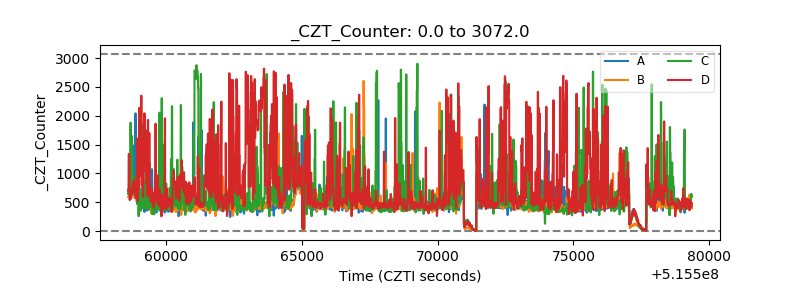 |
| +2.5 Volts monitor | 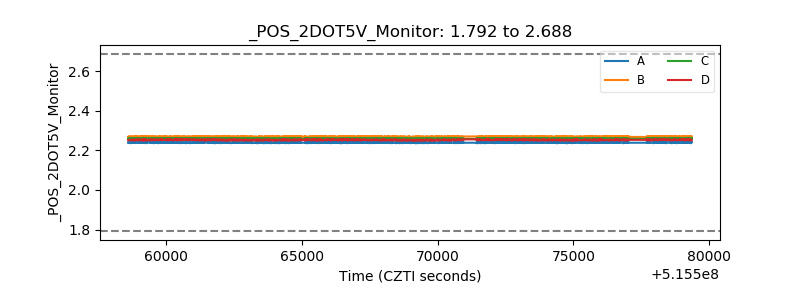 |
| +5 Volts monitor | 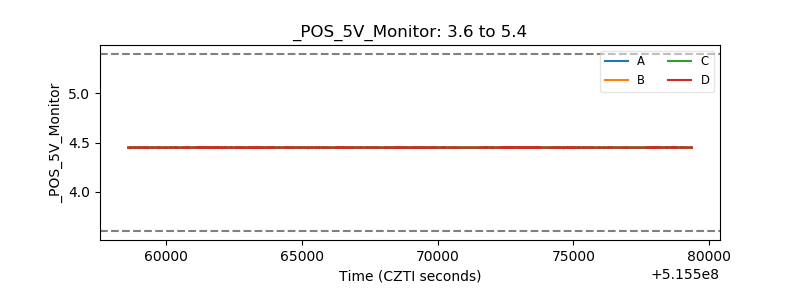 |
| _ROLL_ROT | 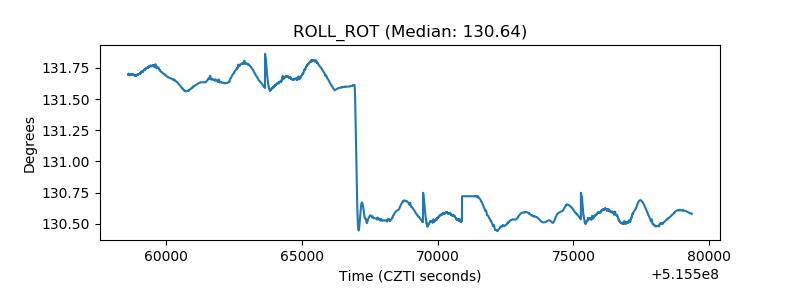 |
| _Roll_DEC | 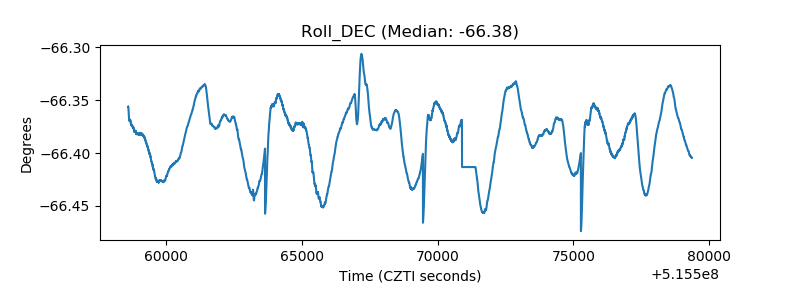 |
| _Roll_RA | 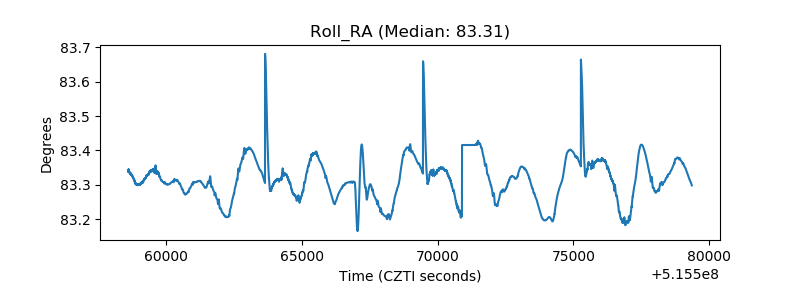 |
| Veto Counter | 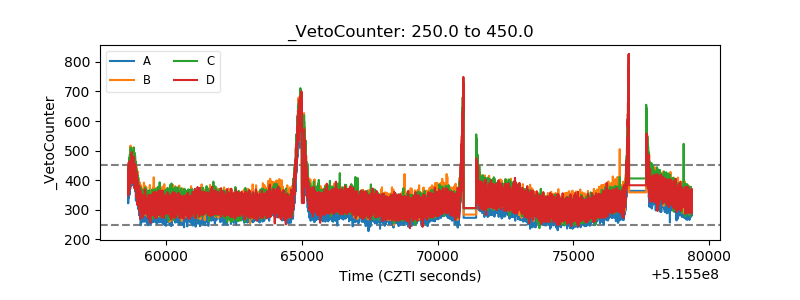 |