| Param | Original file | Final file |
|---|---|---|
| Filename | modeM0/AS1A14_102T01_9000006572_57347cztM0_level2.fits | modeM0/AS1A14_102T01_9000006572_57347cztM0_level2_quad_clean.evt |
| Size (bytes) | 428,322,240 | 92,649,600 |
| Size | 408.5 MB | 88.4 MB |
| Events in quadrant A | 2,849,718 | 613,668 |
| Events in quadrant B | 3,329,322 | 653,129 |
| Events in quadrant C | 4,975,309 | 554,862 |
| Events in quadrant D | 4,206,988 | 540,393 |
| Mode M0 | |||
|---|---|---|---|
| Quadrant | BADHDUFLAG | Total packets | Discarded packets |
| A | 0 | 13124 | 1 |
| B | 0 | 14270 | 1 |
| C | 0 | 19215 | 1 |
| D | 0 | 16896 | 1 |
| Mode M9 | |||
|---|---|---|---|
| Quadrant | BADHDUFLAG | Total packets | Discarded packets |
| A | 0 | 10 | 0 |
| B | 0 | 10 | 0 |
| C | 0 | 10 | 0 |
| D | 0 | 10 | 0 |
| Mode SS | |||
|---|---|---|---|
| Quadrant | BADHDUFLAG | Total packets | Discarded packets |
| A | 0 | 130 | 0 |
| B | 0 | 130 | 0 |
| C | 0 | 130 | 0 |
| D | 0 | 130 | 0 |
| Quadrant | Total seconds | Saturated seconds | Saturation percentage |
|---|---|---|---|
| A | 6349 | 76 | 1.197039% |
| B | 6350 | 116 | 1.826772% |
| C | 6350 | 474 | 7.464567% |
| D | 6350 | 297 | 4.677165% |
Noise dominated data is calculated using 1-second bins in cleaned event files. If a bin has >2000 counts, and if more than 50% of those come from <1% of pixels, then it is considered to be noise-dominated and hence unusable.
| Quadrant | # 1 sec bins | Bins with >0 counts | Bins with >2000 counts | High rate bins dominated by noise | Noise dominated (total time) | Noise dominated (detector-on time) | Marked lightcurve |
|---|---|---|---|---|---|---|---|
| A | 7314 | 6350 | 3 | 3 | 0.04% | 0.05% | 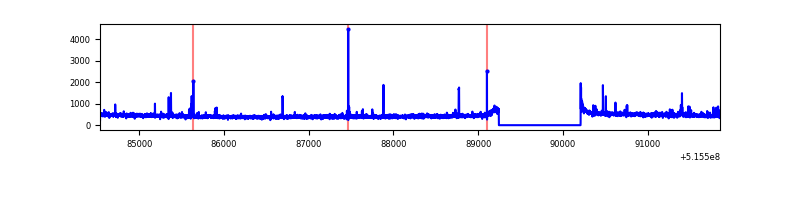 |
| B | 7315 | 6351 | 25 | 25 | 0.34% | 0.39% | 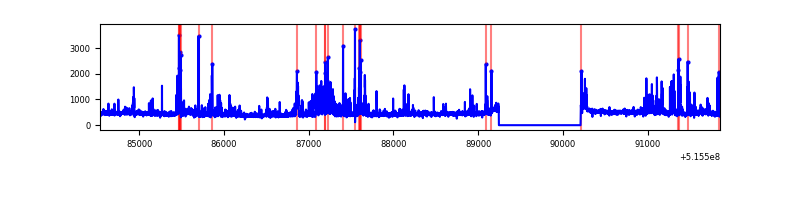 |
| C | 7315 | 6351 | 355 | 355 | 4.85% | 5.59% | 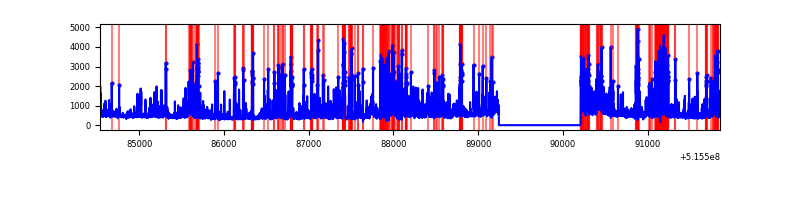 |
| D | 7315 | 6351 | 208 | 208 | 2.84% | 3.28% | 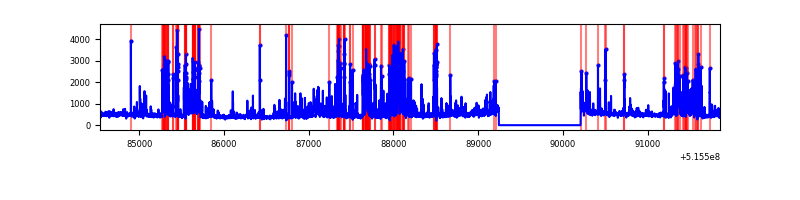 |
Top three noisy pixels from each quadrant. If the there are fewer than three noisy pixels in the level2.evt file, extra rows are filled as -1
| Pixel properties | Quadrant properties | ||||||
|---|---|---|---|---|---|---|---|
| Quadrant | DetID | PixID | Counts | Sigma | Mean | Median | Sigma |
| A | 0 | 12 | 54307 | 312.41 | 696 | 679 | 171.7 |
| A | 3 | 14 | 50344 | 289.33 | 696 | 679 | 171.7 |
| A | 10 | 251 | 12555 | 69.18 | 696 | 679 | 171.7 |
| B | 5 | 185 | 203834 | 1396.42 | 681 | 655 | 145.5 |
| B | 7 | 252 | 122547 | 837.75 | 681 | 655 | 145.5 |
| B | 4 | 171 | 83187 | 567.23 | 681 | 655 | 145.5 |
| C | 15 | 224 | 1662413 | 9346.86 | 647 | 640 | 177.8 |
| C | 13 | 3 | 362213 | 2033.72 | 647 | 640 | 177.8 |
| C | 14 | 254 | 170462 | 955.19 | 647 | 640 | 177.8 |
| D | 8 | 240 | 1126594 | 6040.82 | 664 | 633 | 186.4 |
| D | 2 | 249 | 192966 | 1031.87 | 664 | 633 | 186.4 |
| D | 3 | 224 | 75753 | 403.02 | 664 | 633 | 186.4 |
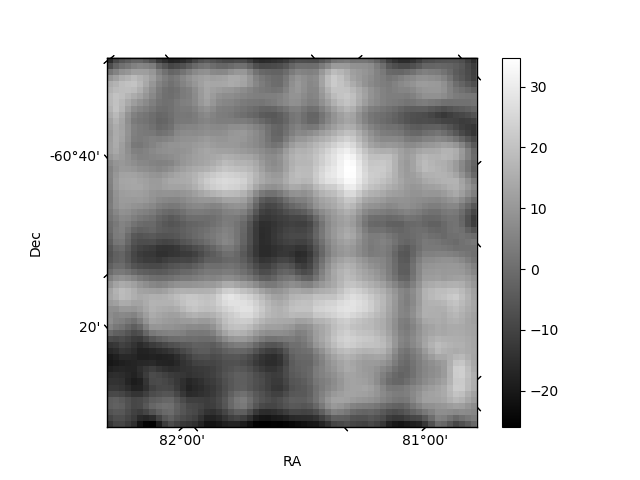
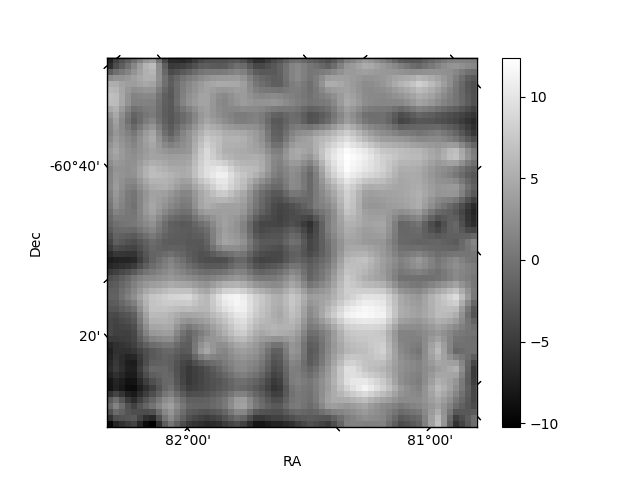
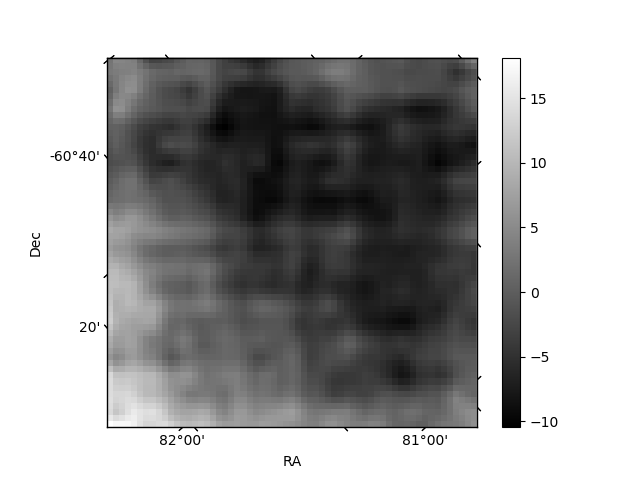
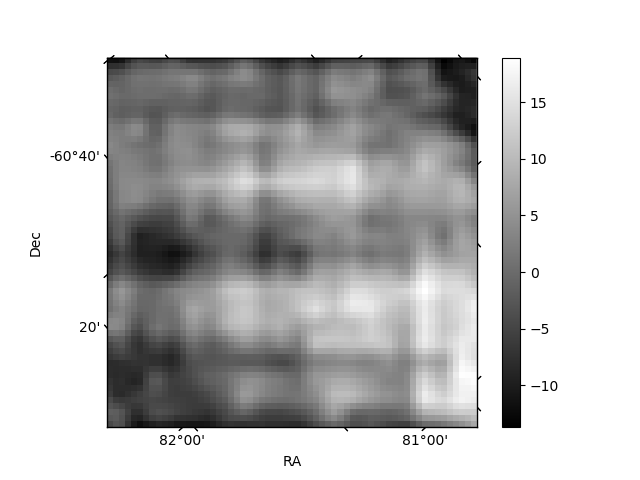
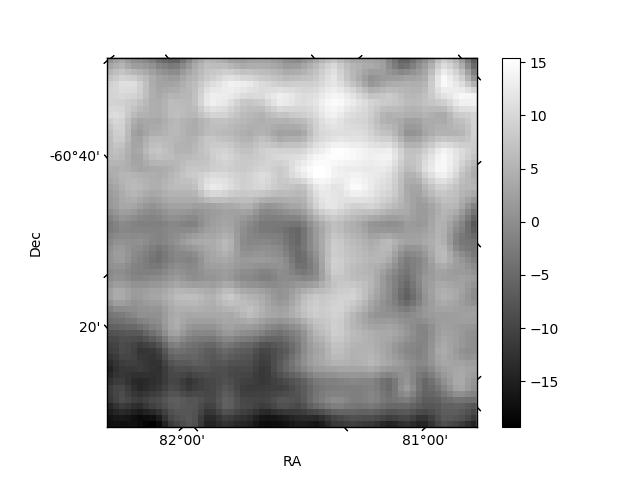
Histogram calculated using DETX and DETY for each event in the final _common_clean file
| Quadrant A | 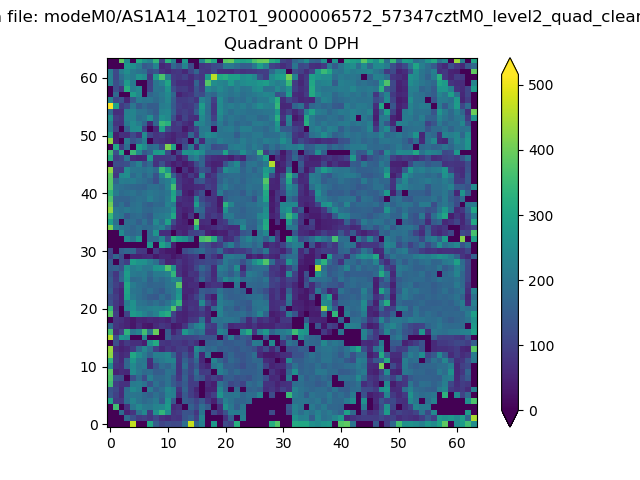 |
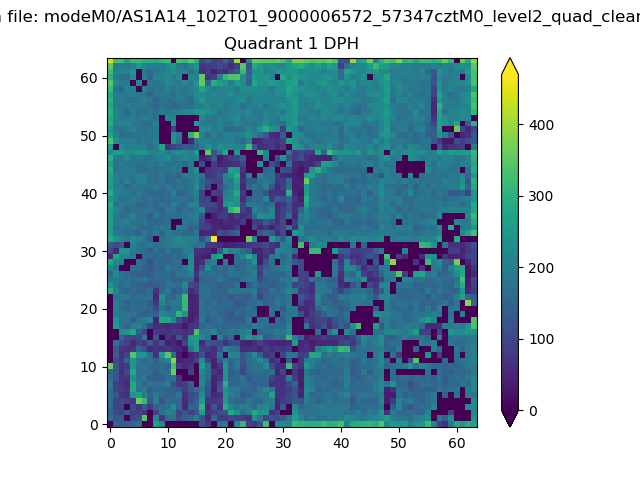 |
Quadrant B |
|---|---|---|---|
| Quadrant D | 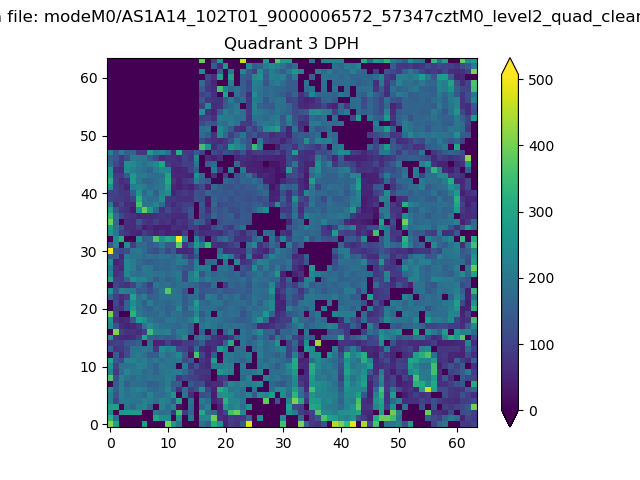 |
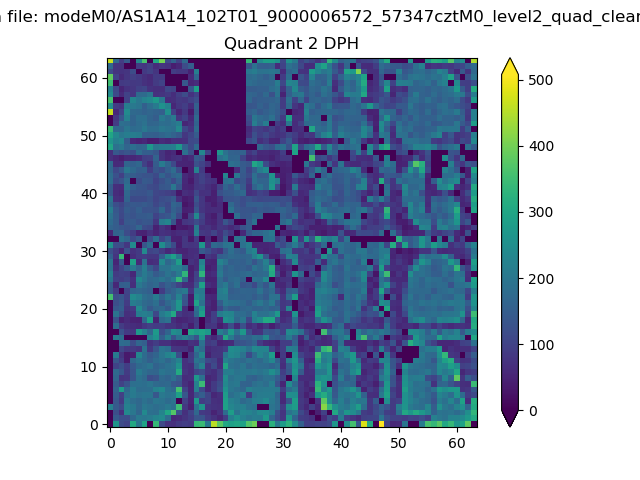 |
Quadrant C |
| Plot type | Count rate plots | Images |
|---|---|---|
| Comparison with Poisson distribution Blue bars denote a histogram of data divided into 1 sec bins. Red curve is a Poisson curve with rate = median count rate of data. |
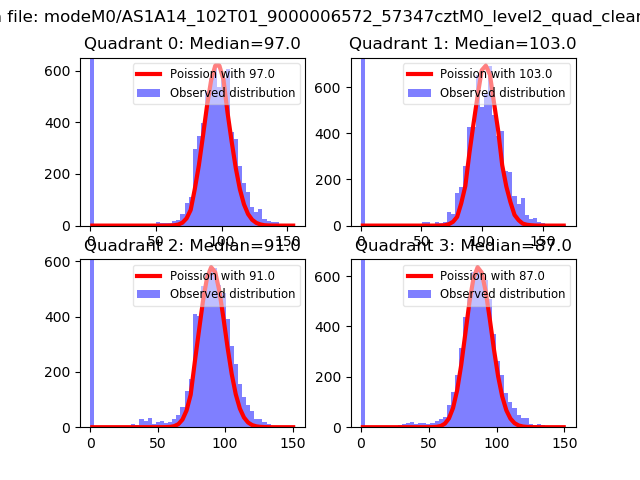 |
 |
| Quadrant-wise count rates Data is divided into 100 sec bins |
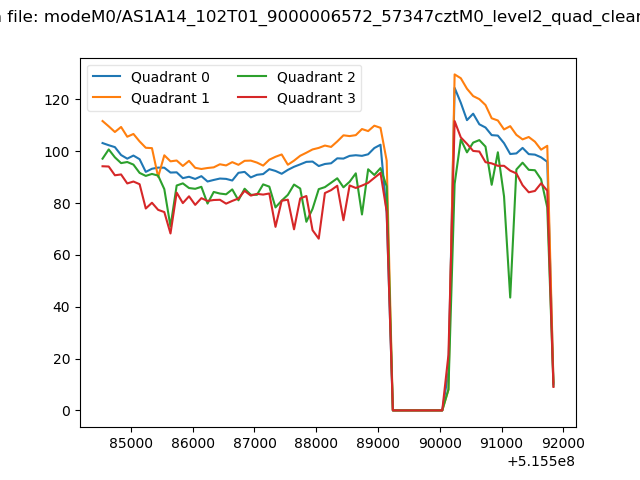 |
|
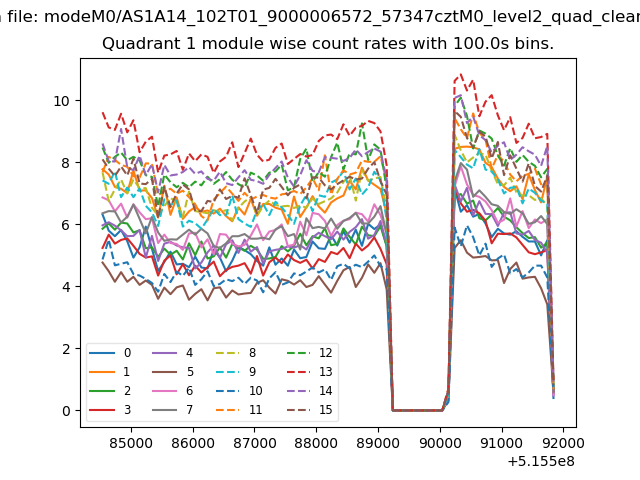
| Module-wise count rates for Quadrant A Data is divided into 100 sec bins |
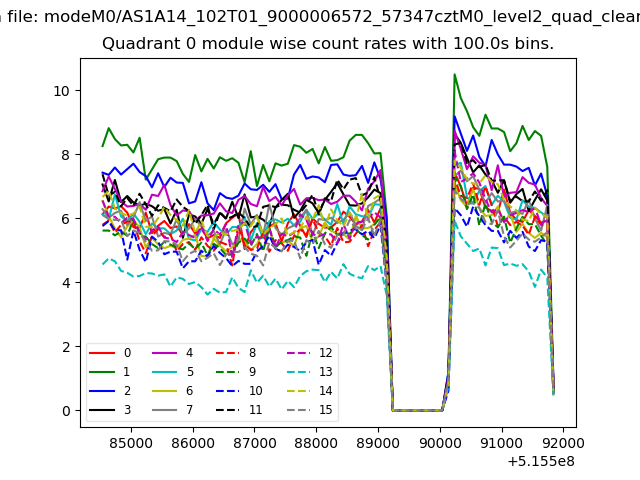 |
 |
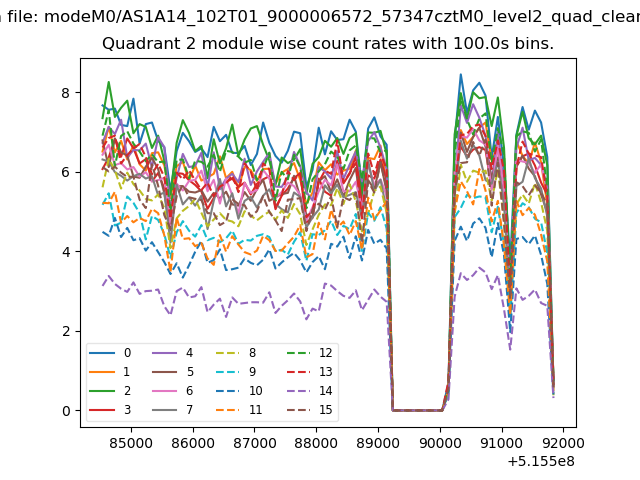
| Module-wise count rates for Quadrant B Data is divided into 100 sec bins |
 |
 |
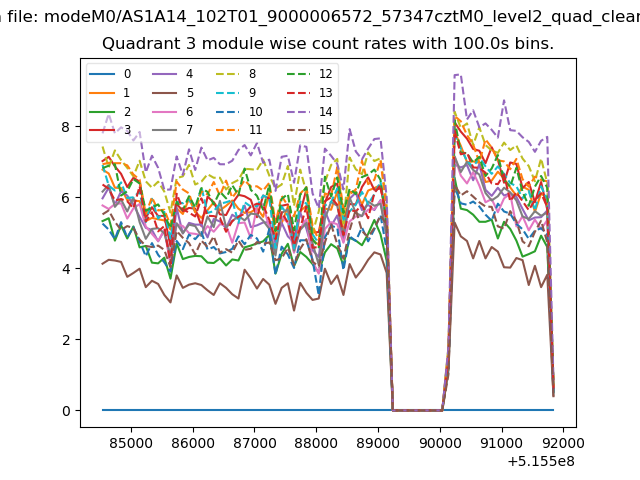
| Module-wise count rates for Quadrant C Data is divided into 100 sec bins |
 |
 |
| Module-wise count rates for Quadrant D Data is divided into 100 sec bins |
 |
 |
| Parameter | Plot |
|---|---|
| CZT HV Monitor |  |
| D_VDD | 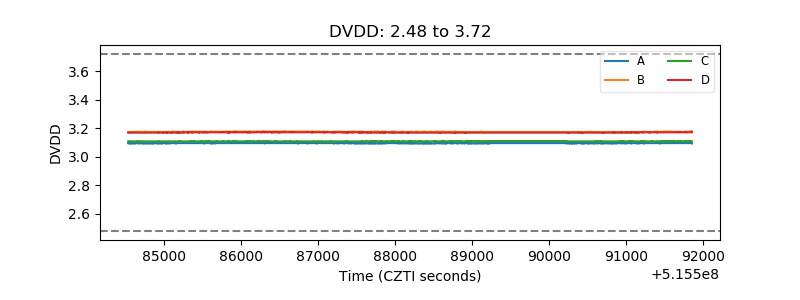 |
| Temperature 1 | 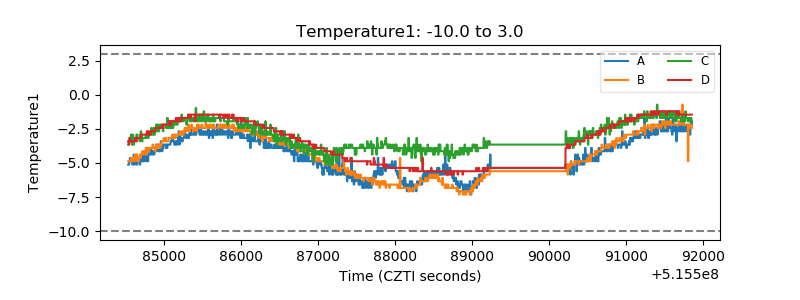 |
| Veto HV Monitor | 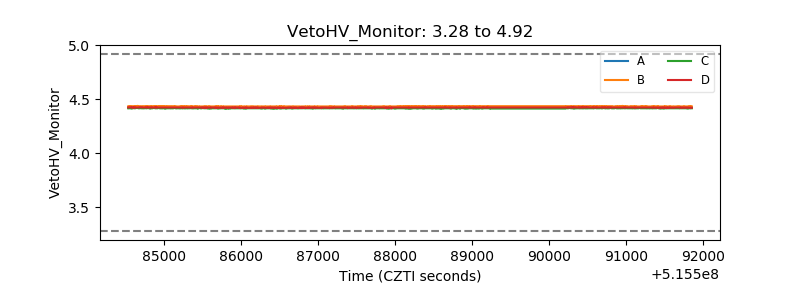 |
| Veto LLD | 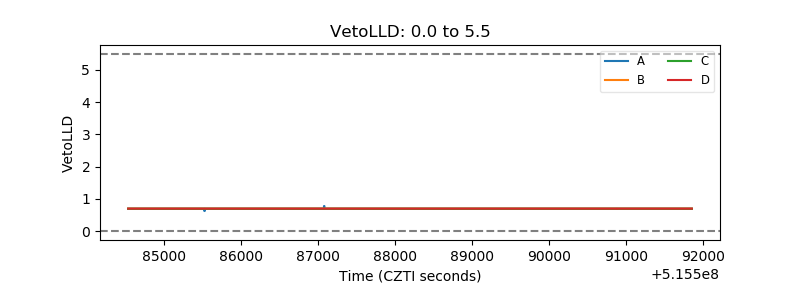 |
| Alpha Counter | 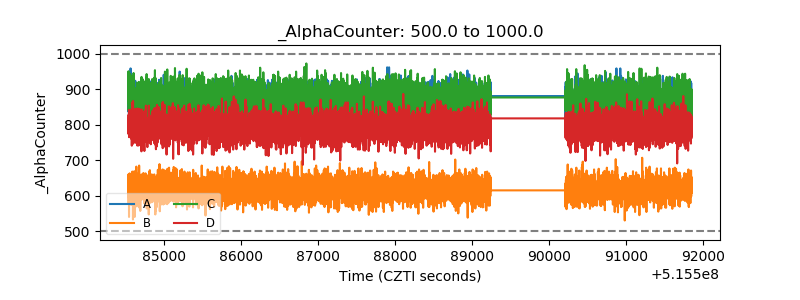 |
| _CPM_Rate | 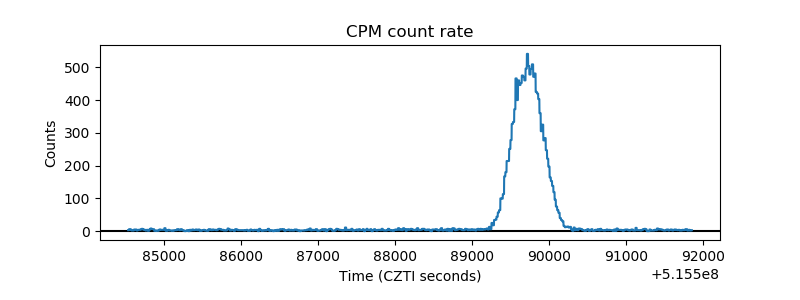 |
| CZT Counter | 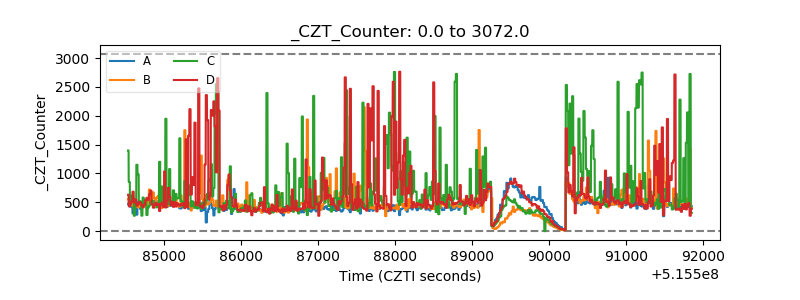 |
| +2.5 Volts monitor |  |
| +5 Volts monitor |  |
| _ROLL_ROT | 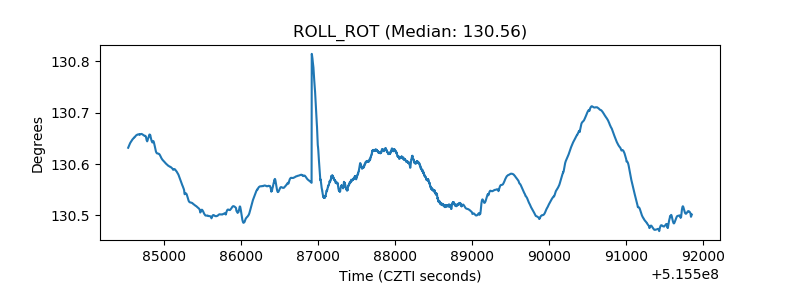 |
| _Roll_DEC | 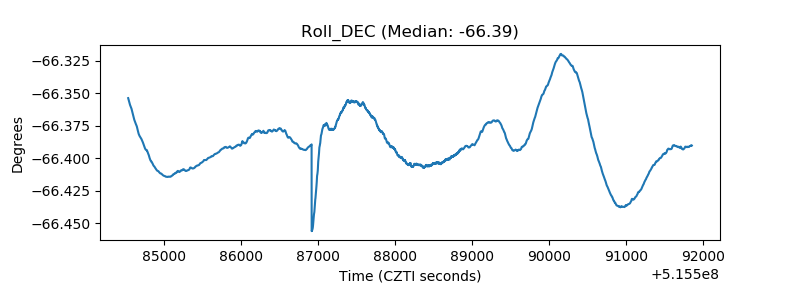 |
| _Roll_RA | 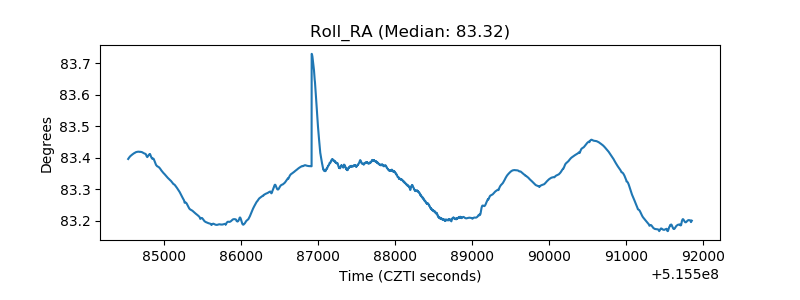 |
| Veto Counter | 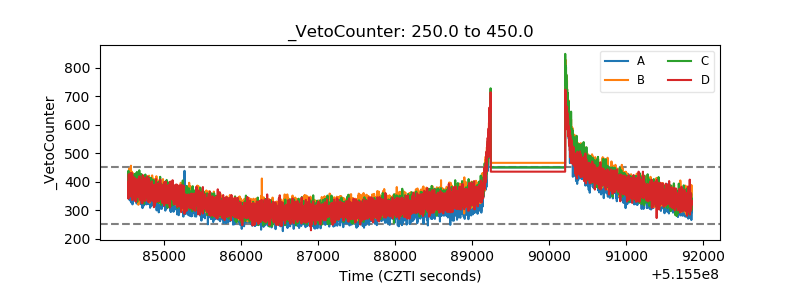 |