| Param | Original file | Final file |
|---|---|---|
| Filename | modeM0/AS1A14_102T01_9000006572_57348cztM0_level2.fits | modeM0/AS1A14_102T01_9000006572_57348cztM0_level2_quad_clean.evt |
| Size (bytes) | 406,235,520 | 91,828,800 |
| Size | 387.4 MB | 87.6 MB |
| Events in quadrant A | 2,881,080 | 609,690 |
| Events in quadrant B | 3,183,075 | 644,930 |
| Events in quadrant C | 4,286,540 | 556,824 |
| Events in quadrant D | 4,205,448 | 537,616 |
| Mode M0 | |||
|---|---|---|---|
| Quadrant | BADHDUFLAG | Total packets | Discarded packets |
| A | 0 | 12953 | 1 |
| B | 0 | 13857 | 1 |
| C | 0 | 17156 | 1 |
| D | 0 | 16679 | 3 |
| Mode M9 | |||
|---|---|---|---|
| Quadrant | BADHDUFLAG | Total packets | Discarded packets |
| A | 0 | 11 | 0 |
| B | 0 | 11 | 0 |
| C | 0 | 11 | 0 |
| D | 0 | 11 | 0 |
| Mode SS | |||
|---|---|---|---|
| Quadrant | BADHDUFLAG | Total packets | Discarded packets |
| A | 0 | 124 | 0 |
| B | 0 | 124 | 0 |
| C | 0 | 124 | 0 |
| D | 0 | 124 | 0 |
| Quadrant | Total seconds | Saturated seconds | Saturation percentage |
|---|---|---|---|
| A | 6185 | 89 | 1.438965% |
| B | 6186 | 160 | 2.586486% |
| C | 6186 | 348 | 5.625606% |
| D | 6185 | 250 | 4.042037% |
Noise dominated data is calculated using 1-second bins in cleaned event files. If a bin has >2000 counts, and if more than 50% of those come from <1% of pixels, then it is considered to be noise-dominated and hence unusable.
| Quadrant | # 1 sec bins | Bins with >0 counts | Bins with >2000 counts | High rate bins dominated by noise | Noise dominated (total time) | Noise dominated (detector-on time) | Marked lightcurve |
|---|---|---|---|---|---|---|---|
| A | 7265 | 6186 | 12 | 12 | 0.17% | 0.19% | 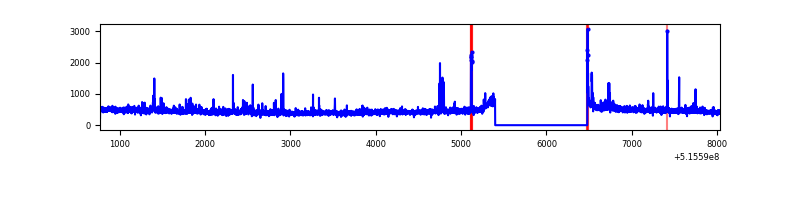 |
| B | 7266 | 6187 | 50 | 50 | 0.69% | 0.81% | 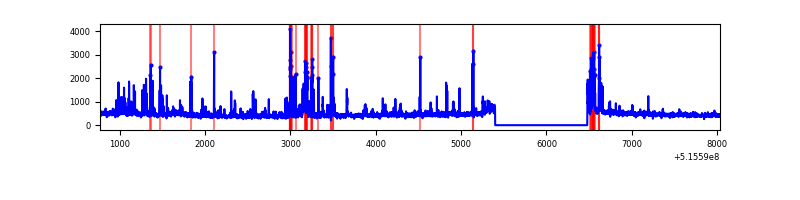 |
| C | 7266 | 6187 | 231 | 231 | 3.18% | 3.73% | 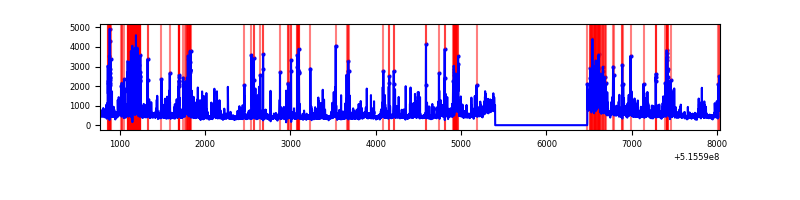 |
| D | 7265 | 6186 | 211 | 211 | 2.90% | 3.41% | 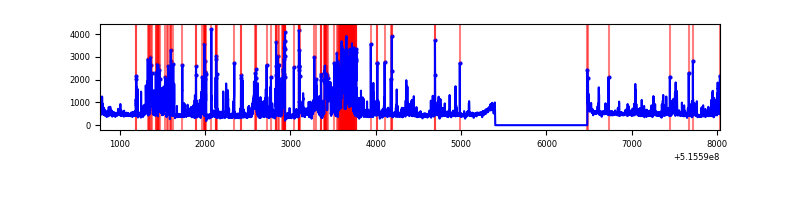 |
Top three noisy pixels from each quadrant. If the there are fewer than three noisy pixels in the level2.evt file, extra rows are filled as -1
| Pixel properties | Quadrant properties | ||||||
|---|---|---|---|---|---|---|---|
| Quadrant | DetID | PixID | Counts | Sigma | Mean | Median | Sigma |
| A | 0 | 12 | 101791 | 596.06 | 683 | 667 | 169.7 |
| A | 3 | 14 | 46395 | 269.53 | 683 | 667 | 169.7 |
| A | 10 | 251 | 25848 | 148.42 | 683 | 667 | 169.7 |
| B | 5 | 185 | 218637 | 1537.87 | 664 | 640 | 141.8 |
| B | 7 | 252 | 113433 | 795.7 | 664 | 640 | 141.8 |
| B | 0 | 153 | 49918 | 347.63 | 664 | 640 | 141.8 |
| C | 15 | 224 | 1215793 | 7007.37 | 637 | 630 | 173.4 |
| C | 13 | 3 | 300400 | 1728.66 | 637 | 630 | 173.4 |
| C | 6 | 223 | 89146 | 510.44 | 637 | 630 | 173.4 |
| D | 8 | 240 | 438542 | 2367.48 | 651 | 622 | 185.0 |
| D | 5 | 222 | 313437 | 1691.14 | 651 | 622 | 185.0 |
| D | 2 | 249 | 312612 | 1686.68 | 651 | 622 | 185.0 |
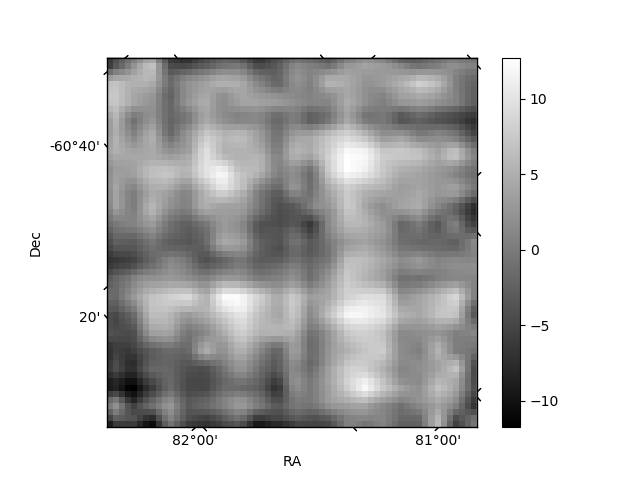
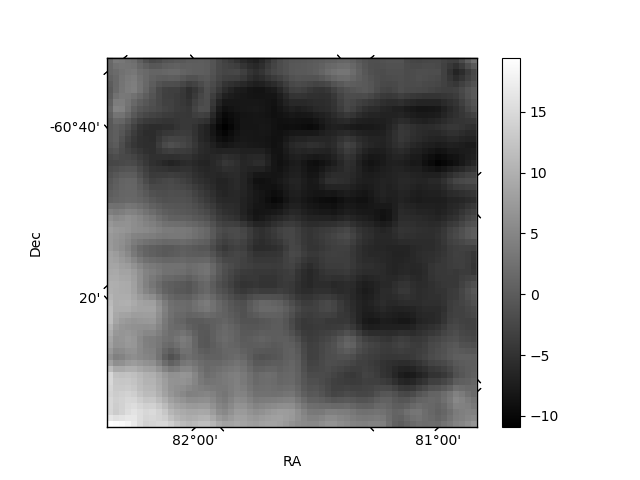
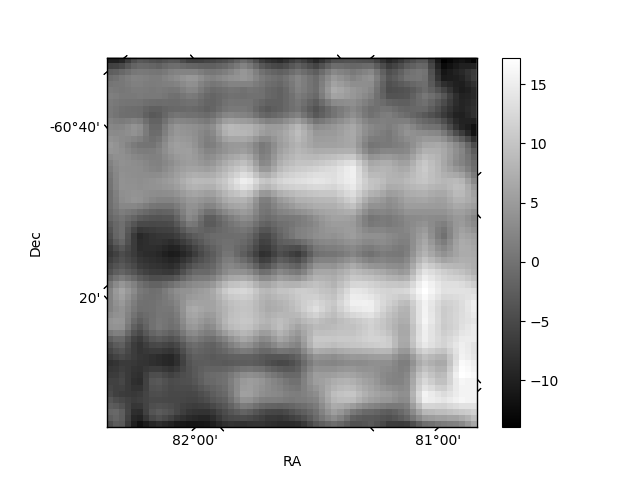
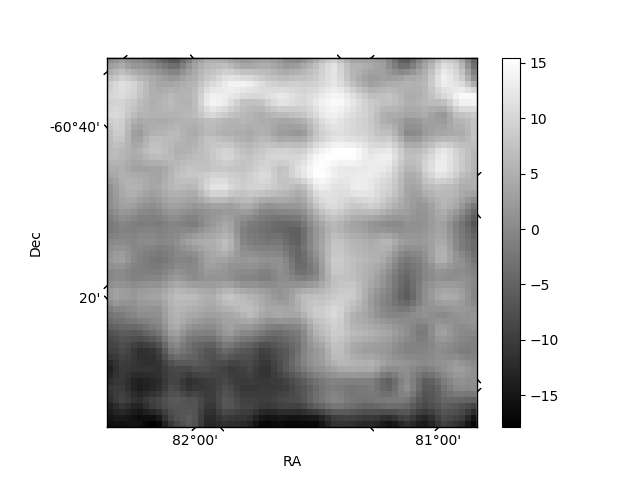
Histogram calculated using DETX and DETY for each event in the final _common_clean file
| Quadrant A | 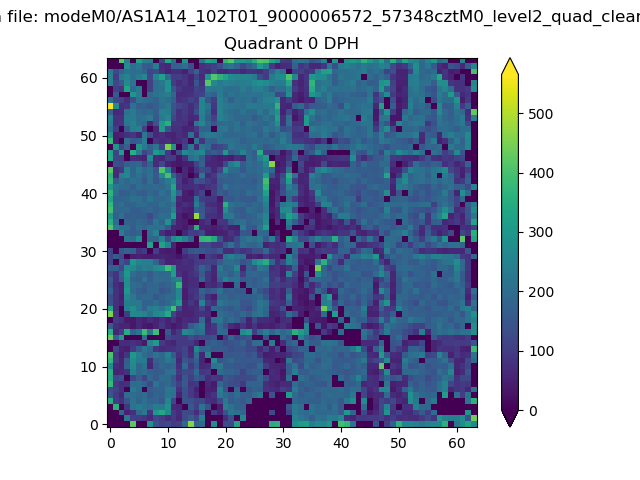 |
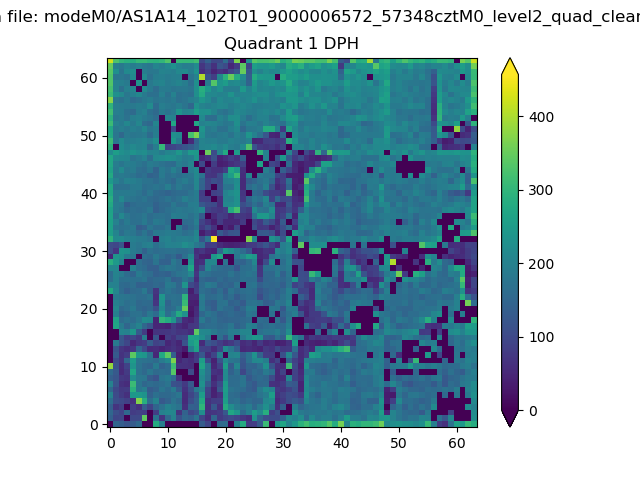 |
Quadrant B |
|---|---|---|---|
| Quadrant D | 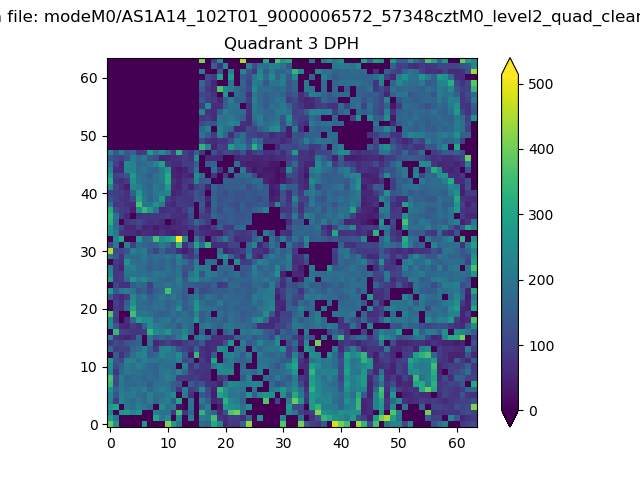 |
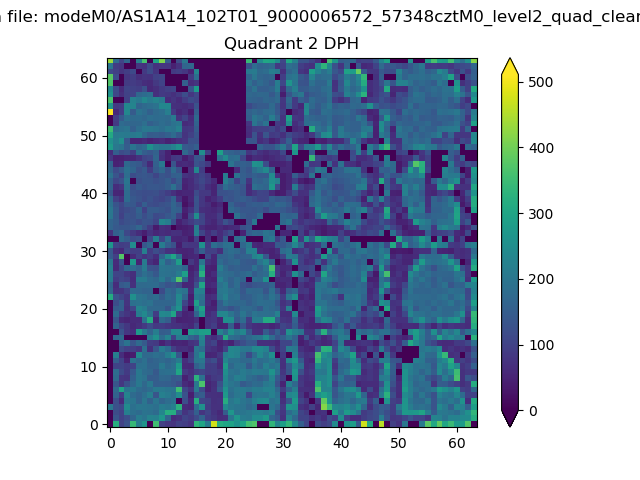 |
Quadrant C |
| Plot type | Count rate plots | Images |
|---|---|---|
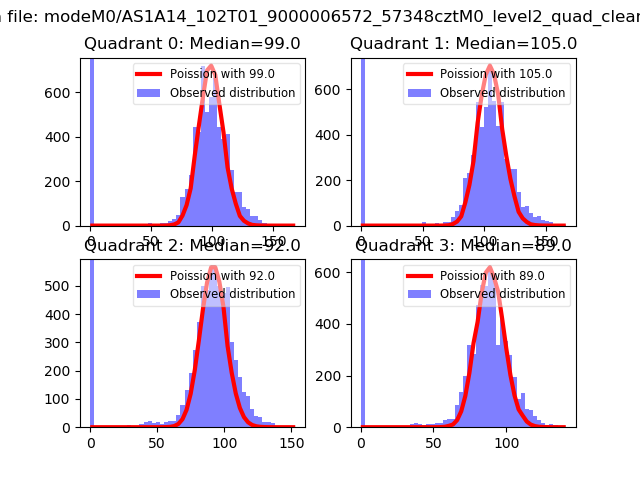
| Comparison with Poisson distribution Blue bars denote a histogram of data divided into 1 sec bins. Red curve is a Poisson curve with rate = median count rate of data. |
 |
 |
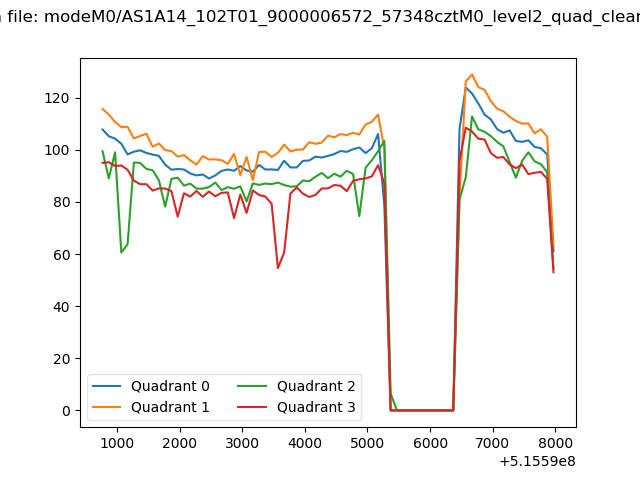
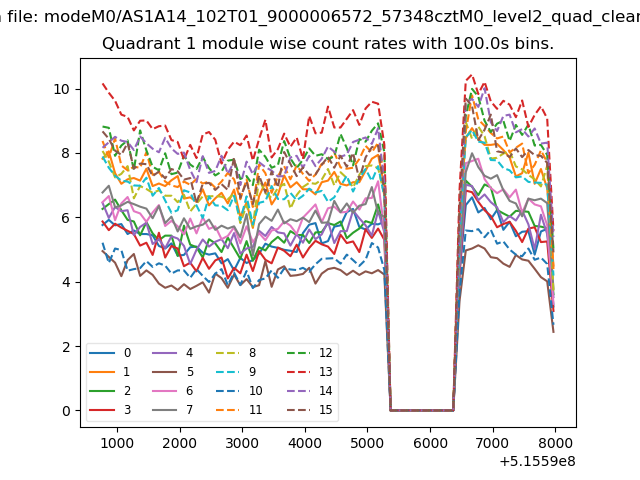
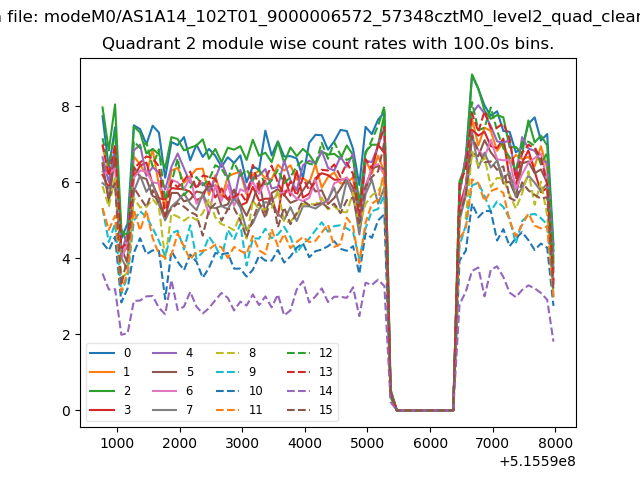
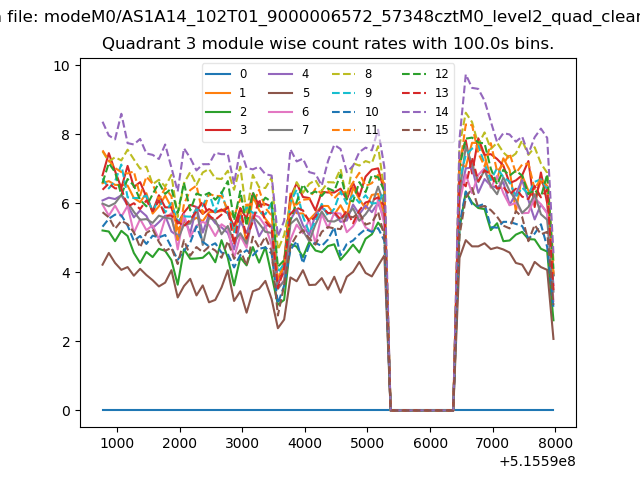
| Quadrant-wise count rates Data is divided into 100 sec bins |
 |
|
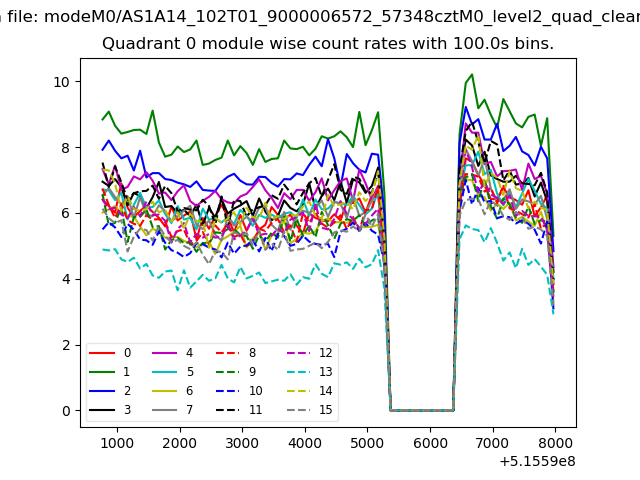
| Module-wise count rates for Quadrant A Data is divided into 100 sec bins |
 |
 |
| Module-wise count rates for Quadrant B Data is divided into 100 sec bins |
 |
 |
| Module-wise count rates for Quadrant C Data is divided into 100 sec bins |
 |
 |
| Module-wise count rates for Quadrant D Data is divided into 100 sec bins |
 |
 |
| Parameter | Plot |
|---|---|
| CZT HV Monitor |  |
| D_VDD | 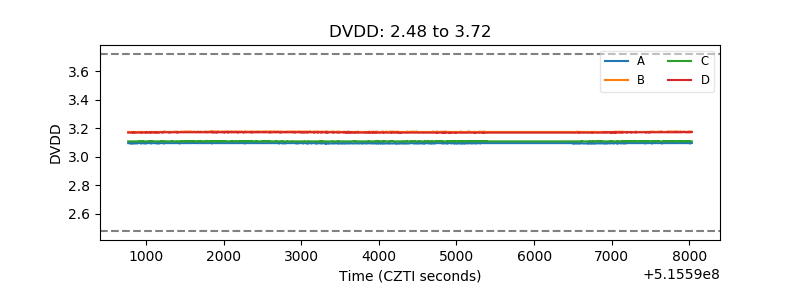 |
| Temperature 1 | 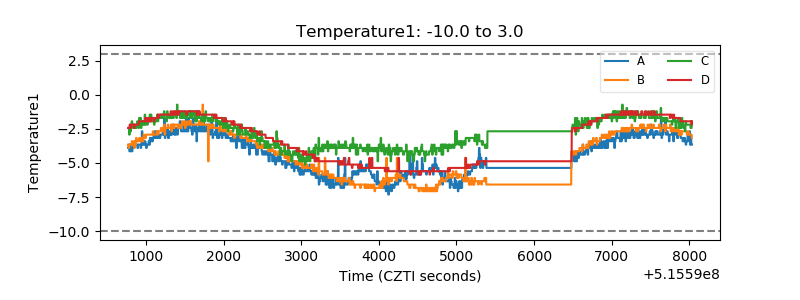 |
| Veto HV Monitor | 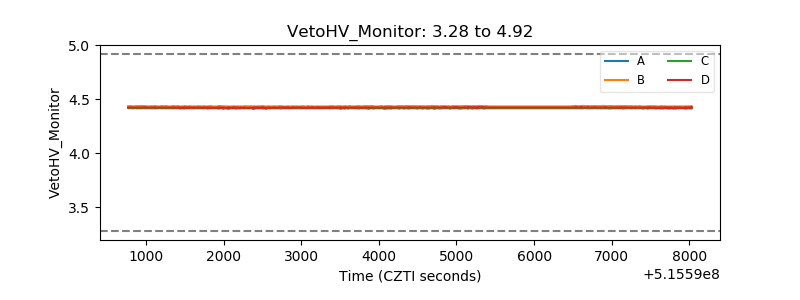 |
| Veto LLD | 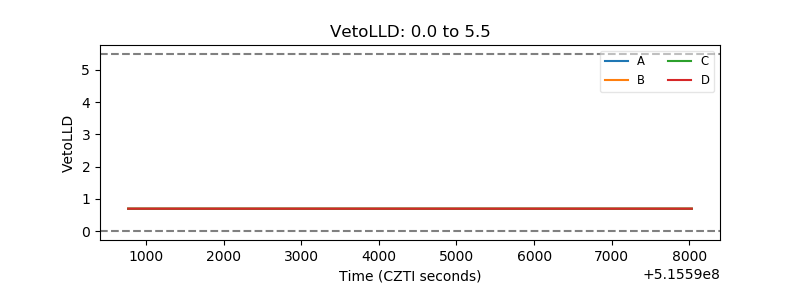 |
| Alpha Counter | 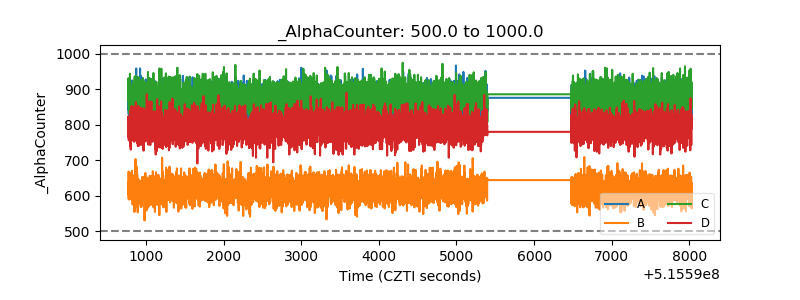 |
| _CPM_Rate | 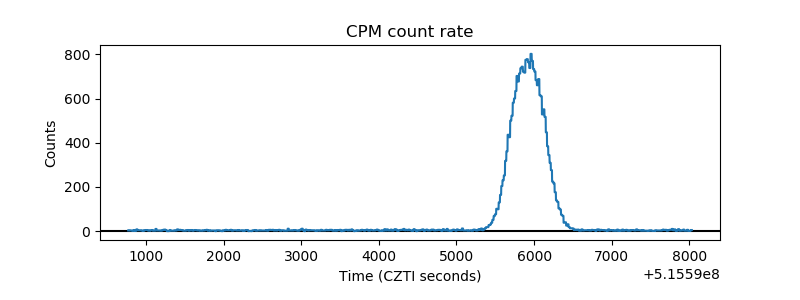 |
| CZT Counter | 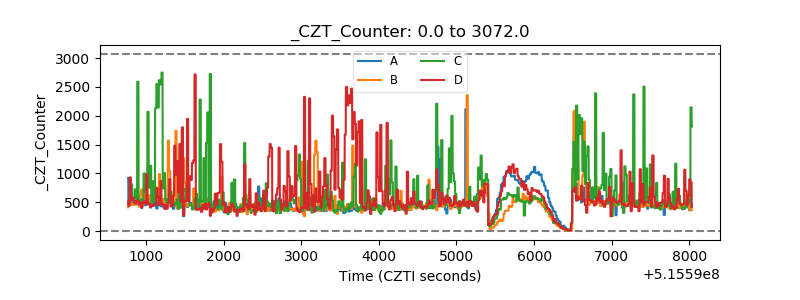 |
| +2.5 Volts monitor | 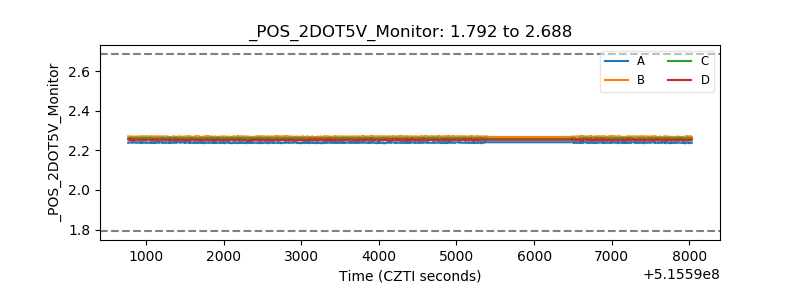 |
| +5 Volts monitor |  |
| _ROLL_ROT | 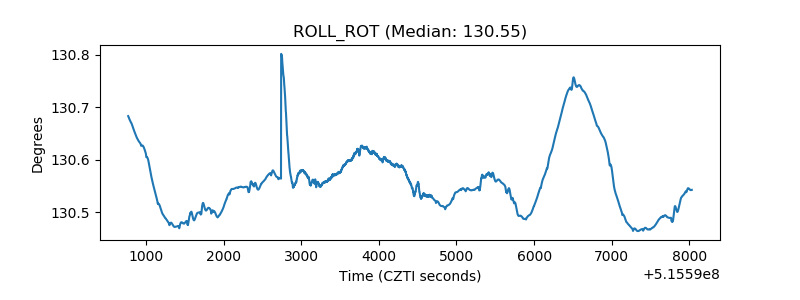 |
| _Roll_DEC | 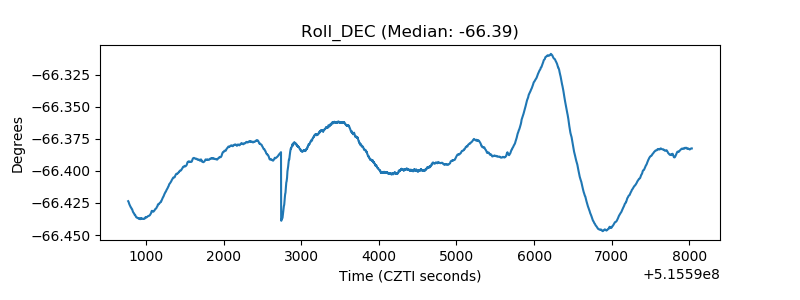 |
| _Roll_RA | 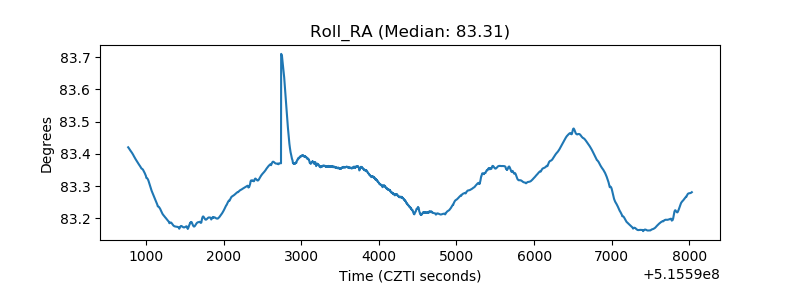 |
| Veto Counter | 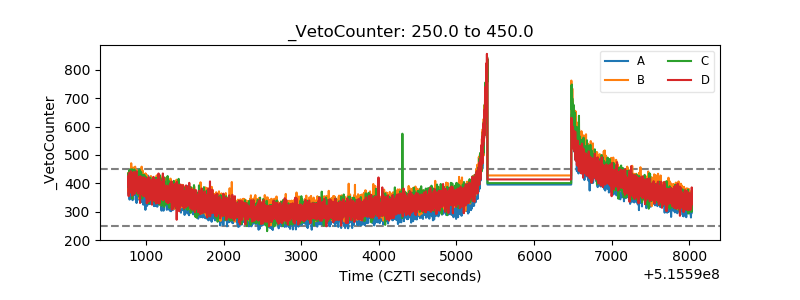 |