| Param | Original file | Final file |
|---|---|---|
| Filename | modeM0/AS1A14_102T01_9000006572_57349cztM0_level2.fits | modeM0/AS1A14_102T01_9000006572_57349cztM0_level2_quad_clean.evt |
| Size (bytes) | 395,363,520 | 86,578,560 |
| Size | 377.0 MB | 82.6 MB |
| Events in quadrant A | 2,801,223 | 572,301 |
| Events in quadrant B | 2,850,252 | 614,196 |
| Events in quadrant C | 4,548,313 | 516,481 |
| Events in quadrant D | 3,961,602 | 493,456 |
| Mode M0 | |||
|---|---|---|---|
| Quadrant | BADHDUFLAG | Total packets | Discarded packets |
| A | 0 | 12658 | 1 |
| B | 0 | 12777 | 1 |
| C | 0 | 17881 | 1 |
| D | 0 | 16010 | 1 |
| Mode M9 | |||
|---|---|---|---|
| Quadrant | BADHDUFLAG | Total packets | Discarded packets |
| A | 0 | 12 | 0 |
| B | 0 | 12 | 0 |
| C | 0 | 12 | 0 |
| D | 0 | 12 | 0 |
| Mode SS | |||
|---|---|---|---|
| Quadrant | BADHDUFLAG | Total packets | Discarded packets |
| A | 0 | 124 | 0 |
| B | 0 | 124 | 0 |
| C | 0 | 124 | 0 |
| D | 0 | 124 | 0 |
| Quadrant | Total seconds | Saturated seconds | Saturation percentage |
|---|---|---|---|
| A | 6085 | 54 | 0.887428% |
| B | 6086 | 56 | 0.920145% |
| C | 6086 | 358 | 5.882353% |
| D | 6086 | 227 | 3.729872% |
Noise dominated data is calculated using 1-second bins in cleaned event files. If a bin has >2000 counts, and if more than 50% of those come from <1% of pixels, then it is considered to be noise-dominated and hence unusable.
| Quadrant | # 1 sec bins | Bins with >0 counts | Bins with >2000 counts | High rate bins dominated by noise | Noise dominated (total time) | Noise dominated (detector-on time) | Marked lightcurve |
|---|---|---|---|---|---|---|---|
| A | 7553 | 6354 | 15 | 15 | 0.20% | 0.24% | 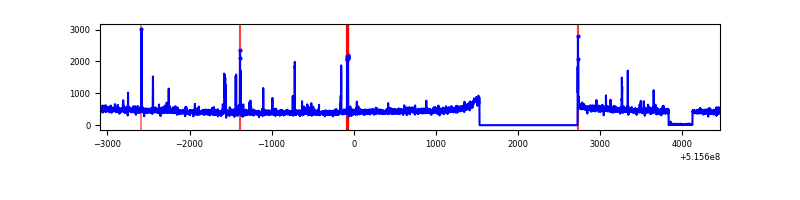 |
| B | 7554 | 6355 | 8 | 8 | 0.11% | 0.13% | 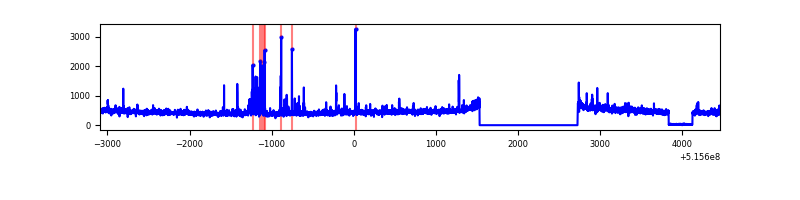 |
| C | 7554 | 6355 | 276 | 276 | 3.65% | 4.34% | 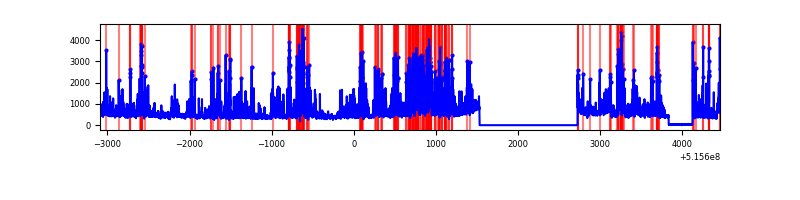 |
| D | 7554 | 6355 | 166 | 166 | 2.20% | 2.61% | 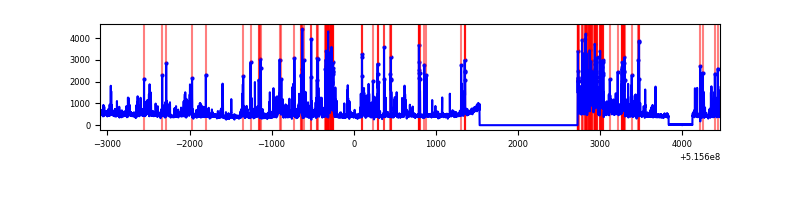 |
Top three noisy pixels from each quadrant. If the there are fewer than three noisy pixels in the level2.evt file, extra rows are filled as -1
| Pixel properties | Quadrant properties | ||||||
|---|---|---|---|---|---|---|---|
| Quadrant | DetID | PixID | Counts | Sigma | Mean | Median | Sigma |
| A | 0 | 12 | 69110 | 408.21 | 675 | 657 | 167.7 |
| A | 3 | 14 | 36710 | 215.0 | 675 | 657 | 167.7 |
| A | 6 | 162 | 26370 | 153.34 | 675 | 657 | 167.7 |
| B | 7 | 252 | 98575 | 698.29 | 660 | 635 | 140.3 |
| B | 0 | 199 | 66422 | 469.04 | 660 | 635 | 140.3 |
| B | 0 | 213 | 20727 | 143.25 | 660 | 635 | 140.3 |
| C | 15 | 224 | 1159449 | 6809.12 | 624 | 617 | 170.2 |
| C | 6 | 223 | 397364 | 2331.22 | 624 | 617 | 170.2 |
| C | 12 | 252 | 284646 | 1668.91 | 624 | 617 | 170.2 |
| D | 2 | 249 | 635424 | 3486.76 | 638 | 607 | 182.1 |
| D | 8 | 240 | 434590 | 2383.67 | 638 | 607 | 182.1 |
| D | 2 | 120 | 99374 | 542.48 | 638 | 607 | 182.1 |
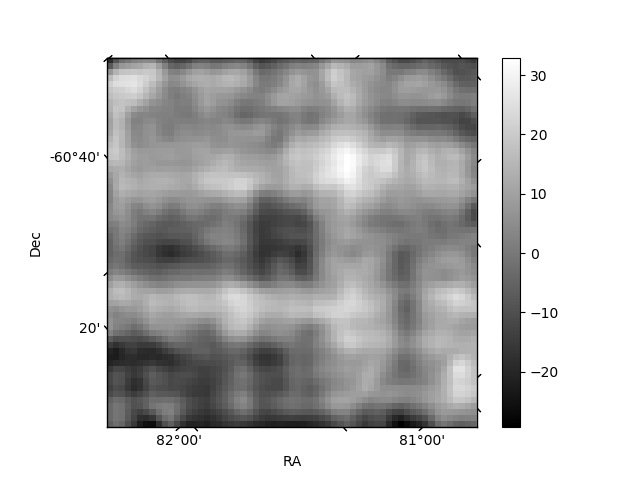
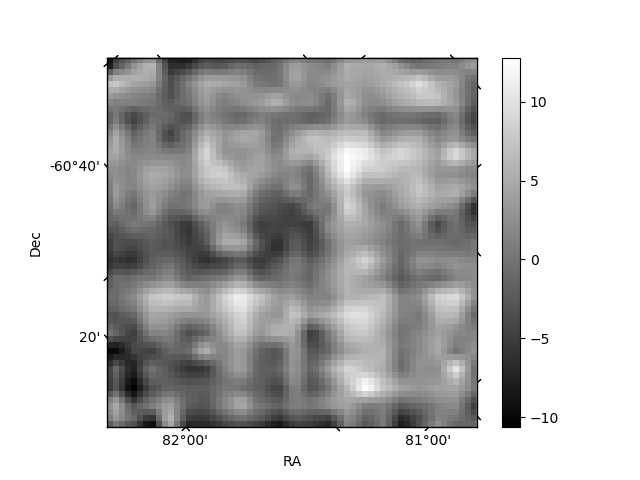
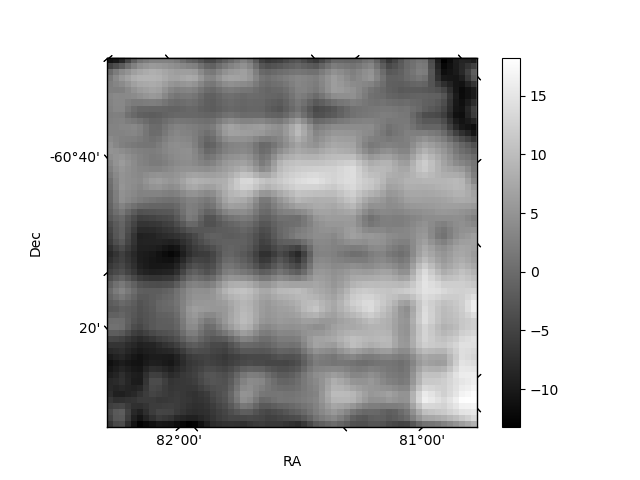
Histogram calculated using DETX and DETY for each event in the final _common_clean file
| Quadrant A | 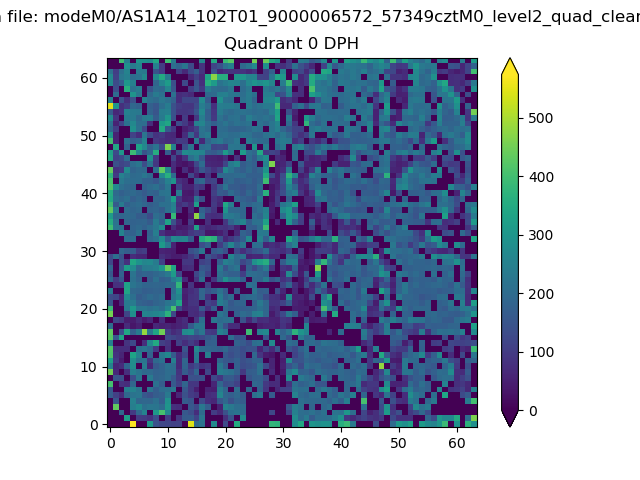 |
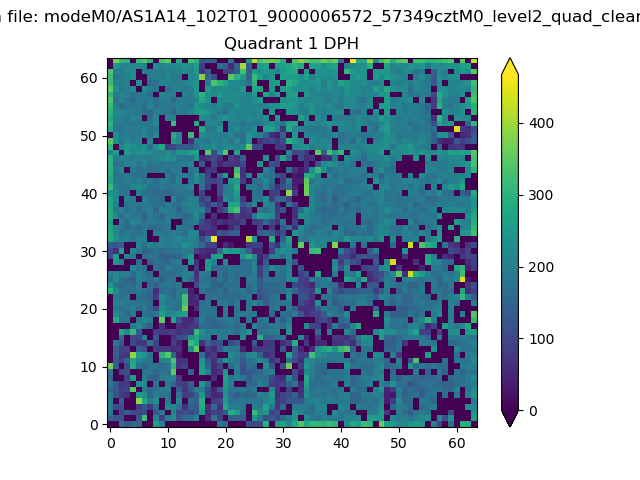 |
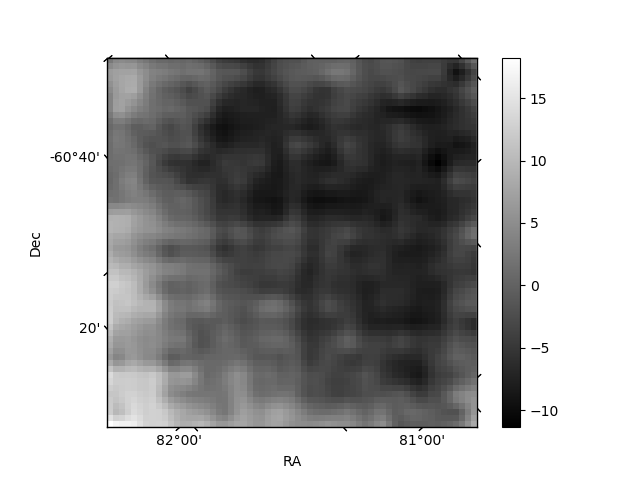
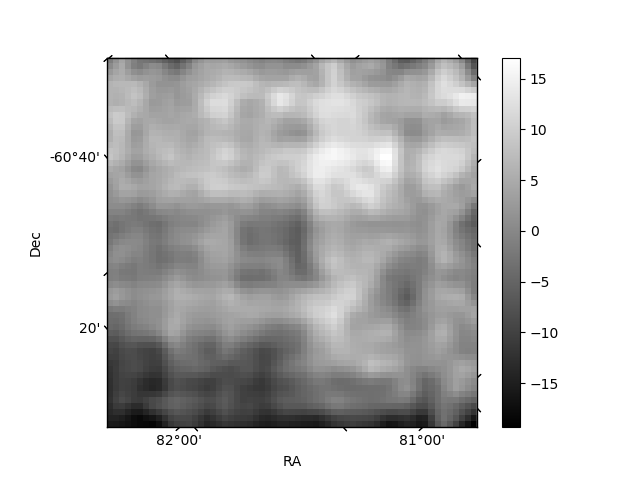
Quadrant B |
|---|---|---|---|
| Quadrant D | 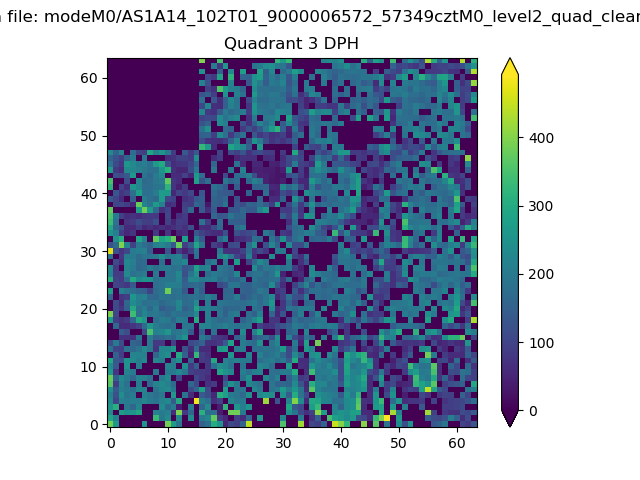 |
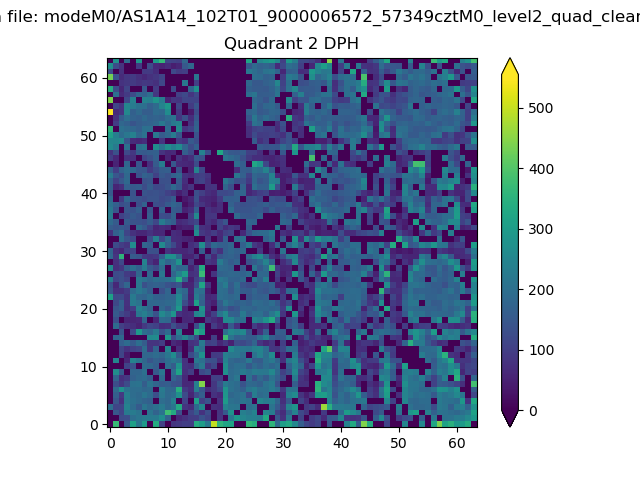 |
Quadrant C |
| Plot type | Count rate plots | Images |
|---|---|---|
| Comparison with Poisson distribution Blue bars denote a histogram of data divided into 1 sec bins. Red curve is a Poisson curve with rate = median count rate of data. |
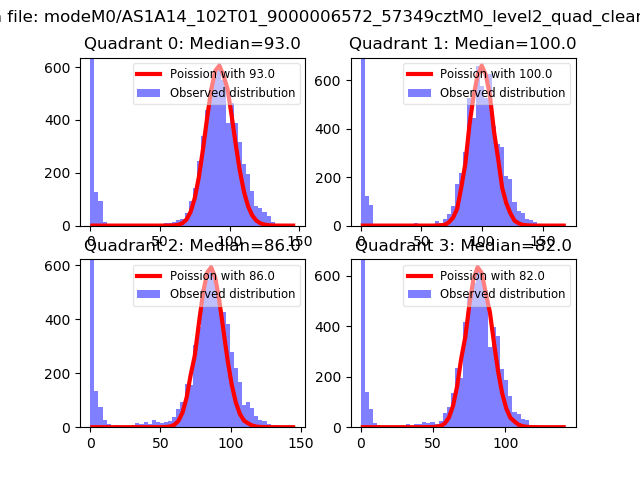 |
 |
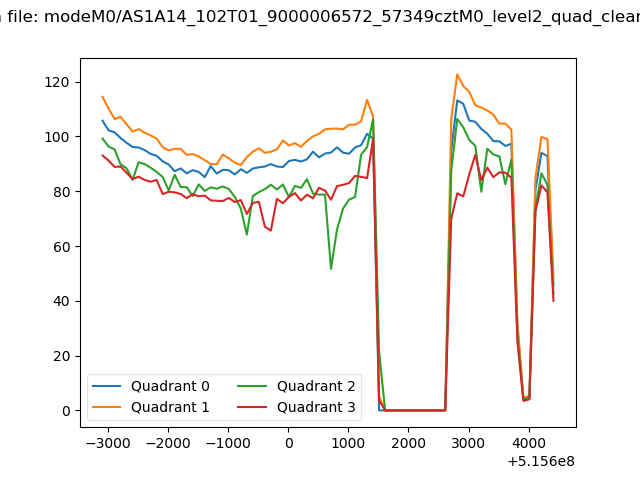
| Quadrant-wise count rates Data is divided into 100 sec bins |
 |
|
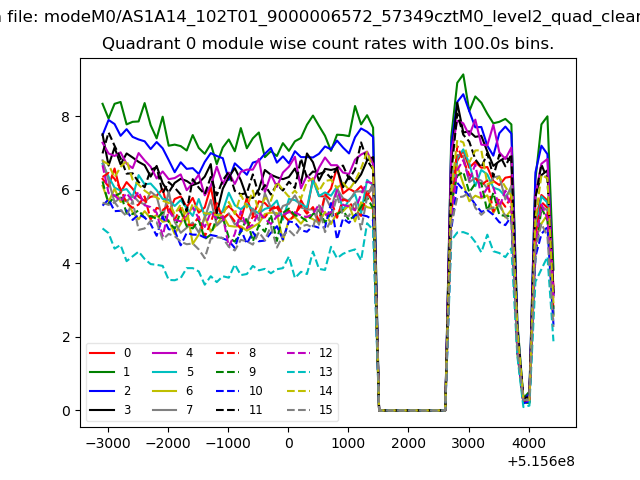
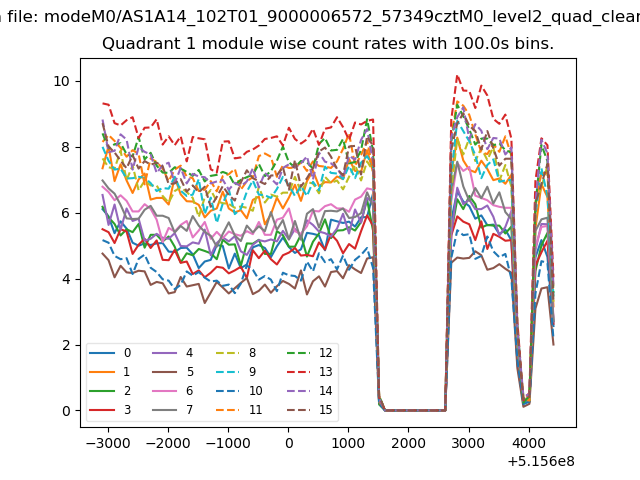
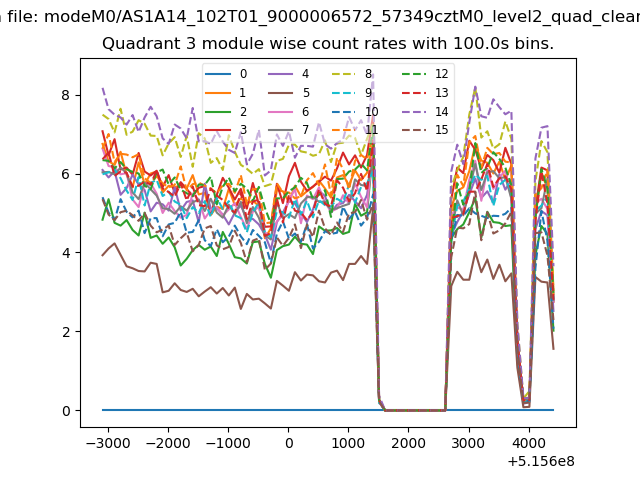
| Module-wise count rates for Quadrant A Data is divided into 100 sec bins |
 |
 |
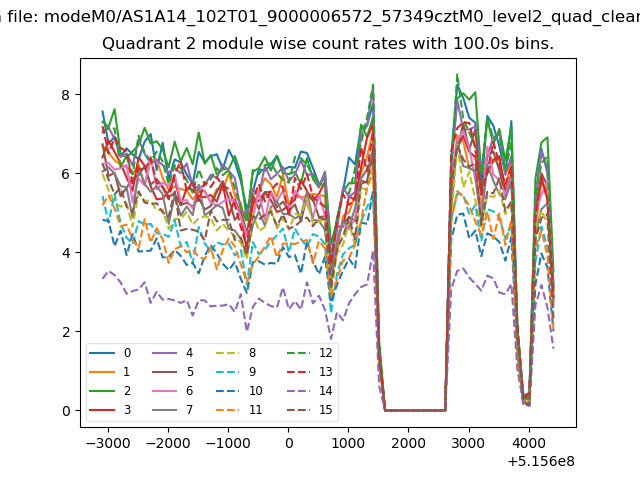
| Module-wise count rates for Quadrant B Data is divided into 100 sec bins |
 |
 |
| Module-wise count rates for Quadrant C Data is divided into 100 sec bins |
 |
 |
| Module-wise count rates for Quadrant D Data is divided into 100 sec bins |
 |
 |
| Parameter | Plot |
|---|---|
| CZT HV Monitor | 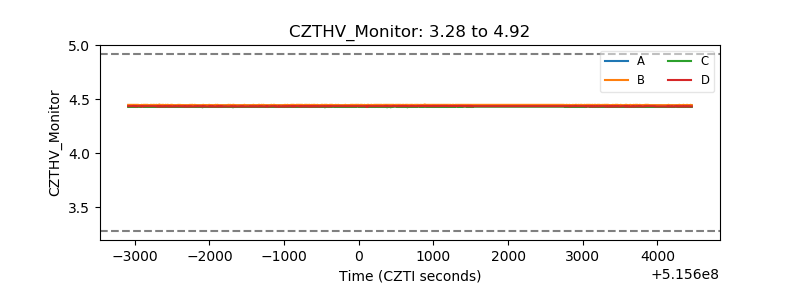 |
| D_VDD | 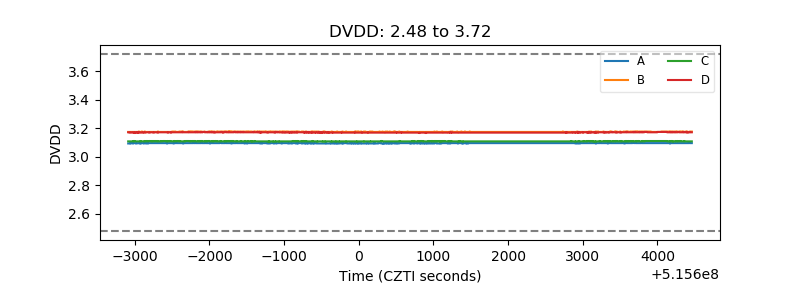 |
| Temperature 1 | 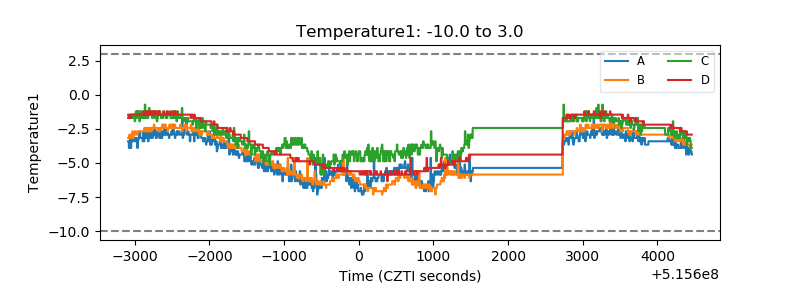 |
| Veto HV Monitor | 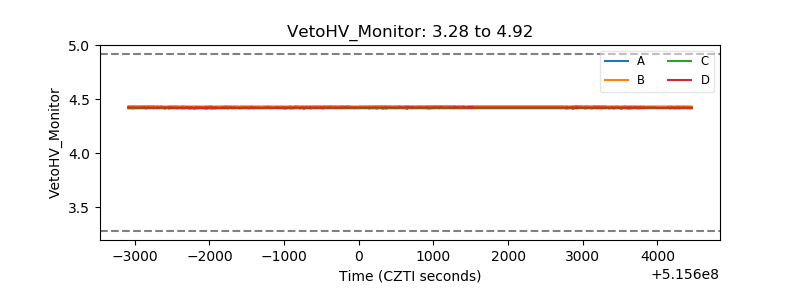 |
| Veto LLD | 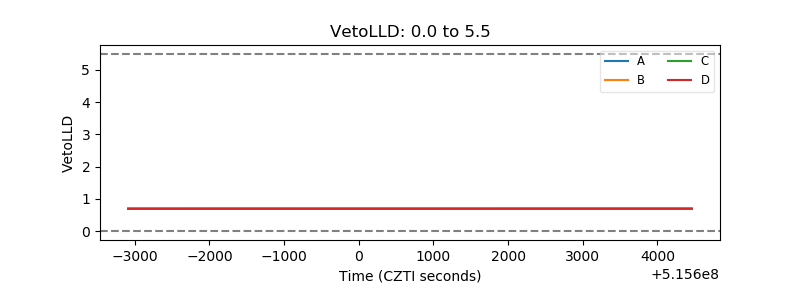 |
| Alpha Counter | 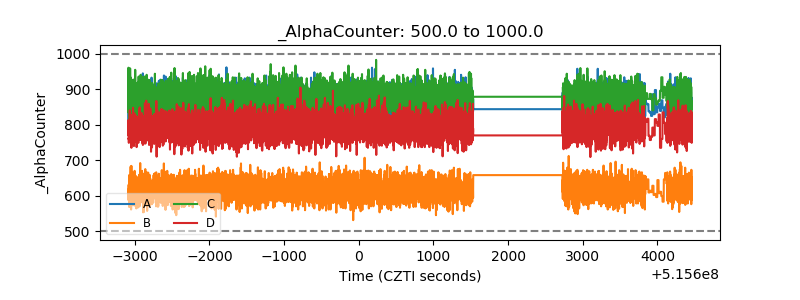 |
| _CPM_Rate | 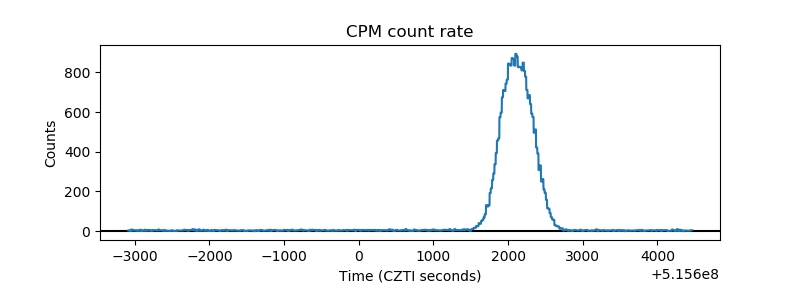 |
| CZT Counter | 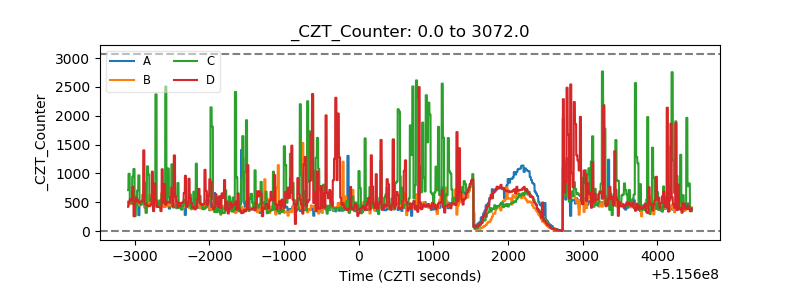 |
| +2.5 Volts monitor | 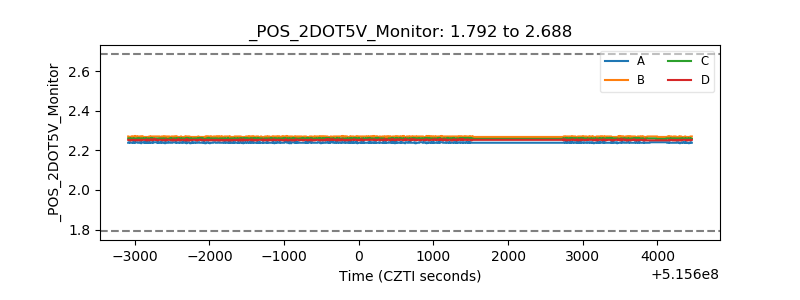 |
| +5 Volts monitor | 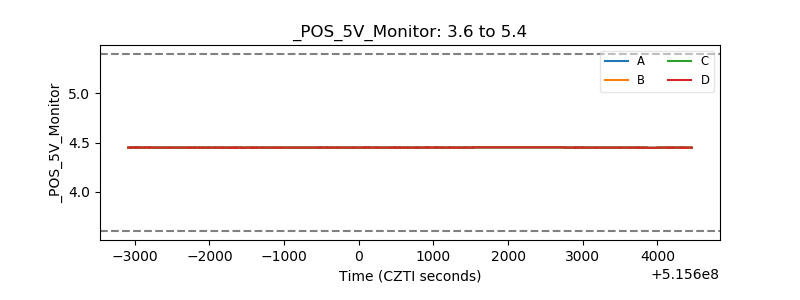 |
| _ROLL_ROT | 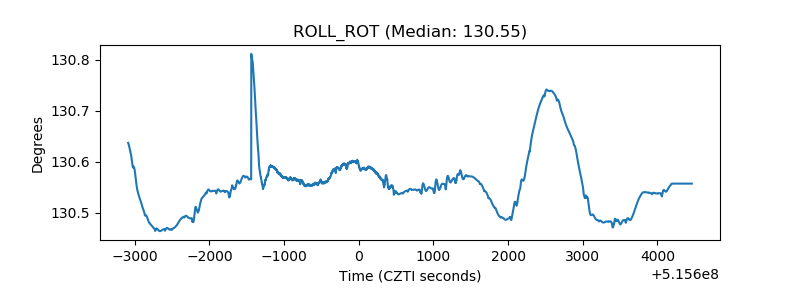 |
| _Roll_DEC | 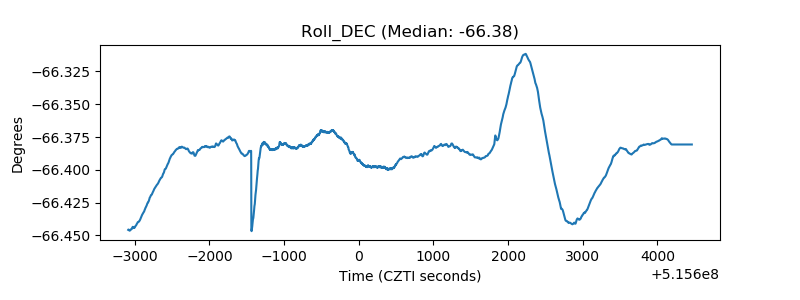 |
| _Roll_RA | 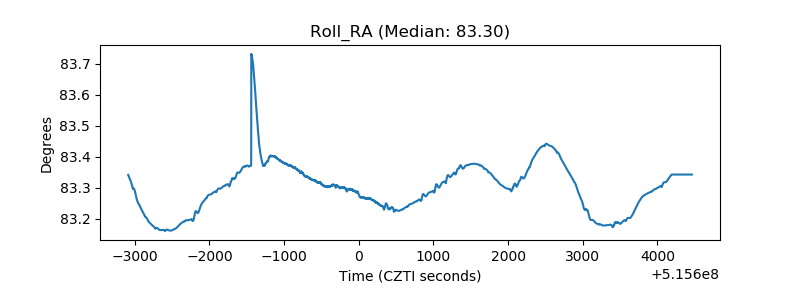 |
| Veto Counter | 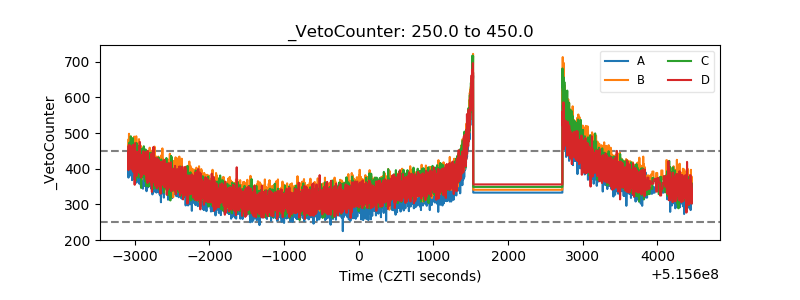 |