| Param | Original file | Final file |
|---|---|---|
| Filename | modeM0/AS1A14_102T01_9000006572_57352cztM0_level2.fits | modeM0/AS1A14_102T01_9000006572_57352cztM0_level2_quad_clean.evt |
| Size (bytes) | 430,940,160 | 83,165,760 |
| Size | 411.0 MB | 79.3 MB |
| Events in quadrant A | 3,184,258 | 546,825 |
| Events in quadrant B | 2,921,365 | 579,728 |
| Events in quadrant C | 4,095,054 | 508,592 |
| Events in quadrant D | 5,270,231 | 452,089 |
| Mode M0 | |||
|---|---|---|---|
| Quadrant | BADHDUFLAG | Total packets | Discarded packets |
| A | 0 | 14570 | 573 |
| B | 0 | 13829 | 619 |
| C | 0 | 17320 | 768 |
| D | 0 | 20861 | 885 |
| Mode M9 | |||
|---|---|---|---|
| Quadrant | BADHDUFLAG | Total packets | Discarded packets |
| A | 0 | 9 | 0 |
| B | 0 | 9 | 0 |
| C | 0 | 9 | 0 |
| D | 0 | 9 | 0 |
| Mode SS | |||
|---|---|---|---|
| Quadrant | BADHDUFLAG | Total packets | Discarded packets |
| A | 0 | 130 | 8 |
| B | 0 | 130 | 6 |
| C | 0 | 130 | 8 |
| D | 0 | 130 | 8 |
| Quadrant | Total seconds | Saturated seconds | Saturation percentage |
|---|---|---|---|
| A | 6200 | 50 | 0.806452% |
| B | 6182 | 94 | 1.520544% |
| C | 6179 | 243 | 3.932675% |
| D | 6162 | 685 | 11.116521% |
Noise dominated data is calculated using 1-second bins in cleaned event files. If a bin has >2000 counts, and if more than 50% of those come from <1% of pixels, then it is considered to be noise-dominated and hence unusable.
| Quadrant | # 1 sec bins | Bins with >0 counts | Bins with >2000 counts | High rate bins dominated by noise | Noise dominated (total time) | Noise dominated (detector-on time) | Marked lightcurve |
|---|---|---|---|---|---|---|---|
| A | 7612 | 6593 | 20 | 20 | 0.26% | 0.30% | 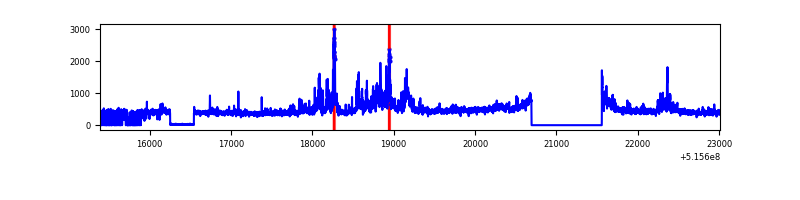 |
| B | 7620 | 6590 | 14 | 14 | 0.18% | 0.21% | 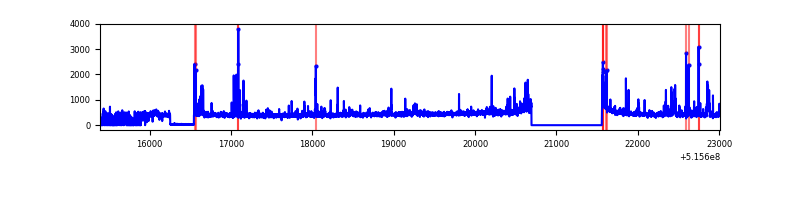 |
| C | 7616 | 6571 | 198 | 198 | 2.60% | 3.01% | 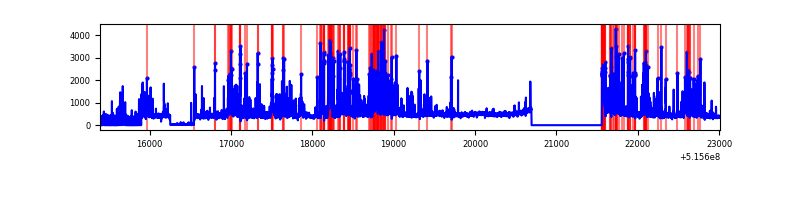 |
| D | 7605 | 6546 | 612 | 612 | 8.05% | 9.35% | 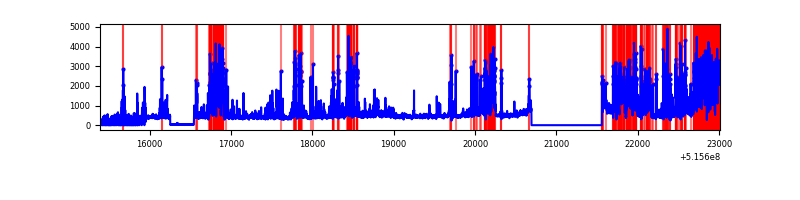 |
Top three noisy pixels from each quadrant. If the there are fewer than three noisy pixels in the level2.evt file, extra rows are filled as -1
| Pixel properties | Quadrant properties | ||||||
|---|---|---|---|---|---|---|---|
| Quadrant | DetID | PixID | Counts | Sigma | Mean | Median | Sigma |
| A | 12 | 3 | 367581 | 2194.41 | 667 | 651 | 167.2 |
| A | 4 | 95 | 85819 | 509.34 | 667 | 651 | 167.2 |
| A | 12 | 194 | 68050 | 403.08 | 667 | 651 | 167.2 |
| B | 7 | 252 | 95608 | 666.79 | 657 | 633 | 142.4 |
| B | 5 | 185 | 88132 | 614.3 | 657 | 633 | 142.4 |
| B | 1 | 191 | 32373 | 222.84 | 657 | 633 | 142.4 |
| C | 15 | 224 | 1435159 | 8318.49 | 630 | 623 | 172.5 |
| C | 14 | 254 | 45965 | 262.92 | 630 | 623 | 172.5 |
| C | 11 | 244 | 36201 | 206.3 | 630 | 623 | 172.5 |
| D | 8 | 240 | 2448007 | 14190.56 | 607 | 577 | 172.5 |
| D | 2 | 249 | 170574 | 985.66 | 607 | 577 | 172.5 |
| D | 8 | 48 | 75203 | 432.69 | 607 | 577 | 172.5 |
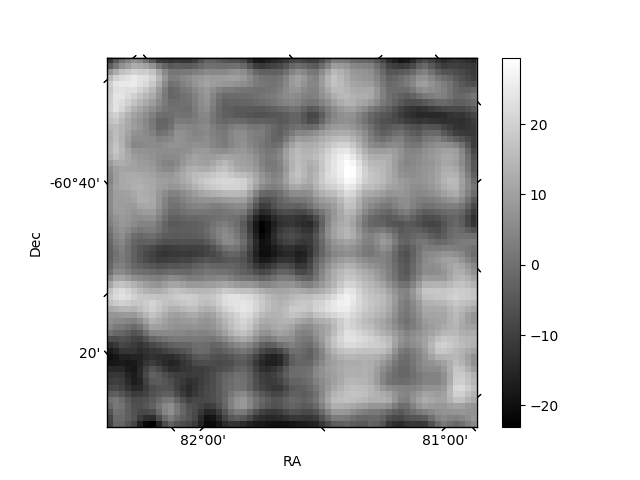
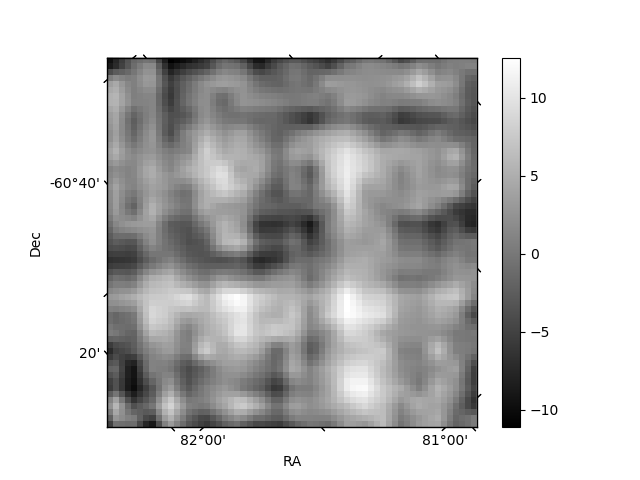
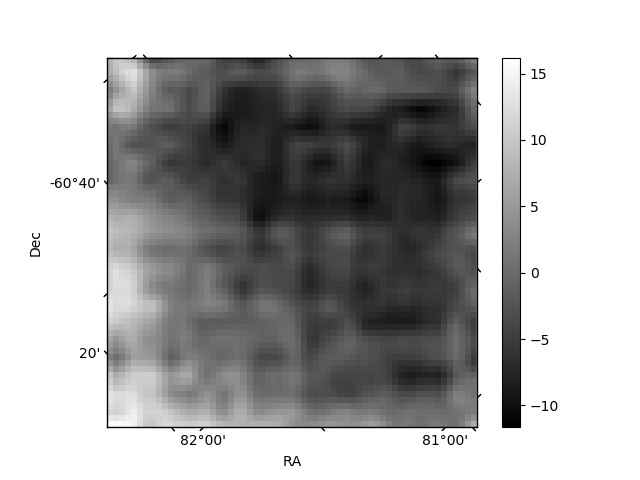
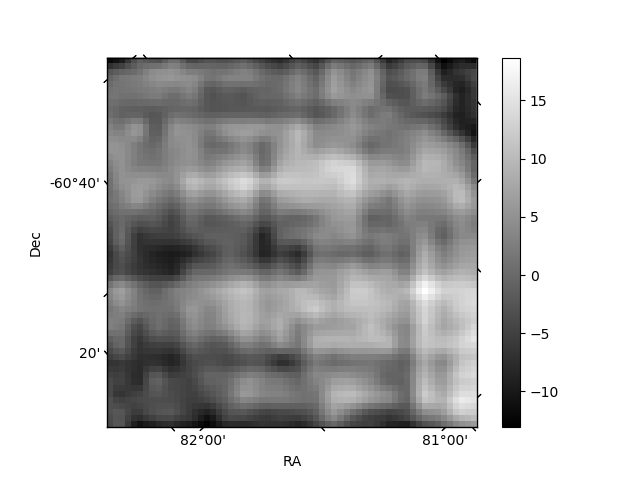
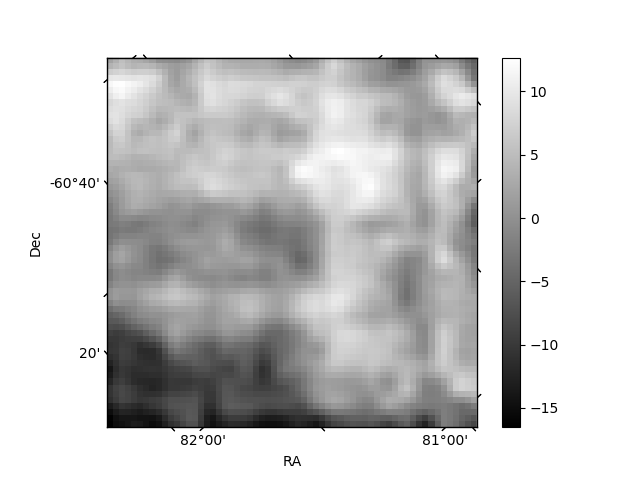
Histogram calculated using DETX and DETY for each event in the final _common_clean file
| Quadrant A | 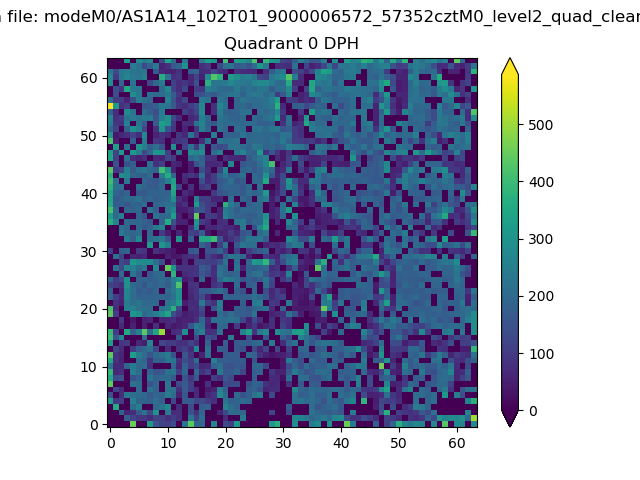 |
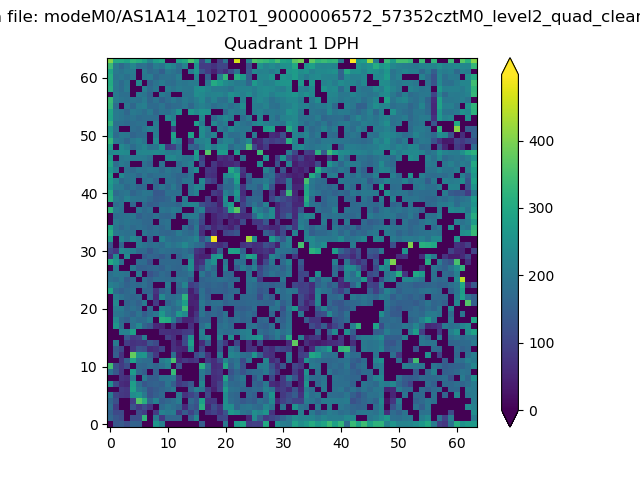 |
Quadrant B |
|---|---|---|---|
| Quadrant D | 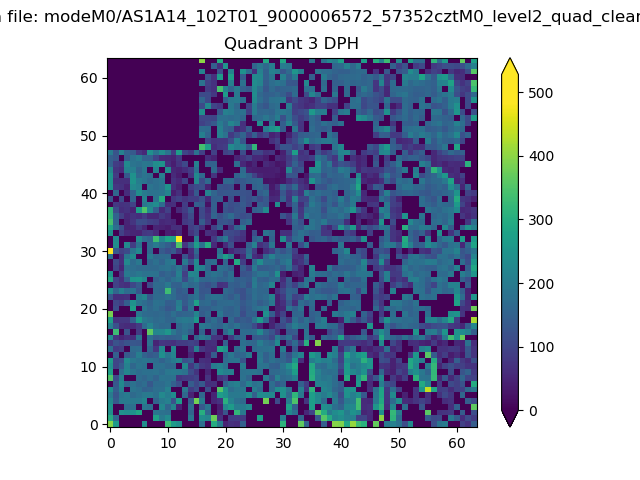 |
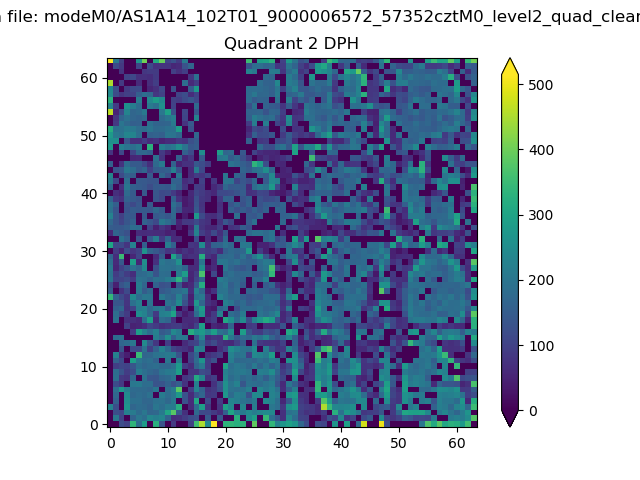 |
Quadrant C |
| Plot type | Count rate plots | Images |
|---|---|---|
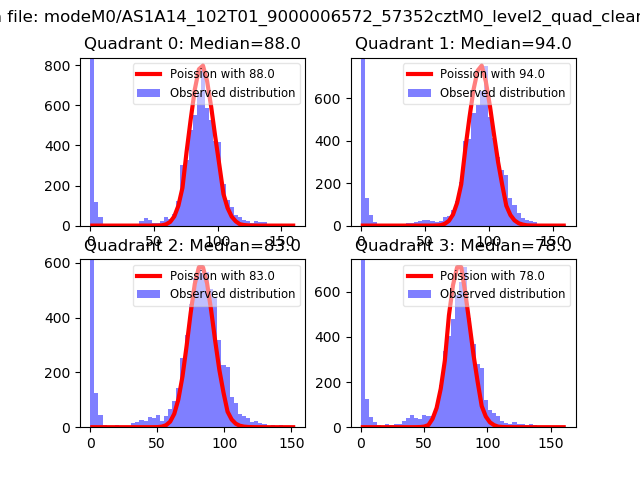
| Comparison with Poisson distribution Blue bars denote a histogram of data divided into 1 sec bins. Red curve is a Poisson curve with rate = median count rate of data. |
 |
 |
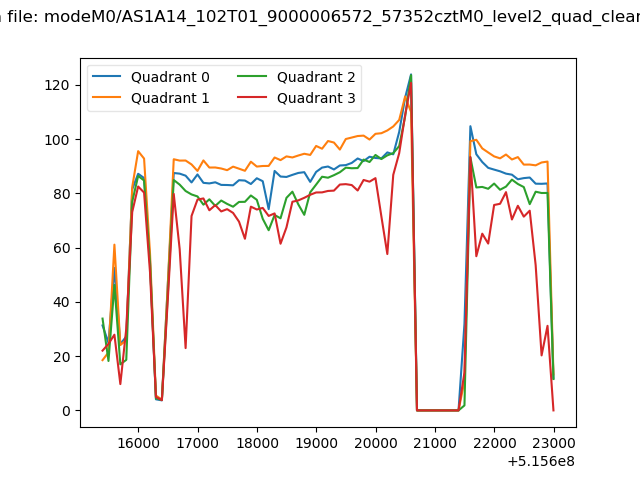
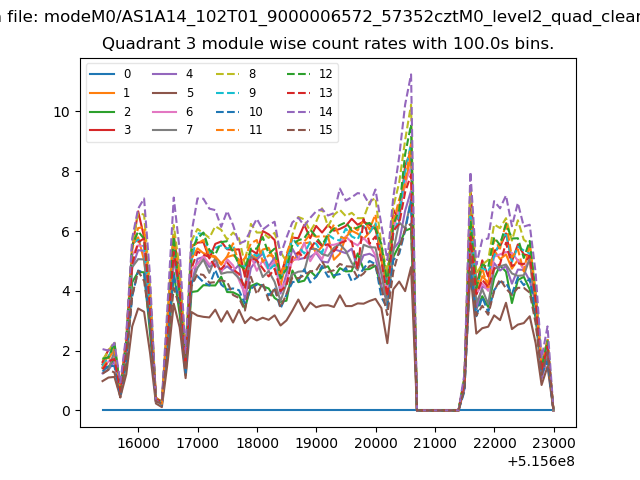
| Quadrant-wise count rates Data is divided into 100 sec bins |
 |
|
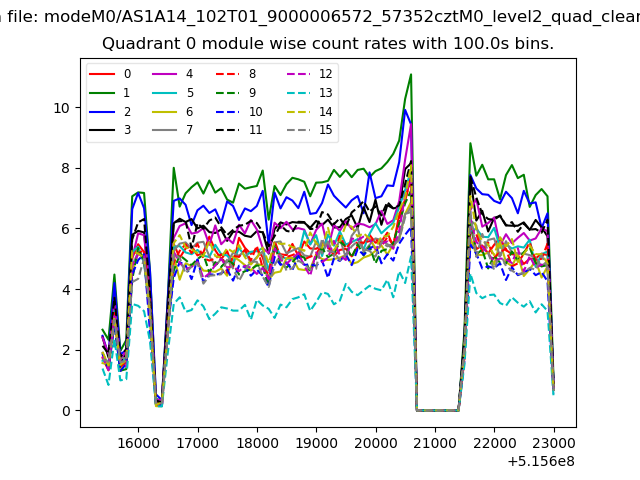
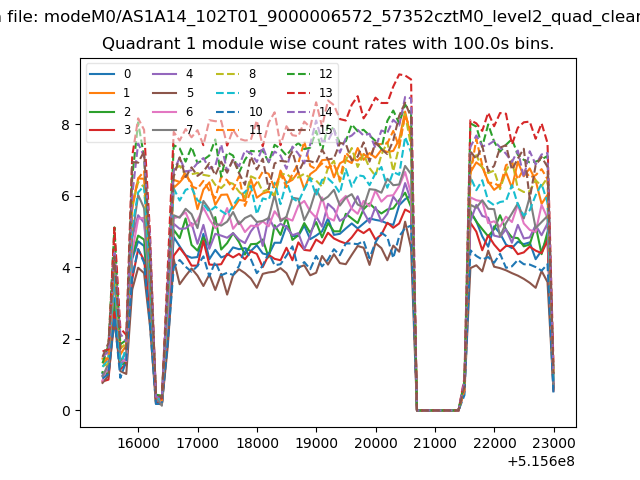
| Module-wise count rates for Quadrant A Data is divided into 100 sec bins |
 |
 |
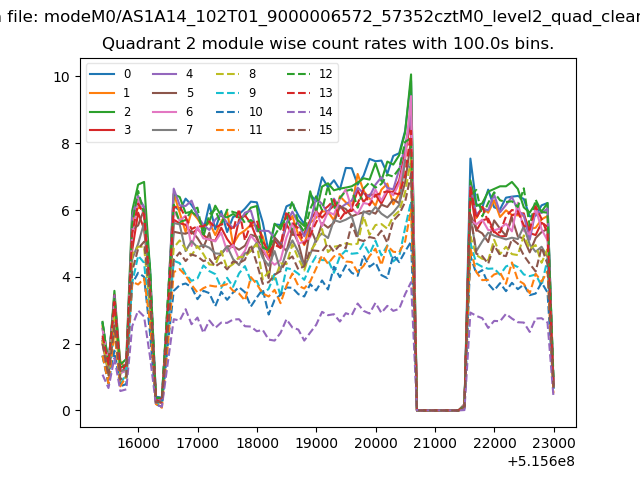
| Module-wise count rates for Quadrant B Data is divided into 100 sec bins |
 |
 |
| Module-wise count rates for Quadrant C Data is divided into 100 sec bins |
 |
 |
| Module-wise count rates for Quadrant D Data is divided into 100 sec bins |
 |
 |
| Parameter | Plot |
|---|---|
| CZT HV Monitor | 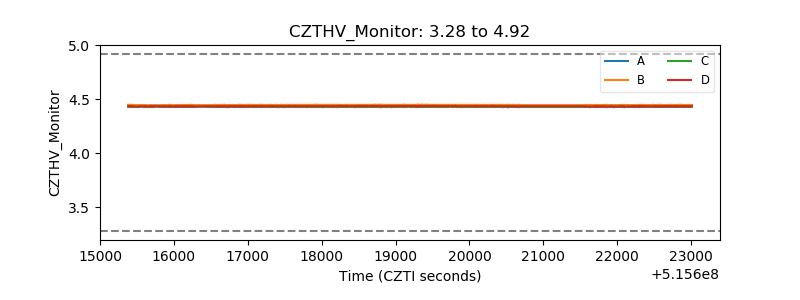 |
| D_VDD | 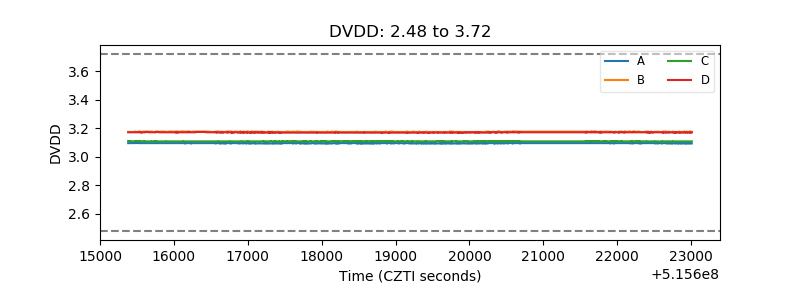 |
| Temperature 1 | 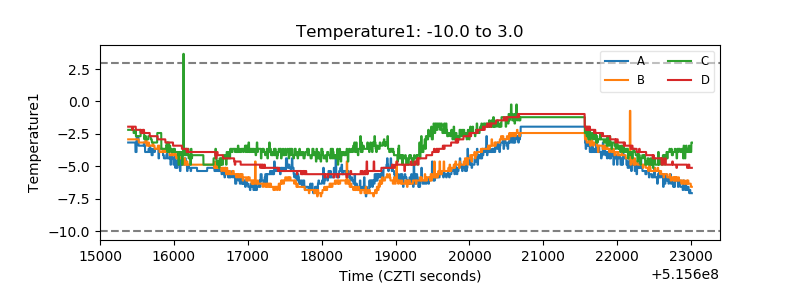 |
| Veto HV Monitor | 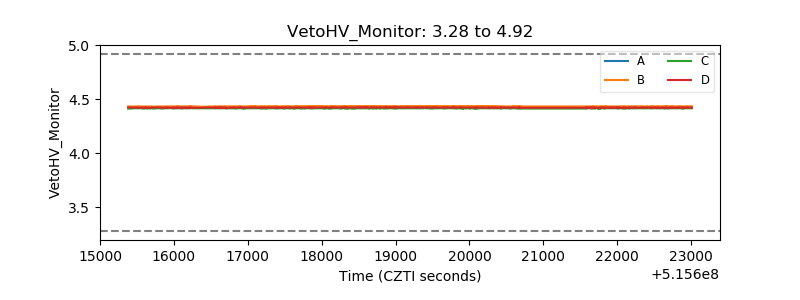 |
| Veto LLD | 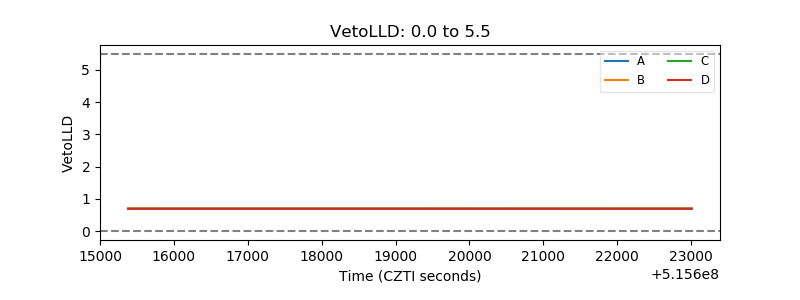 |
| Alpha Counter |  |
| _CPM_Rate | 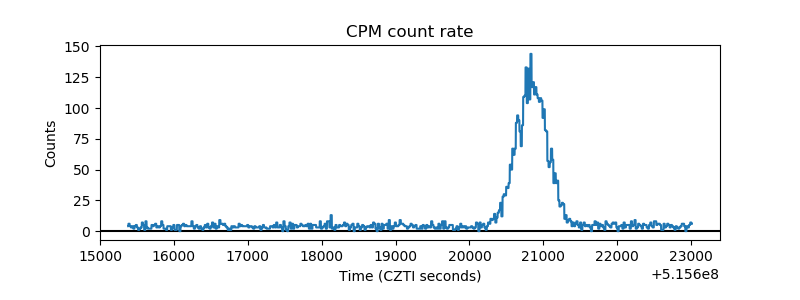 |
| CZT Counter | 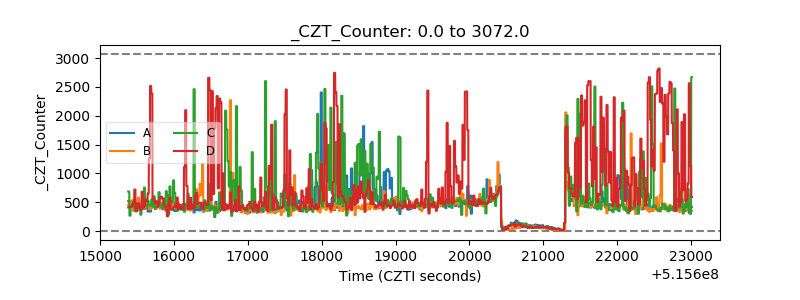 |
| +2.5 Volts monitor |  |
| +5 Volts monitor |  |
| _ROLL_ROT | 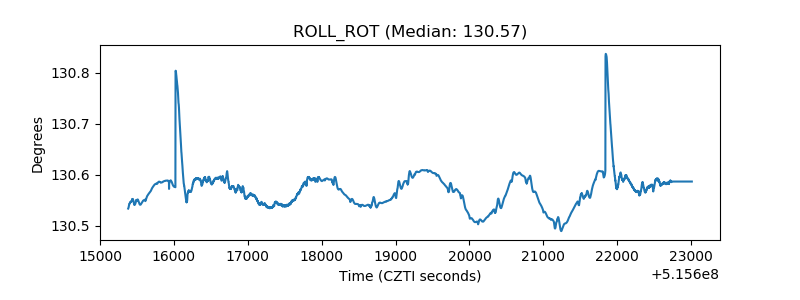 |
| _Roll_DEC | 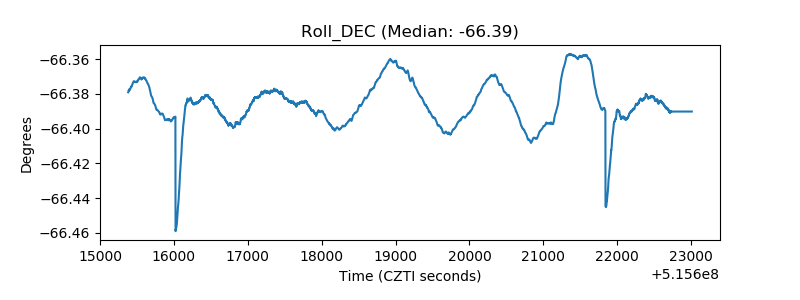 |
| _Roll_RA | 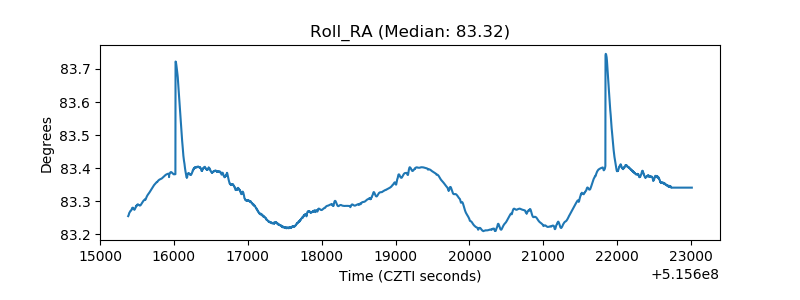 |
| Veto Counter | 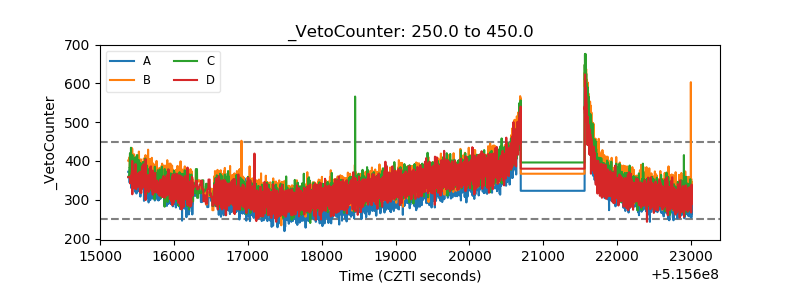 |