| Param | Original file | Final file |
|---|---|---|
| Filename | modeM0/AS1A14_102T01_9000006572_57353cztM0_level2.fits | modeM0/AS1A14_102T01_9000006572_57353cztM0_level2_quad_clean.evt |
| Size (bytes) | 504,478,080 | 95,258,880 |
| Size | 481.1 MB | 90.8 MB |
| Events in quadrant A | 3,640,991 | 635,046 |
| Events in quadrant B | 3,898,927 | 646,609 |
| Events in quadrant C | 4,445,676 | 576,353 |
| Events in quadrant D | 6,126,030 | 522,070 |
| Mode M0 | |||
|---|---|---|---|
| Quadrant | BADHDUFLAG | Total packets | Discarded packets |
| A | 0 | 16269 | 3 |
| B | 0 | 16778 | 3 |
| C | 0 | 18534 | 3 |
| D | 0 | 23309 | 3 |
| Mode M9 | |||
|---|---|---|---|
| Quadrant | BADHDUFLAG | Total packets | Discarded packets |
| A | 0 | 5 | 0 |
| B | 0 | 5 | 0 |
| C | 0 | 5 | 0 |
| D | 0 | 5 | 0 |
| Mode SS | |||
|---|---|---|---|
| Quadrant | BADHDUFLAG | Total packets | Discarded packets |
| A | 0 | 146 | 0 |
| B | 0 | 146 | 0 |
| C | 0 | 146 | 0 |
| D | 0 | 146 | 0 |
| Quadrant | Total seconds | Saturated seconds | Saturation percentage |
|---|---|---|---|
| A | 7240 | 40 | 0.552486% |
| B | 7240 | 280 | 3.867403% |
| C | 7240 | 272 | 3.756906% |
| D | 7240 | 773 | 10.676796% |
Noise dominated data is calculated using 1-second bins in cleaned event files. If a bin has >2000 counts, and if more than 50% of those come from <1% of pixels, then it is considered to be noise-dominated and hence unusable.
| Quadrant | # 1 sec bins | Bins with >0 counts | Bins with >2000 counts | High rate bins dominated by noise | Noise dominated (total time) | Noise dominated (detector-on time) | Marked lightcurve |
|---|---|---|---|---|---|---|---|
| A | 8025 | 7517 | 15 | 15 | 0.19% | 0.20% | 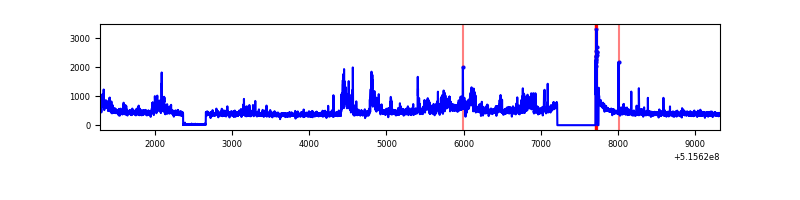 |
| B | 8025 | 7517 | 110 | 110 | 1.37% | 1.46% | 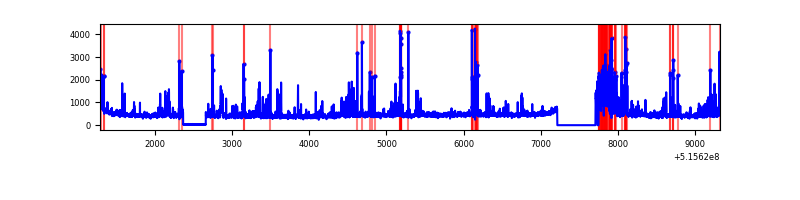 |
| C | 8025 | 7517 | 228 | 228 | 2.84% | 3.03% | 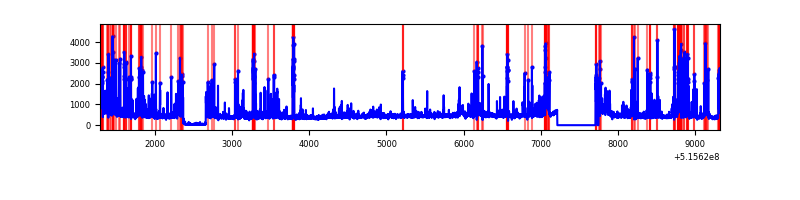 |
| D | 8025 | 7517 | 687 | 687 | 8.56% | 9.14% | 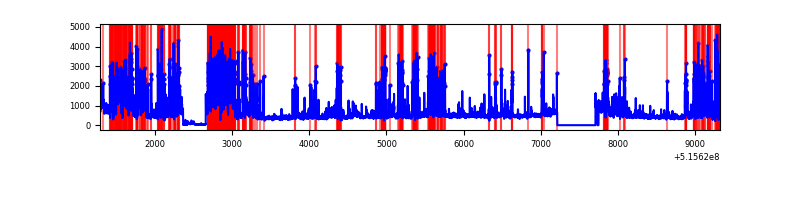 |
Top three noisy pixels from each quadrant. If the there are fewer than three noisy pixels in the level2.evt file, extra rows are filled as -1
| Pixel properties | Quadrant properties | ||||||
|---|---|---|---|---|---|---|---|
| Quadrant | DetID | PixID | Counts | Sigma | Mean | Median | Sigma |
| A | 3 | 14 | 466954 | 2405.99 | 782 | 763 | 193.8 |
| A | 4 | 95 | 57021 | 290.35 | 782 | 763 | 193.8 |
| A | 0 | 12 | 47364 | 240.51 | 782 | 763 | 193.8 |
| B | 5 | 185 | 565643 | 3360.57 | 765 | 737 | 168.1 |
| B | 7 | 252 | 95925 | 566.26 | 765 | 737 | 168.1 |
| B | 1 | 223 | 40742 | 237.99 | 765 | 737 | 168.1 |
| C | 15 | 224 | 812346 | 4016.76 | 740 | 731 | 202.1 |
| C | 12 | 252 | 232880 | 1148.93 | 740 | 731 | 202.1 |
| C | 13 | 3 | 178965 | 882.1 | 740 | 731 | 202.1 |
| D | 8 | 240 | 2625987 | 12719.98 | 719 | 684 | 206.4 |
| D | 2 | 249 | 437837 | 2118.07 | 719 | 684 | 206.4 |
| D | 8 | 48 | 49875 | 238.34 | 719 | 684 | 206.4 |
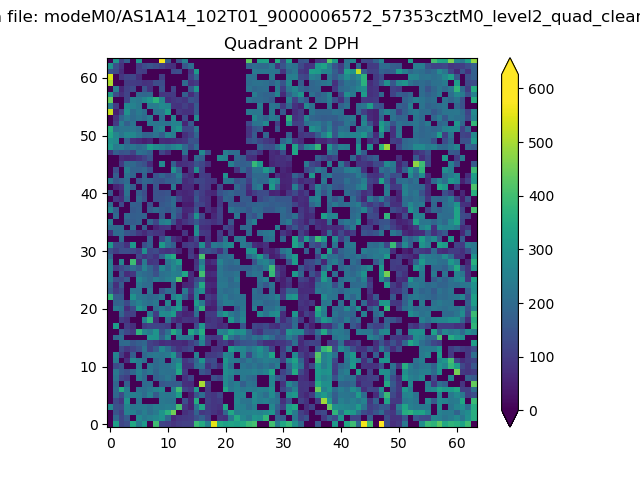
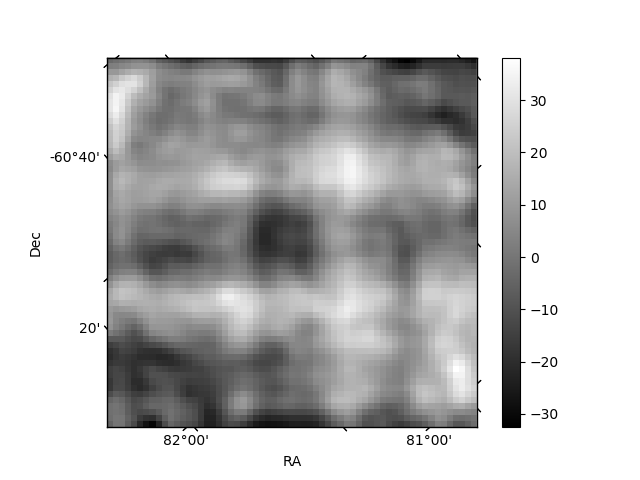
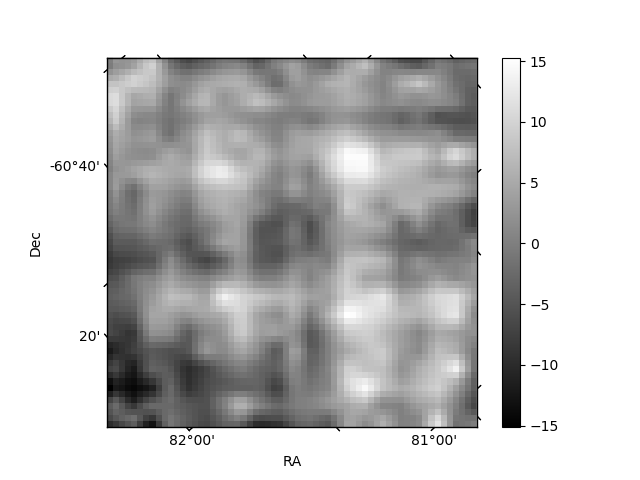
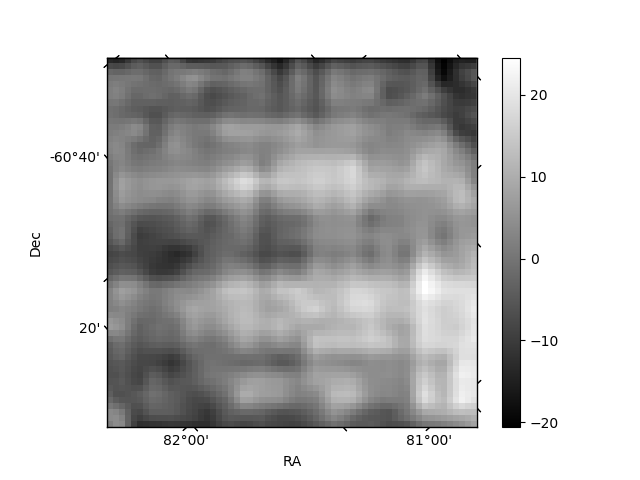
Histogram calculated using DETX and DETY for each event in the final _common_clean file
| Quadrant A | 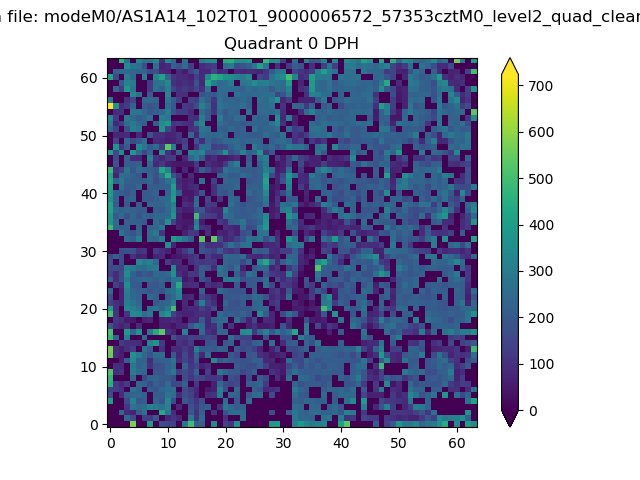 |
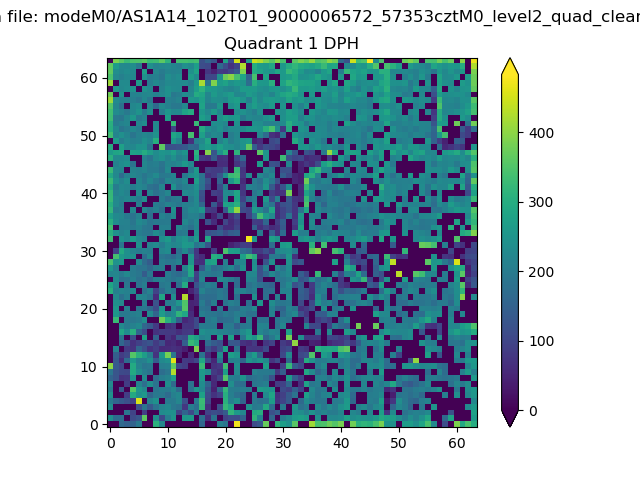 |
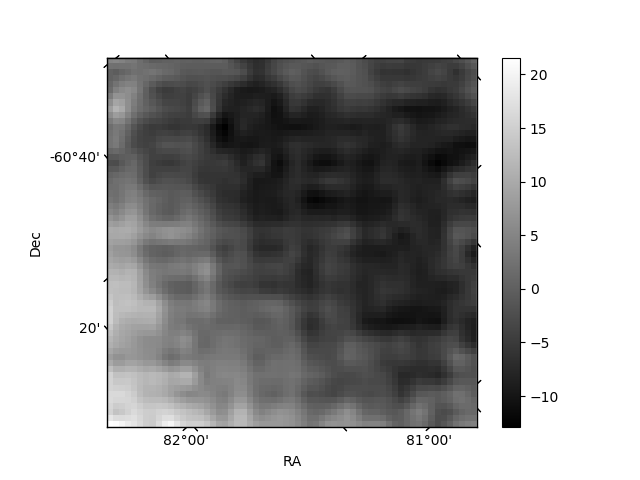
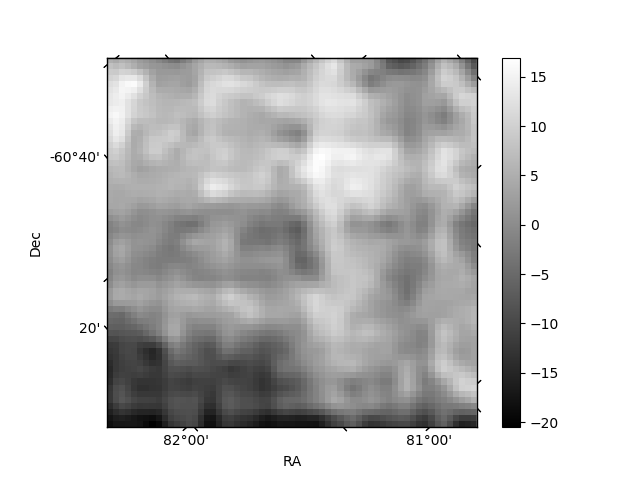
Quadrant B |
|---|---|---|---|
| Quadrant D | 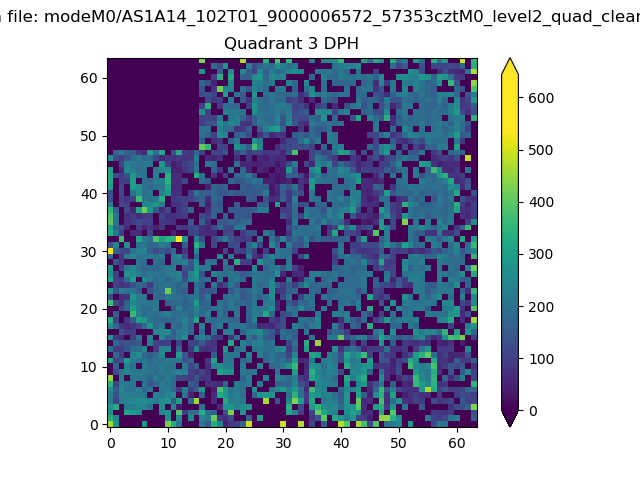 |
 |
Quadrant C |
| Plot type | Count rate plots | Images |
|---|---|---|
| Comparison with Poisson distribution Blue bars denote a histogram of data divided into 1 sec bins. Red curve is a Poisson curve with rate = median count rate of data. |
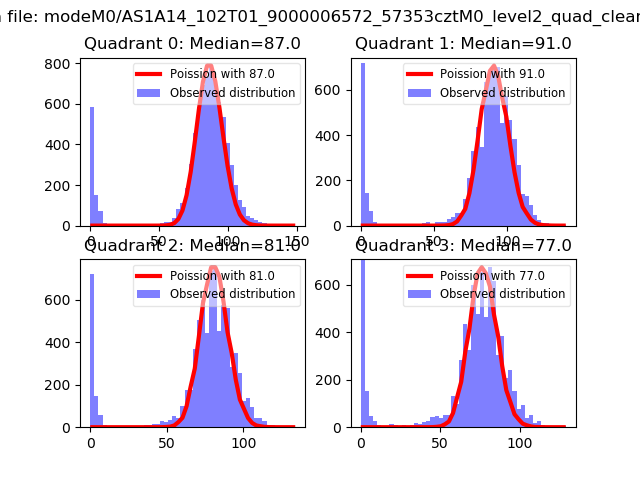 |
 |
| Quadrant-wise count rates Data is divided into 100 sec bins |
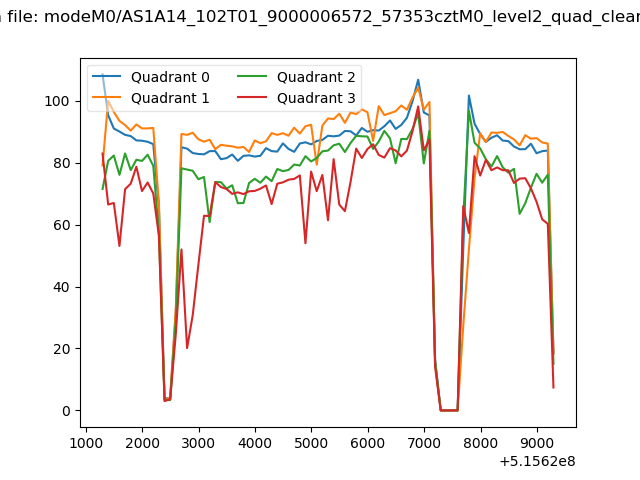 |
|
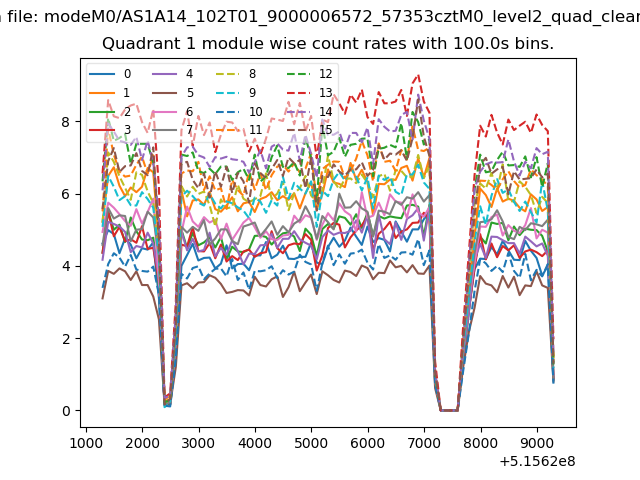
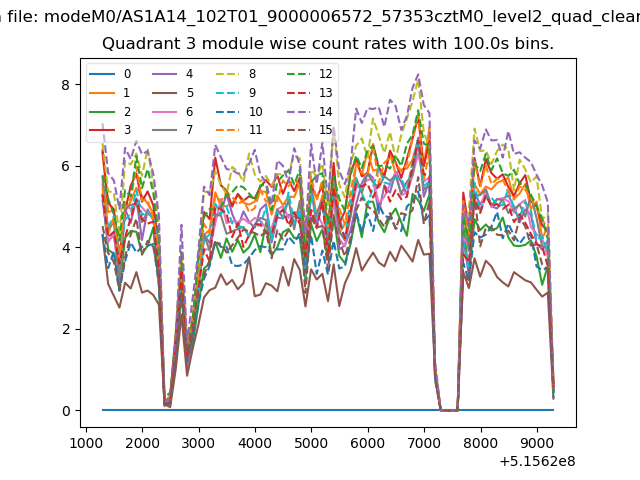
| Module-wise count rates for Quadrant A Data is divided into 100 sec bins |
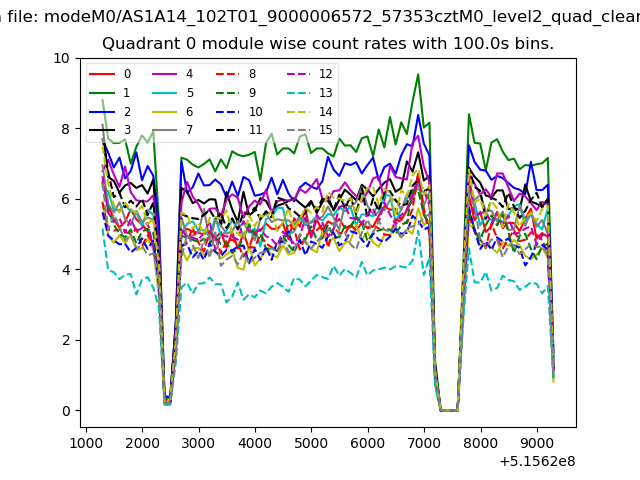 |
 |
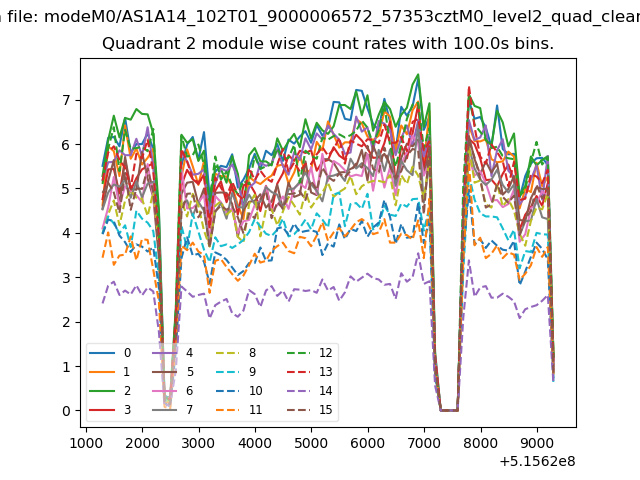
| Module-wise count rates for Quadrant B Data is divided into 100 sec bins |
 |
 |
| Module-wise count rates for Quadrant C Data is divided into 100 sec bins |
 |
 |
| Module-wise count rates for Quadrant D Data is divided into 100 sec bins |
 |
 |
| Parameter | Plot |
|---|---|
| CZT HV Monitor | 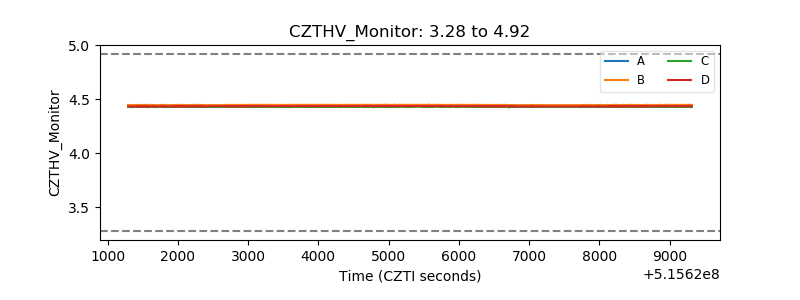 |
| D_VDD | 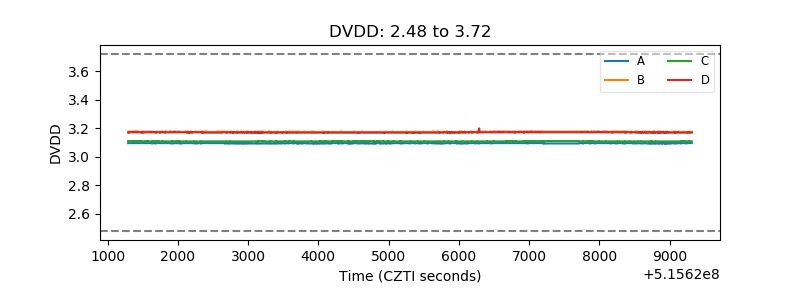 |
| Temperature 1 | 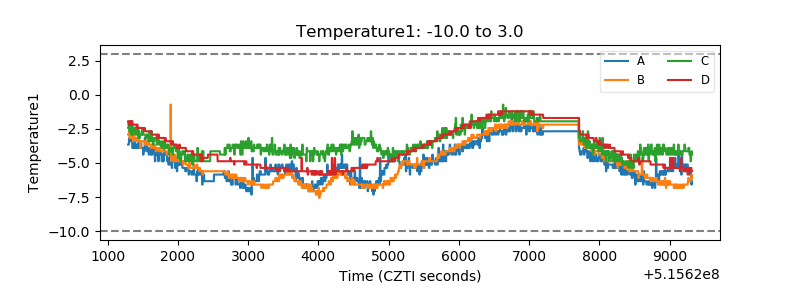 |
| Veto HV Monitor | 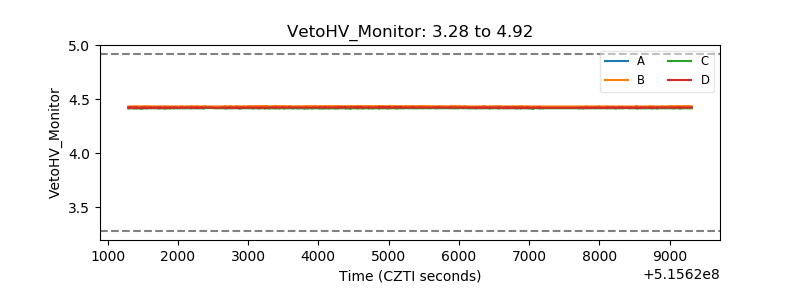 |
| Veto LLD | 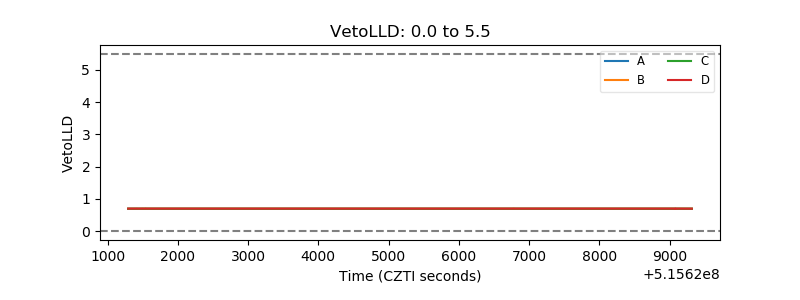 |
| Alpha Counter | 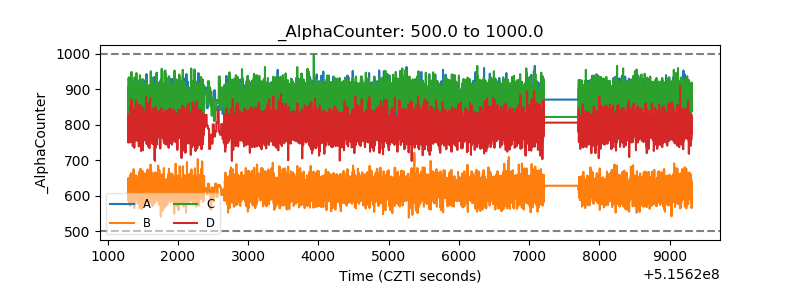 |
| _CPM_Rate | 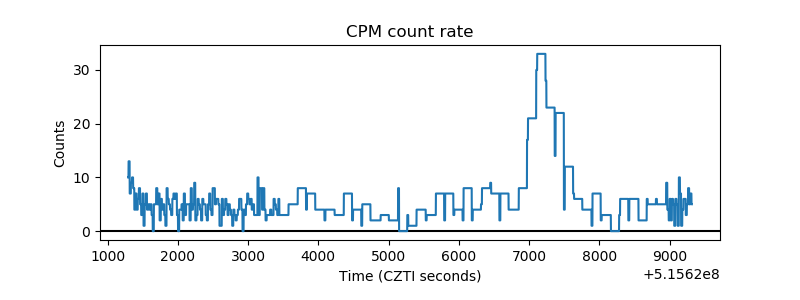 |
| CZT Counter | 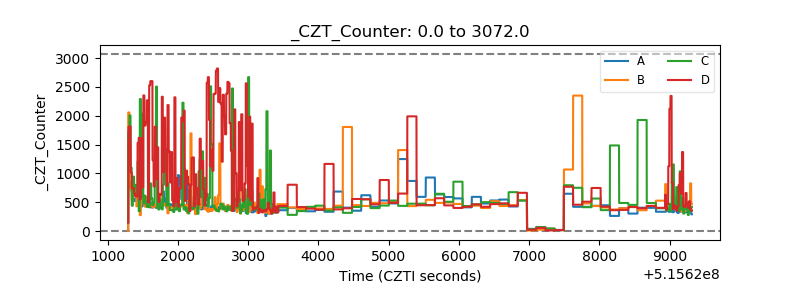 |
| +2.5 Volts monitor | 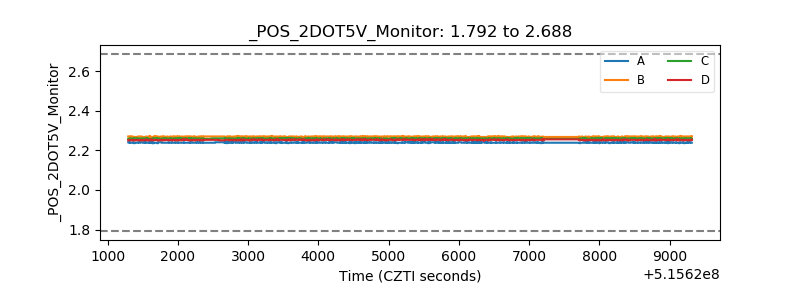 |
| +5 Volts monitor | 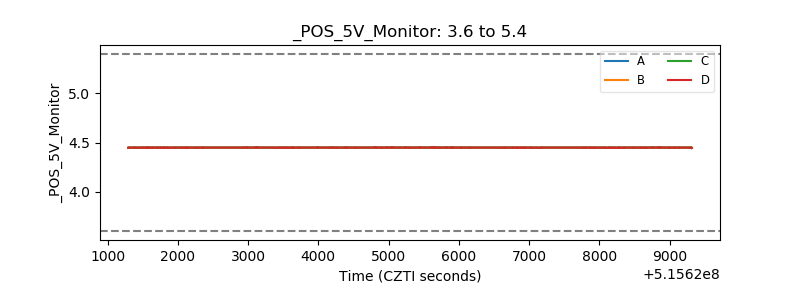 |
| _ROLL_ROT | 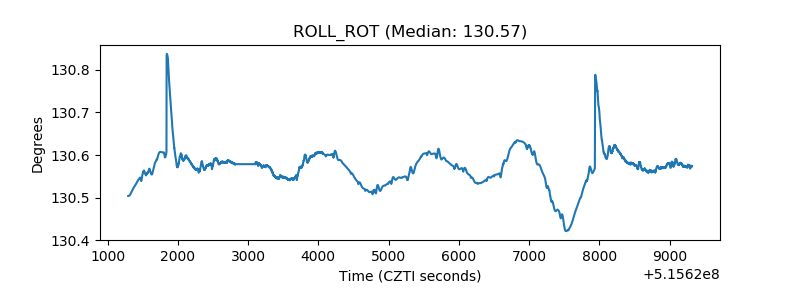 |
| _Roll_DEC | 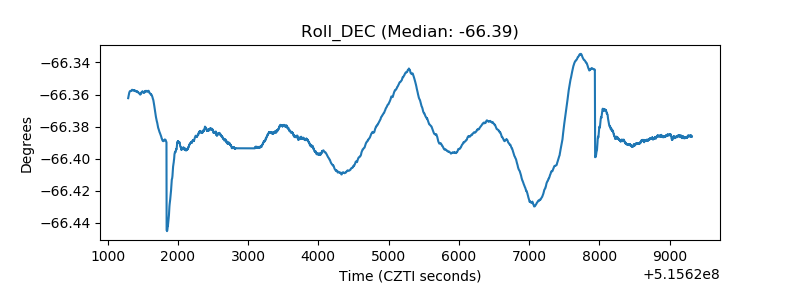 |
| _Roll_RA | 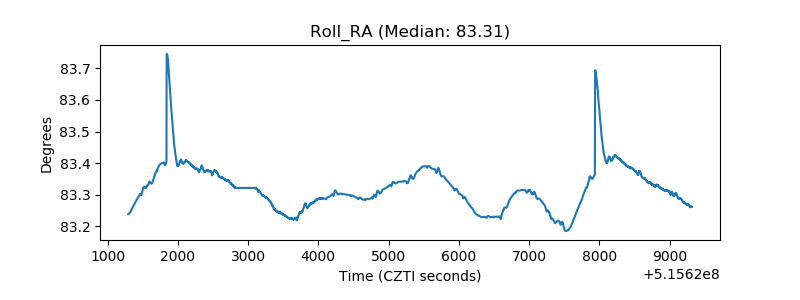 |
| Veto Counter | 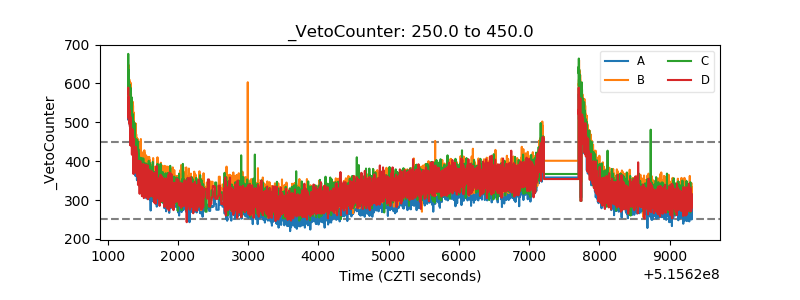 |