| Param | Original file | Final file |
|---|---|---|
| Filename | modeM0/AS1A14_102T01_9000006572_57354cztM0_level2.fits | modeM0/AS1A14_102T01_9000006572_57354cztM0_level2_quad_clean.evt |
| Size (bytes) | 520,695,360 | 101,839,680 |
| Size | 496.6 MB | 97.1 MB |
| Events in quadrant A | 3,553,606 | 673,073 |
| Events in quadrant B | 4,316,293 | 711,485 |
| Events in quadrant C | 5,401,449 | 592,632 |
| Events in quadrant D | 5,394,509 | 561,203 |
| Mode M0 | |||
|---|---|---|---|
| Quadrant | BADHDUFLAG | Total packets | Discarded packets |
| A | 0 | 16491 | 2 |
| B | 0 | 18466 | 2 |
| C | 0 | 21758 | 2 |
| D | 0 | 21480 | 2 |
| Mode M9 | |||
|---|---|---|---|
| Quadrant | BADHDUFLAG | Total packets | Discarded packets |
| A | 1 | 139966466824232 | 139964394242094 |
| B | 1 | -1 | -1 |
| C | 1 | -1 | -1 |
| D | 1 | -1 | -1 |
| Mode SS | |||
|---|---|---|---|
| Quadrant | BADHDUFLAG | Total packets | Discarded packets |
| A | 0 | 158 | 0 |
| B | 0 | 158 | 0 |
| C | 0 | 158 | 0 |
| D | 0 | 158 | 0 |
| Quadrant | Total seconds | Saturated seconds | Saturation percentage |
|---|---|---|---|
| A | 7832 | 43 | 0.549030% |
| B | 7832 | 240 | 3.064351% |
| C | 7832 | 518 | 6.613892% |
| D | 7832 | 451 | 5.758427% |
Noise dominated data is calculated using 1-second bins in cleaned event files. If a bin has >2000 counts, and if more than 50% of those come from <1% of pixels, then it is considered to be noise-dominated and hence unusable.
| Quadrant | # 1 sec bins | Bins with >0 counts | Bins with >2000 counts | High rate bins dominated by noise | Noise dominated (total time) | Noise dominated (detector-on time) | Marked lightcurve |
|---|---|---|---|---|---|---|---|
| A | 8120 | 8106 | 21 | 21 | 0.26% | 0.26% | 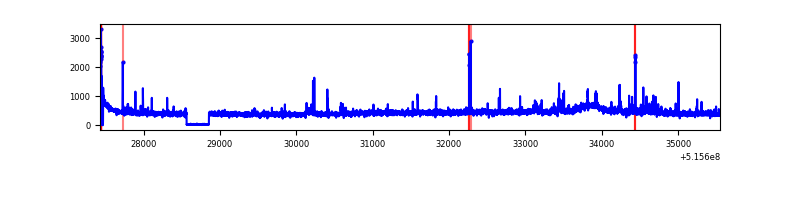 |
| B | 8120 | 8106 | 115 | 115 | 1.42% | 1.42% | 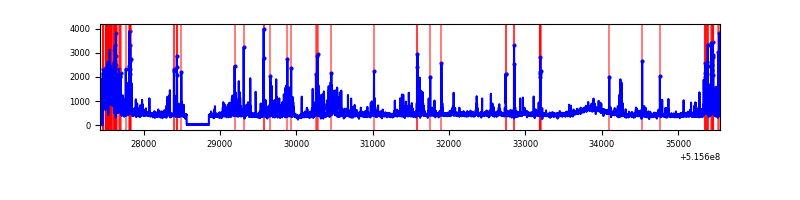 |
| C | 8120 | 8106 | 411 | 411 | 5.06% | 5.07% | 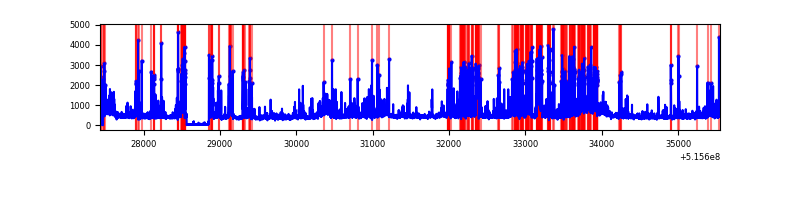 |
| D | 8120 | 8106 | 385 | 385 | 4.74% | 4.75% | 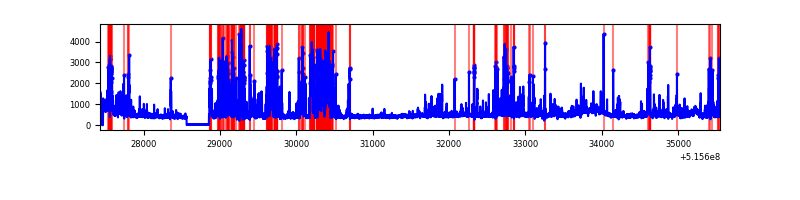 |
Top three noisy pixels from each quadrant. If the there are fewer than three noisy pixels in the level2.evt file, extra rows are filled as -1
| Pixel properties | Quadrant properties | ||||||
|---|---|---|---|---|---|---|---|
| Quadrant | DetID | PixID | Counts | Sigma | Mean | Median | Sigma |
| A | 12 | 3 | 67125 | 317.96 | 849 | 827 | 208.5 |
| A | 3 | 14 | 58917 | 278.6 | 849 | 827 | 208.5 |
| A | 0 | 12 | 52690 | 248.73 | 849 | 827 | 208.5 |
| B | 5 | 185 | 408333 | 2294.01 | 832 | 799 | 177.7 |
| B | 1 | 223 | 317810 | 1784.46 | 832 | 799 | 177.7 |
| B | 7 | 252 | 87484 | 487.95 | 832 | 799 | 177.7 |
| C | 15 | 224 | 1387942 | 6435.34 | 792 | 785 | 215.6 |
| C | 12 | 252 | 262519 | 1214.24 | 792 | 785 | 215.6 |
| C | 13 | 3 | 252714 | 1168.76 | 792 | 785 | 215.6 |
| D | 8 | 240 | 976023 | 4382.93 | 794 | 759 | 222.5 |
| D | 2 | 249 | 820290 | 3683.05 | 794 | 759 | 222.5 |
| D | 7 | 96 | 91675 | 408.58 | 794 | 759 | 222.5 |
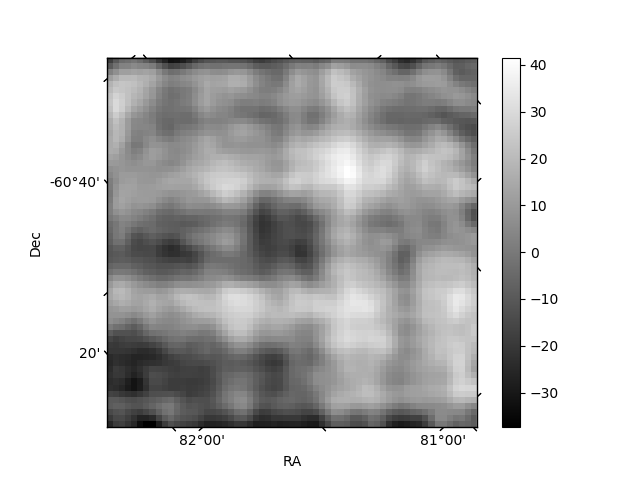
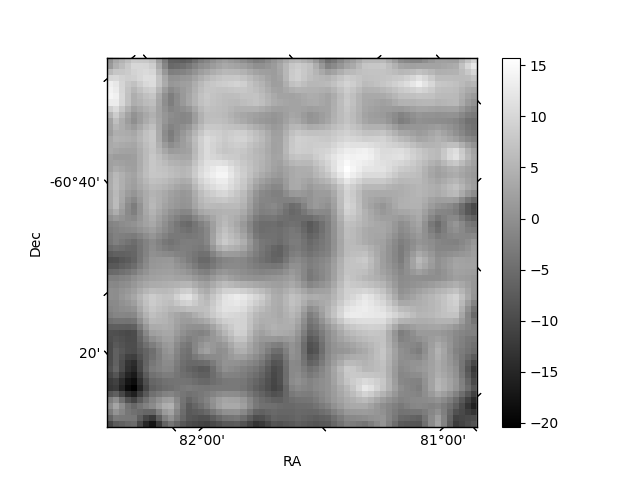
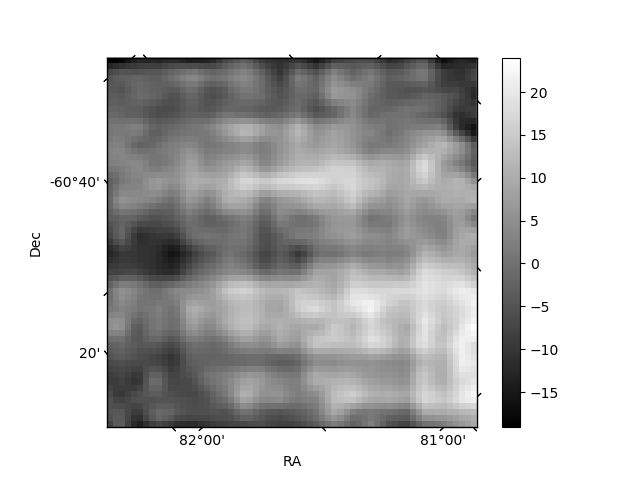
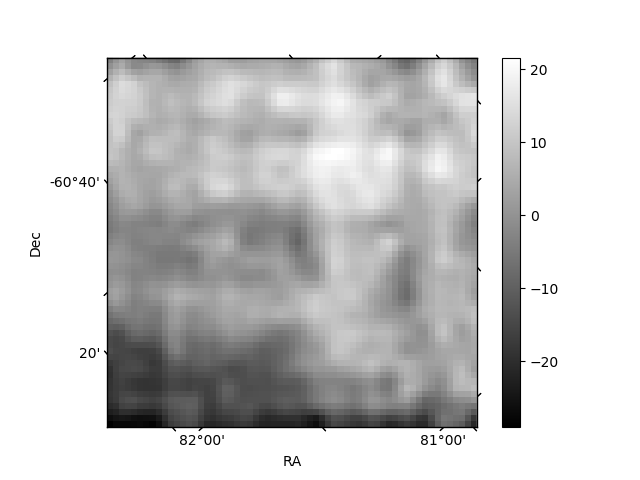
Histogram calculated using DETX and DETY for each event in the final _common_clean file
| Quadrant A | 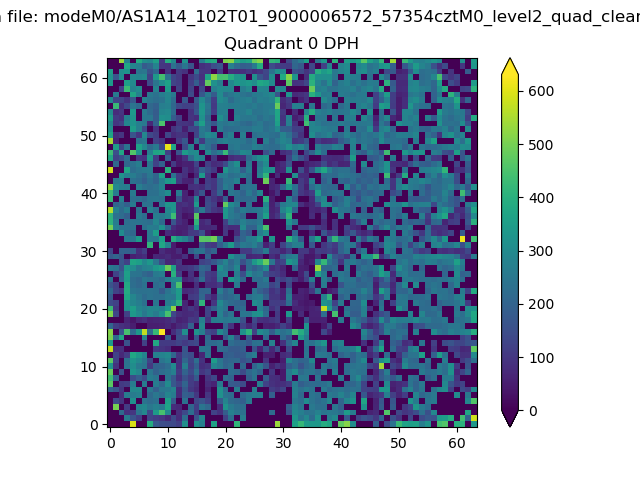 |
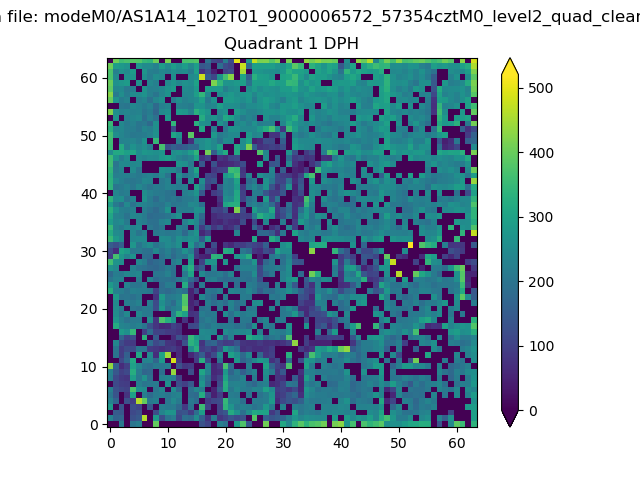 |
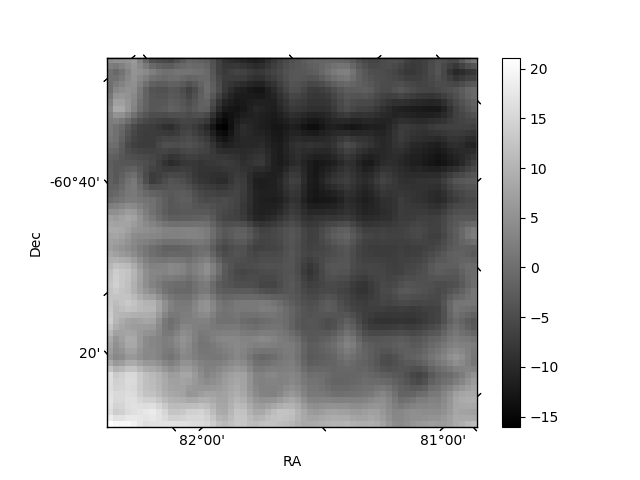
Quadrant B |
|---|---|---|---|
| Quadrant D | 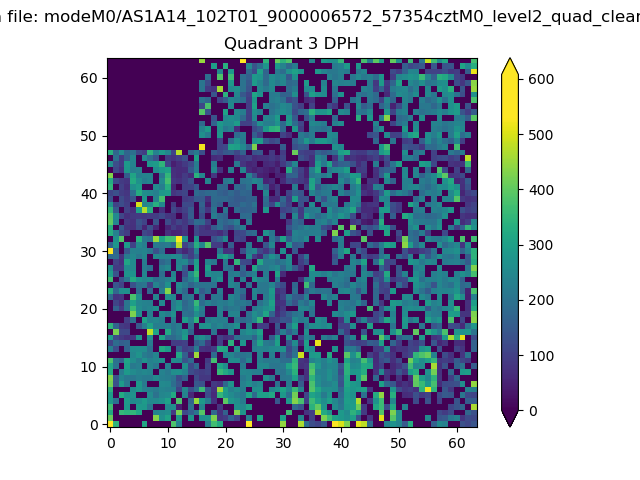 |
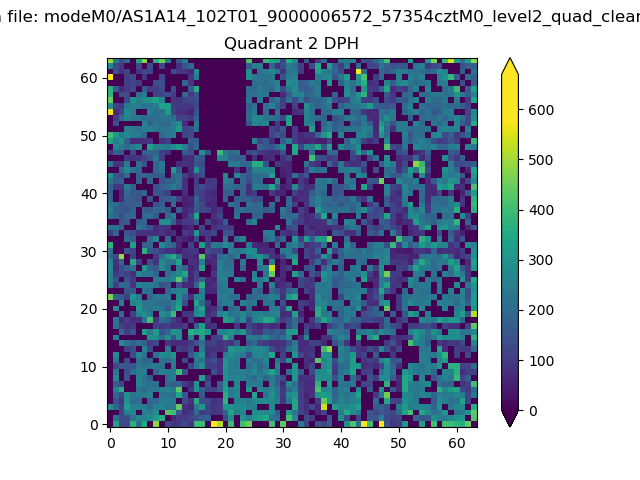 |
Quadrant C |
| Plot type | Count rate plots | Images |
|---|---|---|
| Comparison with Poisson distribution Blue bars denote a histogram of data divided into 1 sec bins. Red curve is a Poisson curve with rate = median count rate of data. |
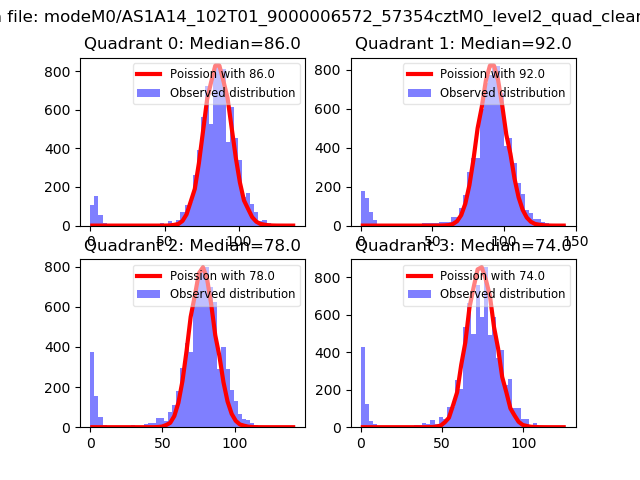 |
 |
| Quadrant-wise count rates Data is divided into 100 sec bins |
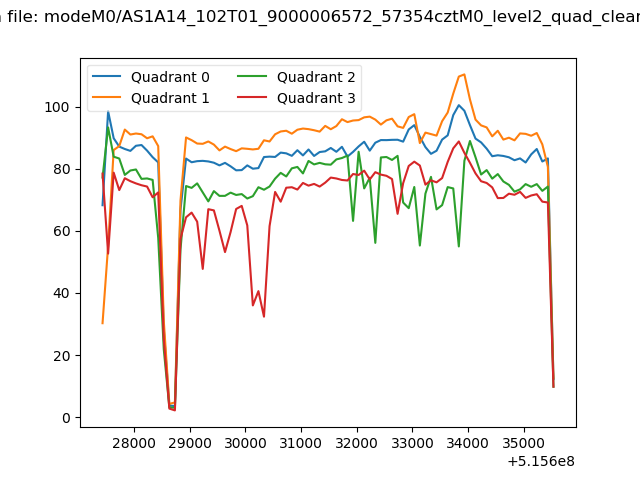 |
|
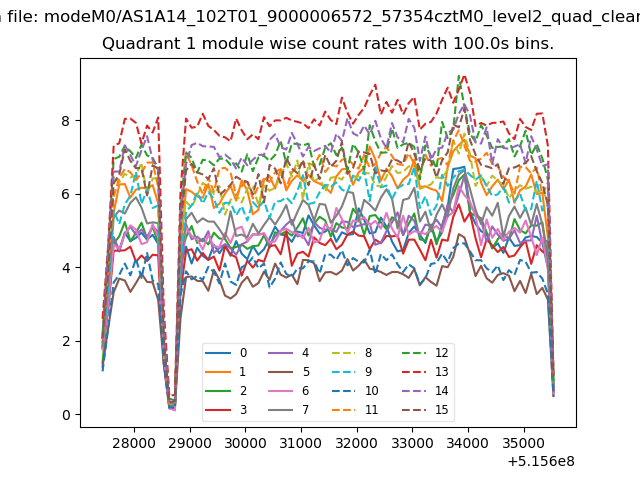
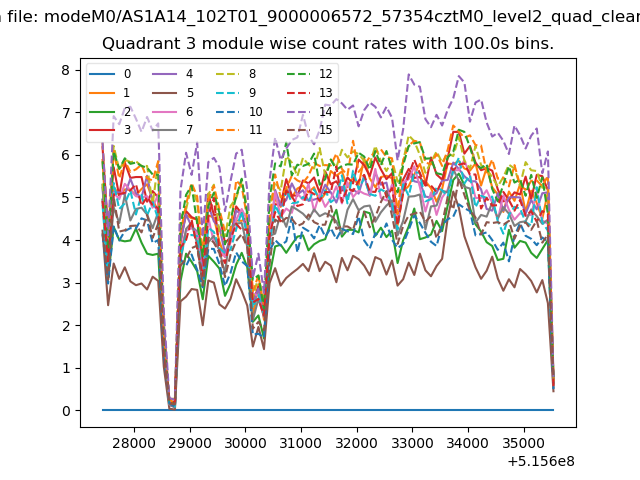
| Module-wise count rates for Quadrant A Data is divided into 100 sec bins |
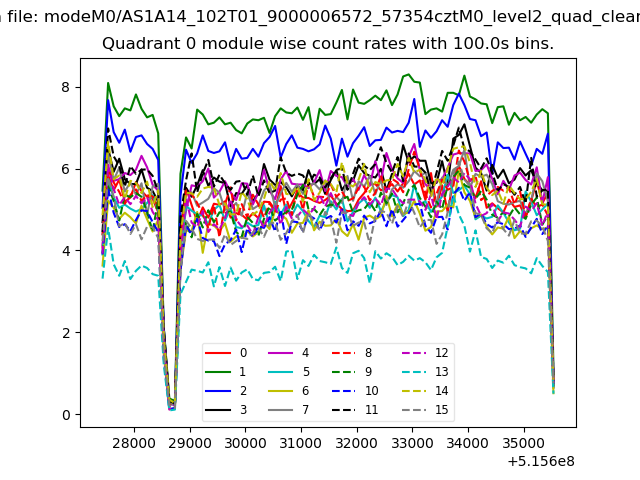 |
 |
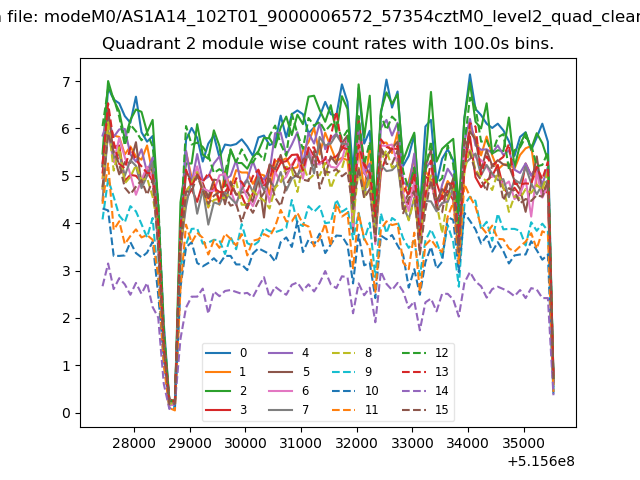
| Module-wise count rates for Quadrant B Data is divided into 100 sec bins |
 |
 |
| Module-wise count rates for Quadrant C Data is divided into 100 sec bins |
 |
 |
| Module-wise count rates for Quadrant D Data is divided into 100 sec bins |
 |
 |
| Parameter | Plot |
|---|---|
| CZT HV Monitor | 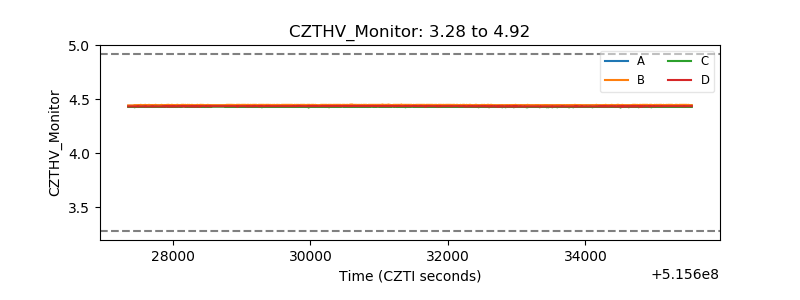 |
| D_VDD | 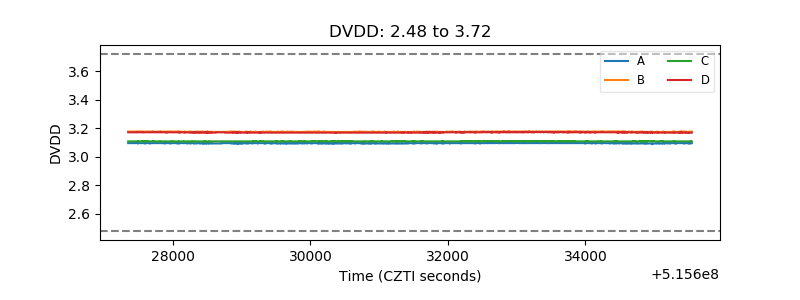 |
| Temperature 1 | 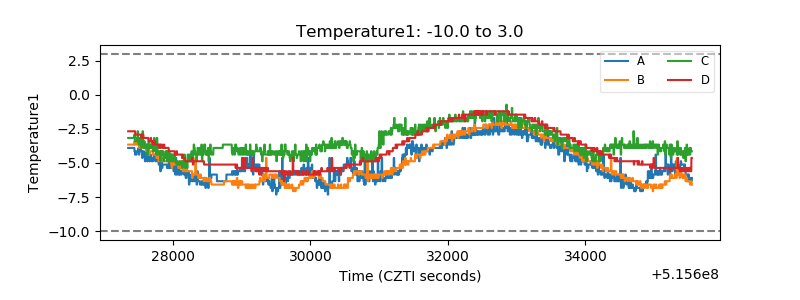 |
| Veto HV Monitor | 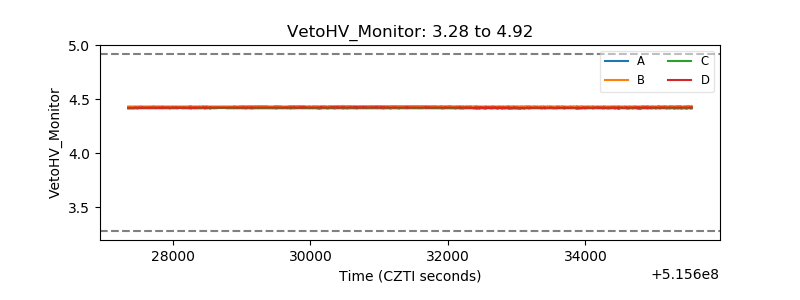 |
| Veto LLD | 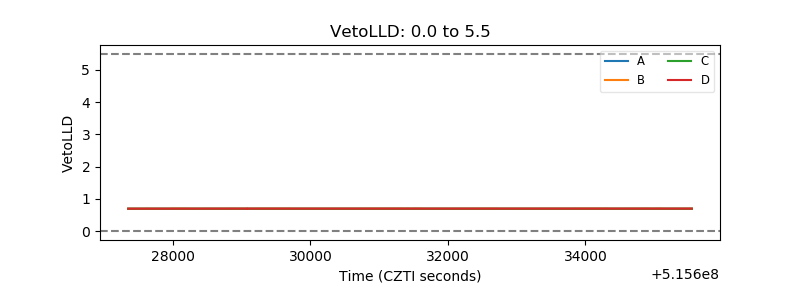 |
| Alpha Counter | 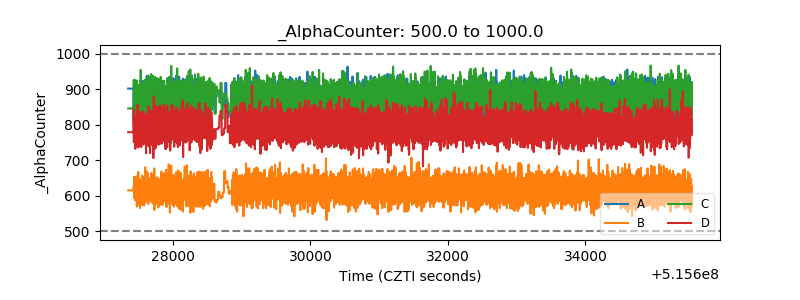 |
| _CPM_Rate | 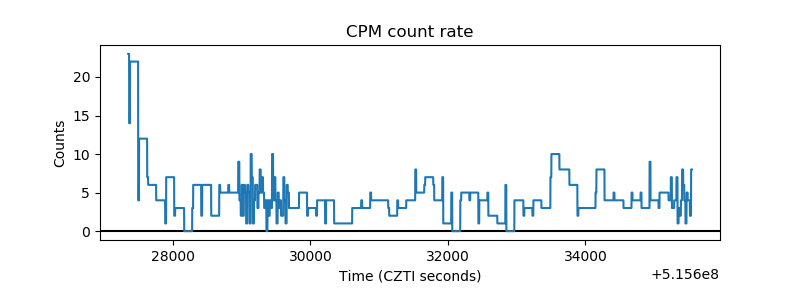 |
| CZT Counter | 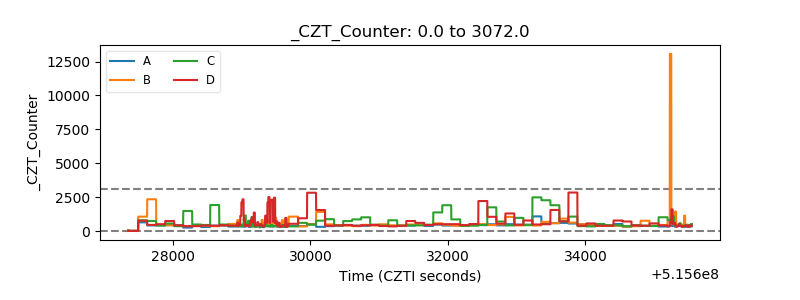 |
| +2.5 Volts monitor |  |
| +5 Volts monitor |  |
| _ROLL_ROT | 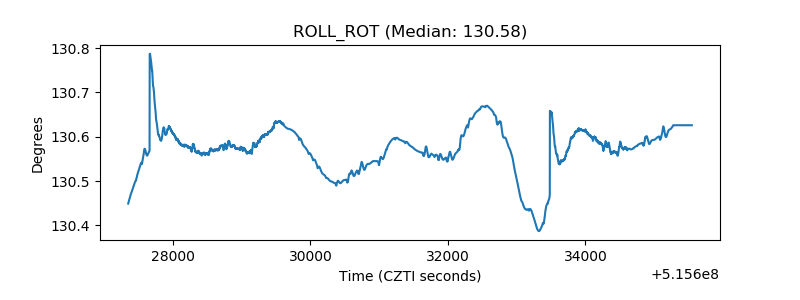 |
| _Roll_DEC | 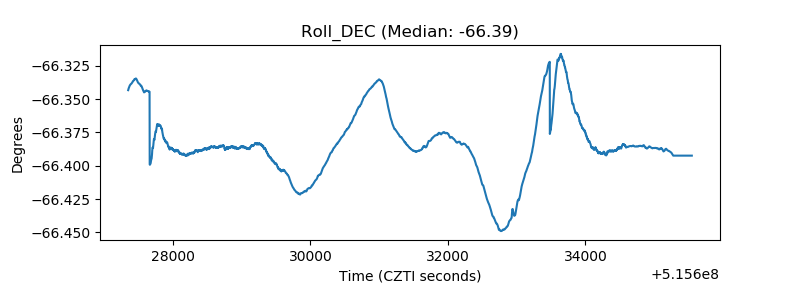 |
| _Roll_RA | 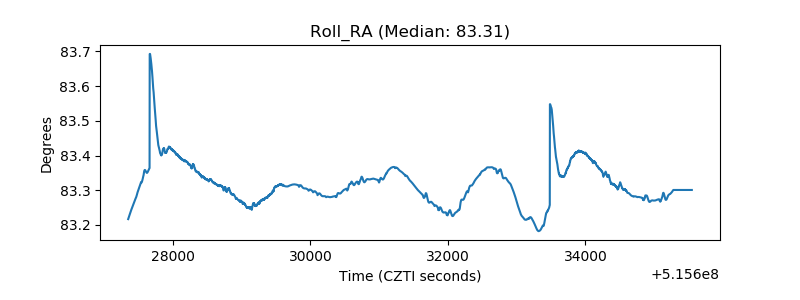 |
| Veto Counter | 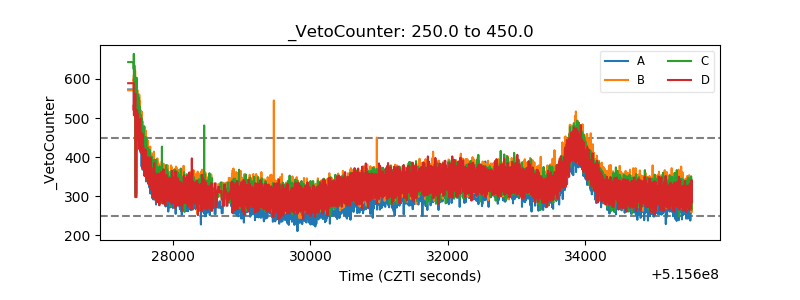 |