| Param | Original file | Final file |
|---|---|---|
| Filename | modeM0/AS1A14_102T01_9000006572_57355cztM0_level2.fits | modeM0/AS1A14_102T01_9000006572_57355cztM0_level2_quad_clean.evt |
| Size (bytes) | 2,185,902,720 | 436,250,880 |
| Size | 2.0 GB | 416.0 MB |
| Events in quadrant A | 14,850,167 | 2,954,931 |
| Events in quadrant B | 15,048,855 | 3,132,283 |
| Events in quadrant C | 23,788,491 | 2,580,517 |
| Events in quadrant D | 24,852,754 | 2,429,171 |
| Mode M0 | |||
|---|---|---|---|
| Quadrant | BADHDUFLAG | Total packets | Discarded packets |
| A | 0 | 67168 | 5 |
| B | 0 | 67072 | 5 |
| C | 0 | 92784 | 5 |
| D | 0 | 95387 | 5 |
| Mode M9 | |||
|---|---|---|---|
| Quadrant | BADHDUFLAG | Total packets | Discarded packets |
| A | 0 | 37 | 0 |
| B | 0 | 37 | 0 |
| C | 0 | 37 | 0 |
| D | 0 | 37 | 0 |
| Mode SS | |||
|---|---|---|---|
| Quadrant | BADHDUFLAG | Total packets | Discarded packets |
| A | 0 | 624 | 0 |
| B | 0 | 624 | 0 |
| C | 0 | 624 | 0 |
| D | 0 | 622 | 0 |
| Quadrant | Total seconds | Saturated seconds | Saturation percentage |
|---|---|---|---|
| A | 30716 | 207 | 0.673916% |
| B | 30717 | 502 | 1.634274% |
| C | 30718 | 2628 | 8.555244% |
| D | 30717 | 2946 | 9.590780% |
Noise dominated data is calculated using 1-second bins in cleaned event files. If a bin has >2000 counts, and if more than 50% of those come from <1% of pixels, then it is considered to be noise-dominated and hence unusable.
| Quadrant | # 1 sec bins | Bins with >0 counts | Bins with >2000 counts | High rate bins dominated by noise | Noise dominated (total time) | Noise dominated (detector-on time) | Marked lightcurve |
|---|---|---|---|---|---|---|---|
| A | 38124 | 30999 | 92 | 92 | 0.24% | 0.30% | 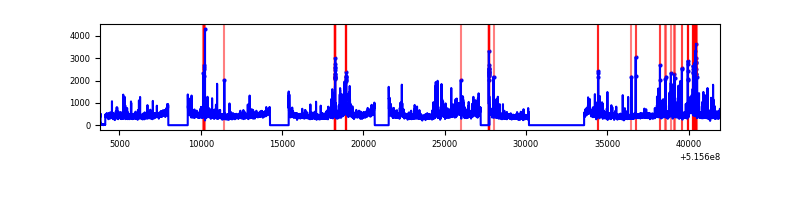 |
| B | 38125 | 31000 | 185 | 185 | 0.49% | 0.60% | 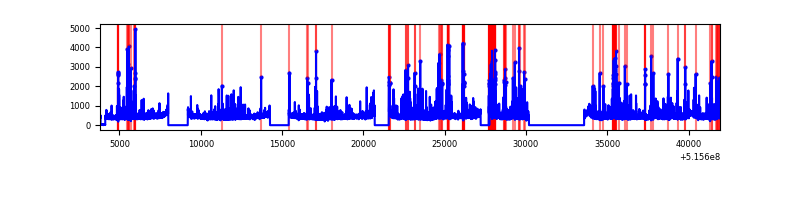 |
| C | 38125 | 31001 | 2122 | 2122 | 5.57% | 6.84% | 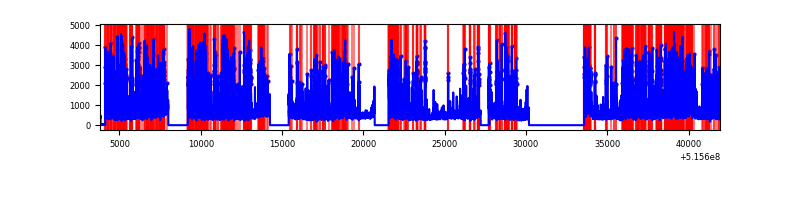 |
| D | 38124 | 31000 | 2646 | 2646 | 6.94% | 8.54% | 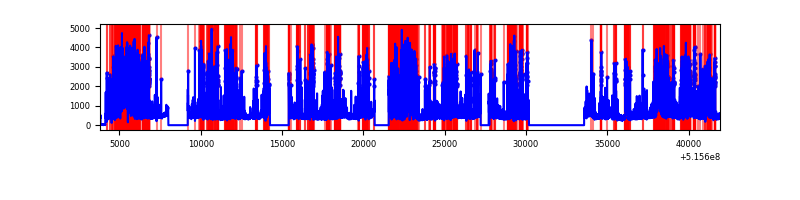 |
Top three noisy pixels from each quadrant. If the there are fewer than three noisy pixels in the level2.evt file, extra rows are filled as -1
| Pixel properties | Quadrant properties | ||||||
|---|---|---|---|---|---|---|---|
| Quadrant | DetID | PixID | Counts | Sigma | Mean | Median | Sigma |
| A | 3 | 14 | 907188 | 1106.24 | 3318 | 3236 | 817.1 |
| A | 12 | 3 | 422156 | 512.67 | 3318 | 3236 | 817.1 |
| A | 4 | 95 | 133768 | 159.74 | 3318 | 3236 | 817.1 |
| B | 5 | 185 | 991529 | 1414.66 | 3280 | 3155 | 698.7 |
| B | 7 | 252 | 273053 | 386.3 | 3280 | 3155 | 698.7 |
| B | 1 | 223 | 154559 | 216.7 | 3280 | 3155 | 698.7 |
| C | 15 | 224 | 9409859 | 11302.75 | 3072 | 3033 | 832.3 |
| C | 12 | 252 | 911025 | 1091.0 | 3072 | 3033 | 832.3 |
| C | 14 | 254 | 406681 | 485.0 | 3072 | 3033 | 832.3 |
| D | 8 | 240 | 6242892 | 7272.35 | 3060 | 2912 | 858.0 |
| D | 2 | 249 | 4652154 | 5418.44 | 3060 | 2912 | 858.0 |
| D | 7 | 96 | 701471 | 814.13 | 3060 | 2912 | 858.0 |
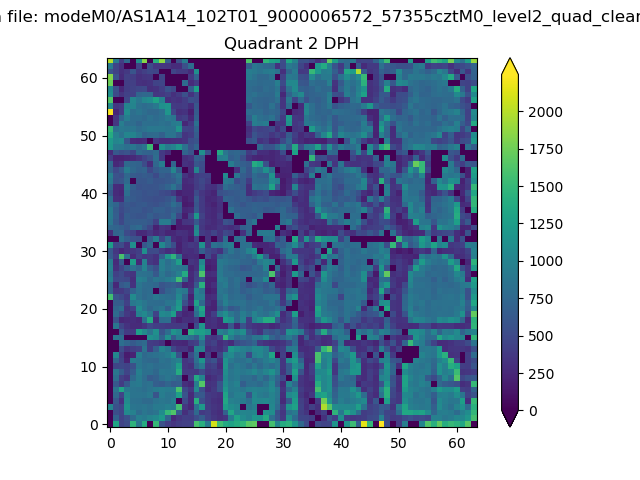
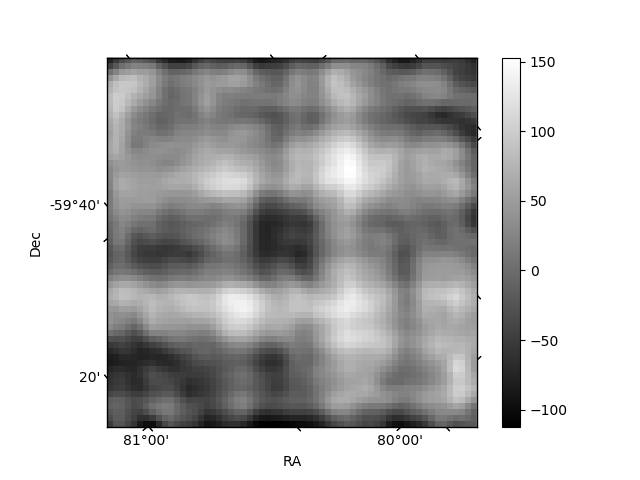
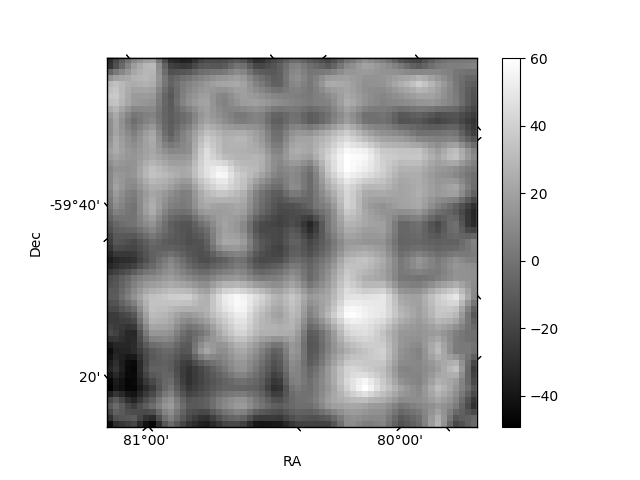
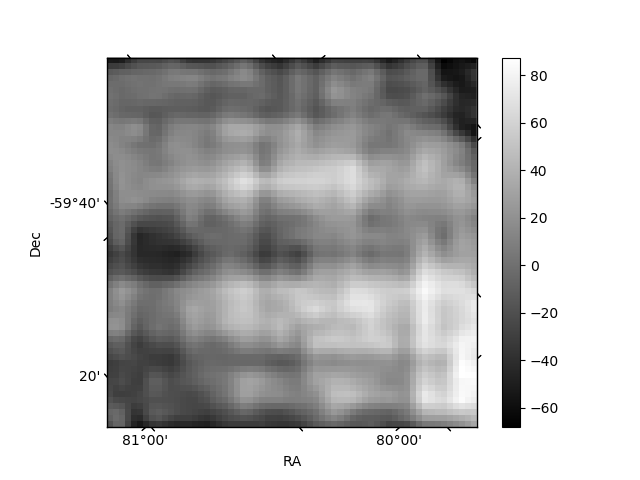
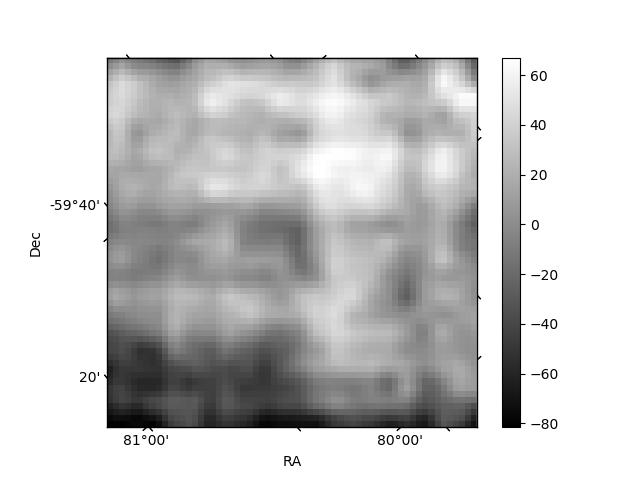
Histogram calculated using DETX and DETY for each event in the final _common_clean file
| Quadrant A | 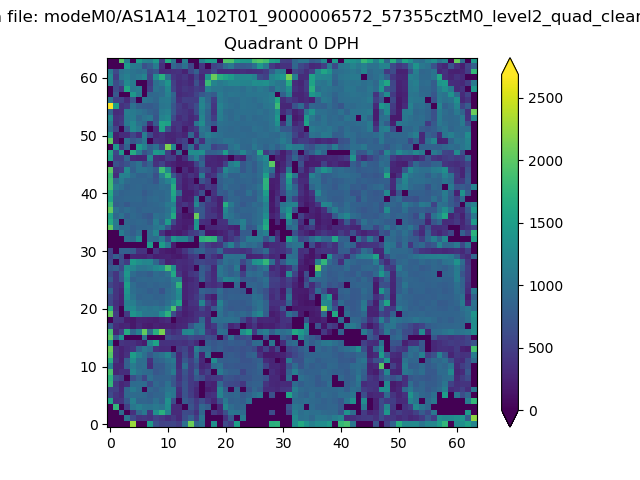 |
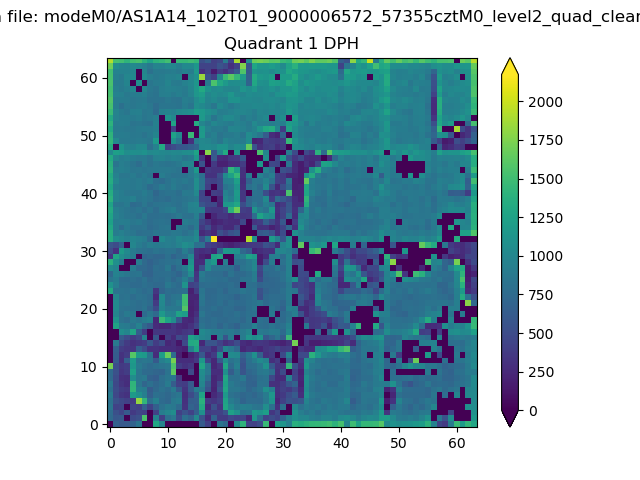 |
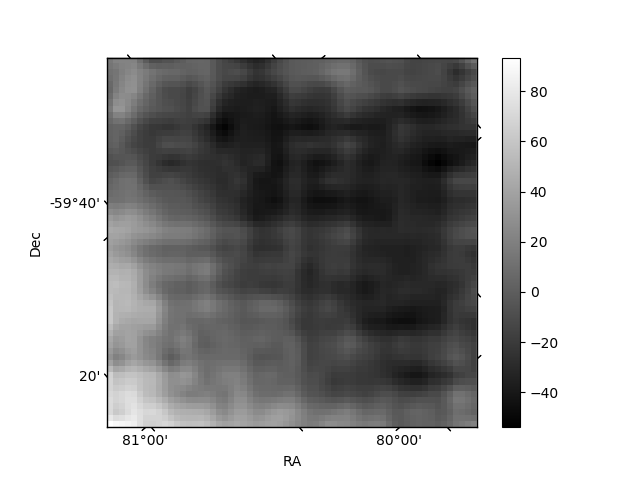
Quadrant B |
|---|---|---|---|
| Quadrant D | 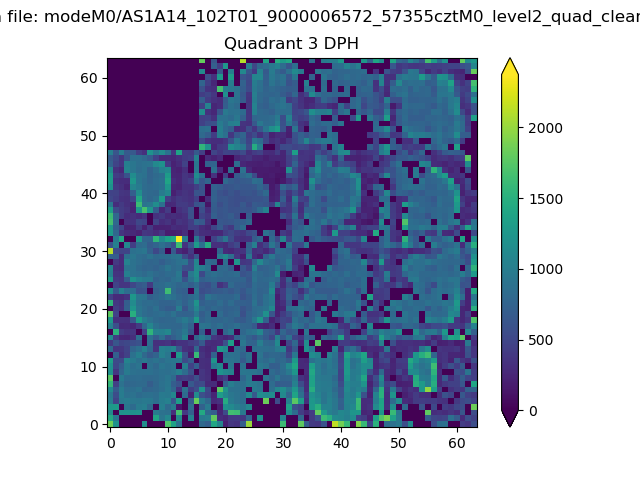 |
 |
Quadrant C |
| Plot type | Count rate plots | Images |
|---|---|---|
| Comparison with Poisson distribution Blue bars denote a histogram of data divided into 1 sec bins. Red curve is a Poisson curve with rate = median count rate of data. |
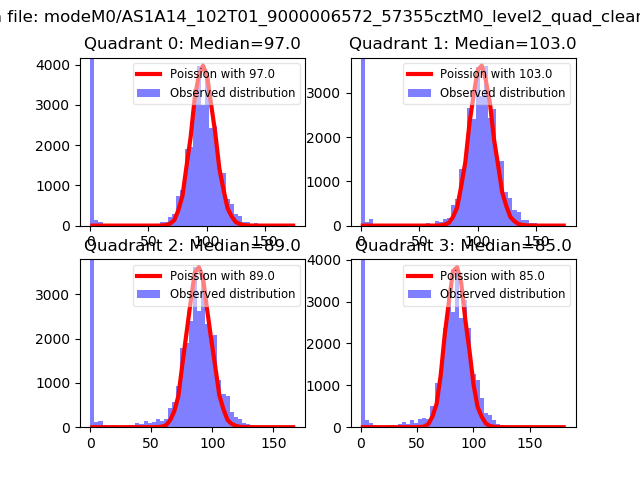 |
 |
| Quadrant-wise count rates Data is divided into 100 sec bins |
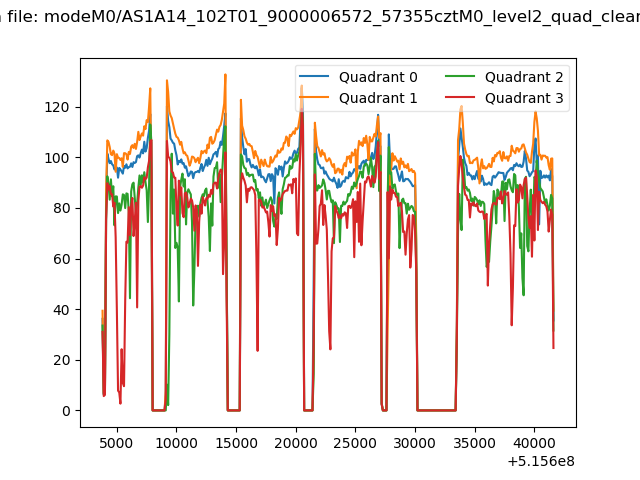 |
|
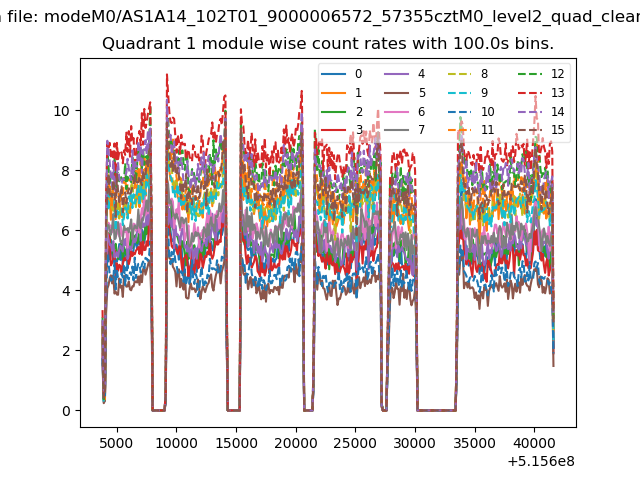
| Module-wise count rates for Quadrant A Data is divided into 100 sec bins |
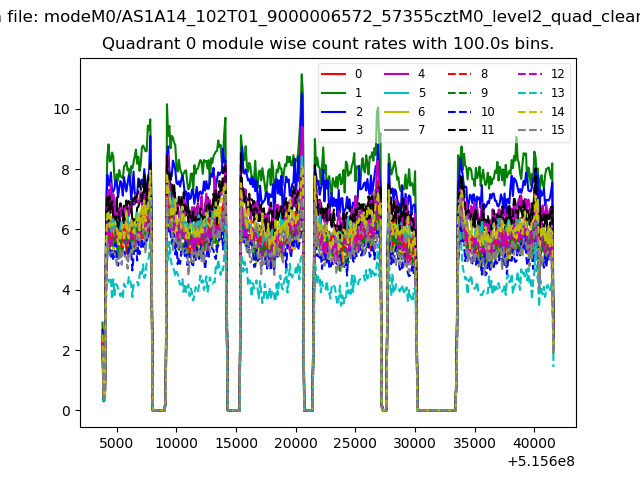 |
 |
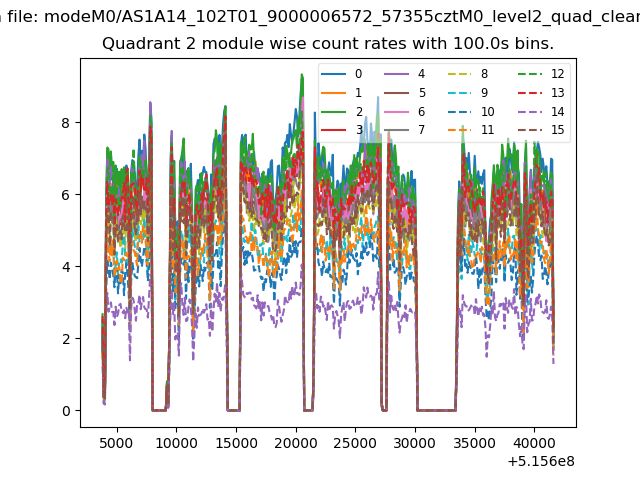
| Module-wise count rates for Quadrant B Data is divided into 100 sec bins |
 |
 |
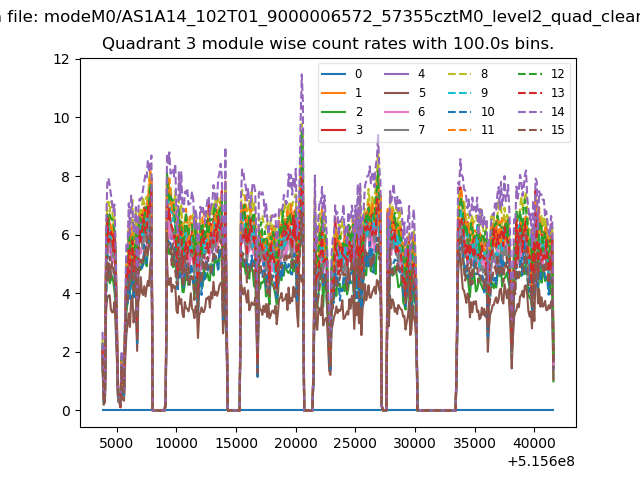
| Module-wise count rates for Quadrant C Data is divided into 100 sec bins |
 |
 |
| Module-wise count rates for Quadrant D Data is divided into 100 sec bins |
 |
 |
| Parameter | Plot |
|---|---|
| CZT HV Monitor | 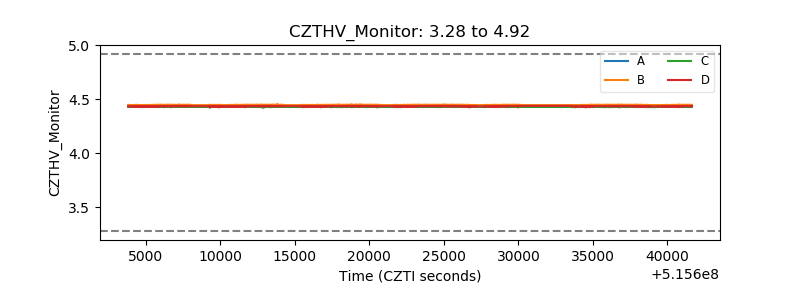 |
| D_VDD | 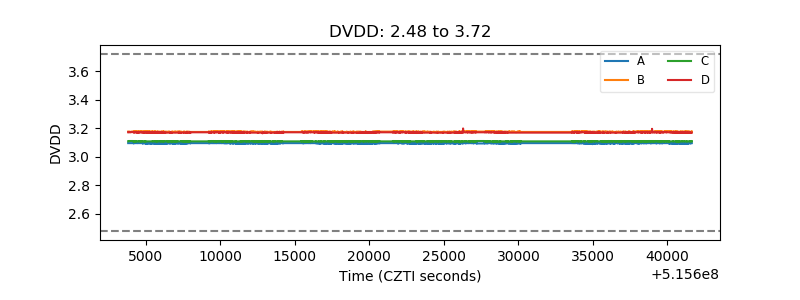 |
| Temperature 1 | 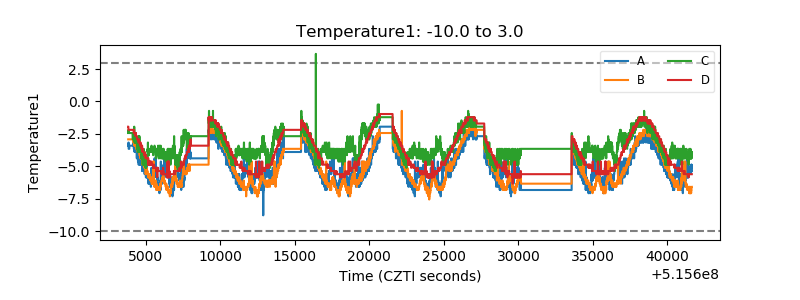 |
| Veto HV Monitor | 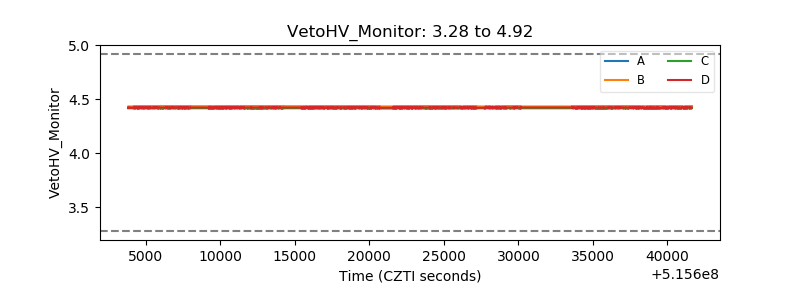 |
| Veto LLD | 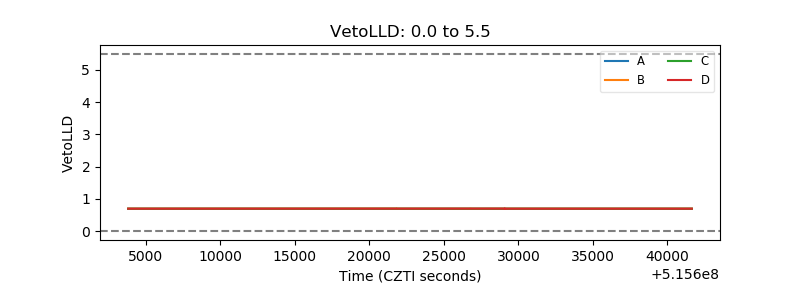 |
| Alpha Counter | 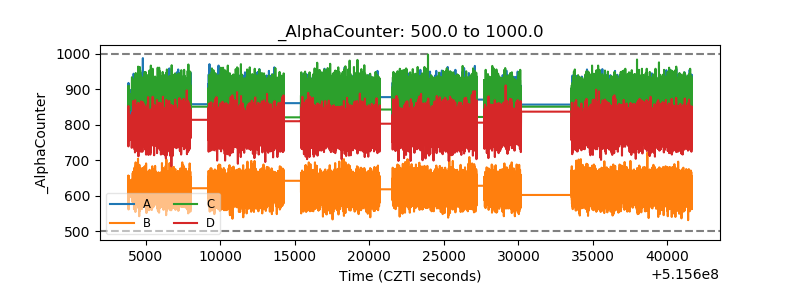 |
| _CPM_Rate | 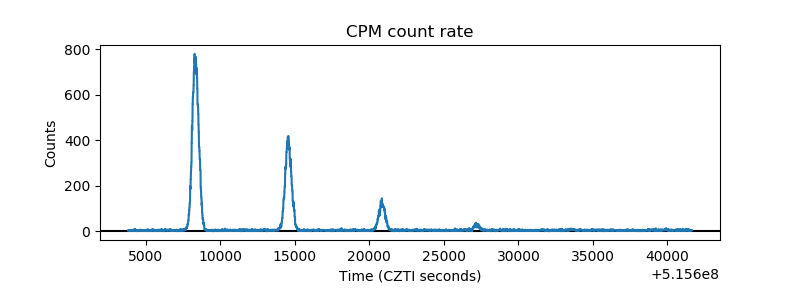 |
| CZT Counter | 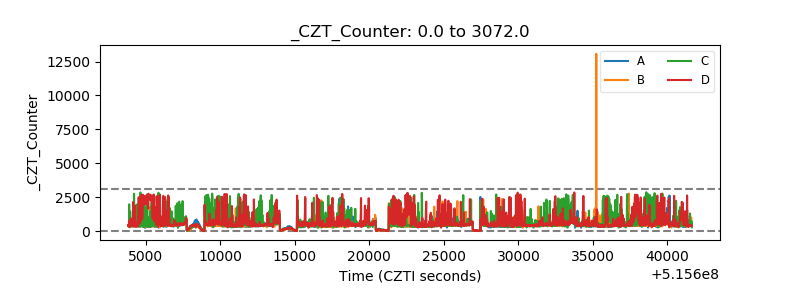 |
| +2.5 Volts monitor |  |
| +5 Volts monitor |  |
| _ROLL_ROT | 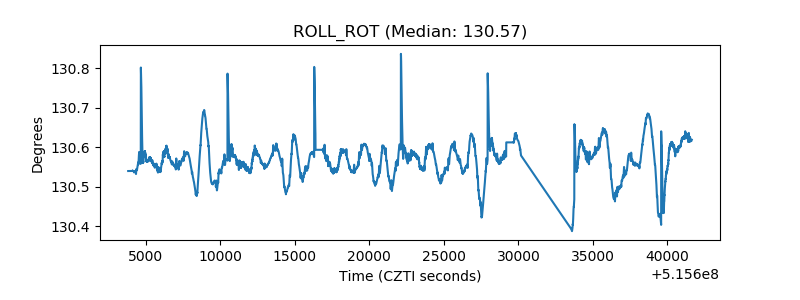 |
| _Roll_DEC | 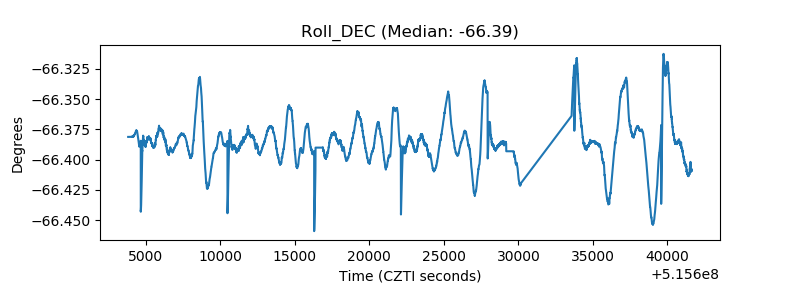 |
| _Roll_RA | 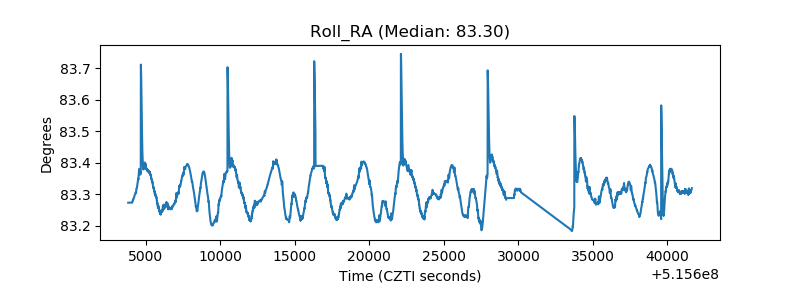 |
| Veto Counter | 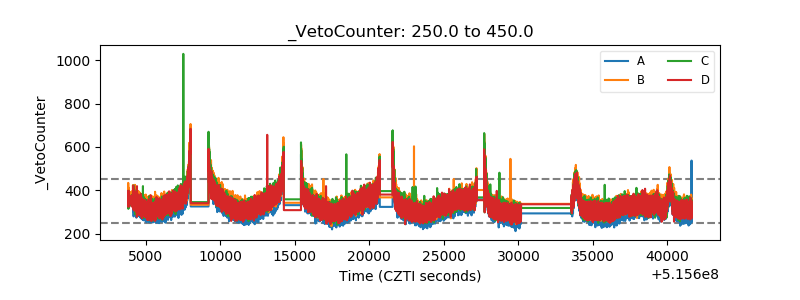 |