| Param | Original file | Final file |
|---|---|---|
| Filename | modeM0/AS1A14_102T01_9000006572_57358cztM0_level2.fits | modeM0/AS1A14_102T01_9000006572_57358cztM0_level2_quad_clean.evt |
| Size (bytes) | 1,506,896,640 | 223,655,040 |
| Size | 1.4 GB | 213.3 MB |
| Events in quadrant A | 10,604,172 | 1,473,453 |
| Events in quadrant B | 9,378,213 | 1,486,264 |
| Events in quadrant C | 21,032,508 | 1,242,383 |
| Events in quadrant D | 13,248,053 | 1,216,026 |
| Mode M0 | |||
|---|---|---|---|
| Quadrant | BADHDUFLAG | Total packets | Discarded packets |
| A | 0 | 45602 | 2 |
| B | 0 | 42142 | 2 |
| C | 0 | 76112 | 2 |
| D | 0 | 53369 | 2 |
| Mode M9 | |||
|---|---|---|---|
| Quadrant | BADHDUFLAG | Total packets | Discarded packets |
| A | 0 | 9 | 0 |
| B | 0 | 9 | 0 |
| C | 0 | 9 | 0 |
| D | 0 | 9 | 0 |
| Mode SS | |||
|---|---|---|---|
| Quadrant | BADHDUFLAG | Total packets | Discarded packets |
| A | 0 | 396 | 0 |
| B | 0 | 396 | 0 |
| C | 0 | 396 | 0 |
| D | 0 | 396 | 0 |
| Quadrant | Total seconds | Saturated seconds | Saturation percentage |
|---|---|---|---|
| A | 19622 | 486 | 2.476812% |
| B | 19622 | 347 | 1.768423% |
| C | 19622 | 3755 | 19.136683% |
| D | 19622 | 1043 | 5.315462% |
Noise dominated data is calculated using 1-second bins in cleaned event files. If a bin has >2000 counts, and if more than 50% of those come from <1% of pixels, then it is considered to be noise-dominated and hence unusable.
| Quadrant | # 1 sec bins | Bins with >0 counts | Bins with >2000 counts | High rate bins dominated by noise | Noise dominated (total time) | Noise dominated (detector-on time) | Marked lightcurve |
|---|---|---|---|---|---|---|---|
| A | 20814 | 19906 | 263 | 263 | 1.26% | 1.32% | 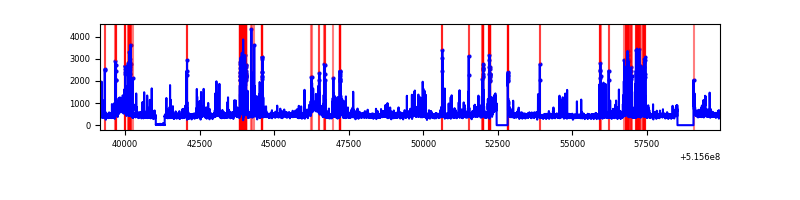 |
| B | 20814 | 19904 | 77 | 77 | 0.37% | 0.39% | 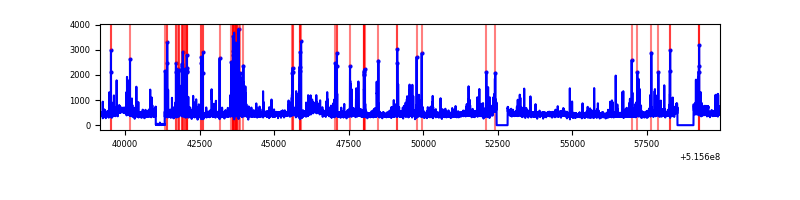 |
| C | 20814 | 19906 | 2924 | 2924 | 14.05% | 14.69% | 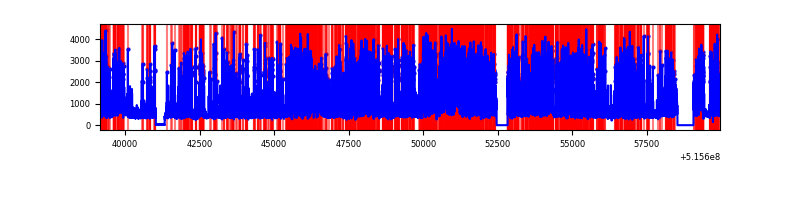 |
| D | 20814 | 19876 | 847 | 847 | 4.07% | 4.26% | 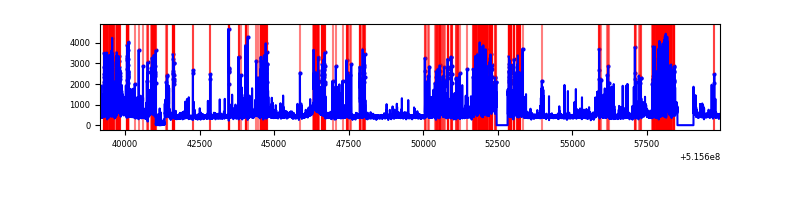 |
Top three noisy pixels from each quadrant. If the there are fewer than three noisy pixels in the level2.evt file, extra rows are filled as -1
| Pixel properties | Quadrant properties | ||||||
|---|---|---|---|---|---|---|---|
| Quadrant | DetID | PixID | Counts | Sigma | Mean | Median | Sigma |
| A | 3 | 14 | 1443950 | 2749.17 | 2124 | 2071 | 524.5 |
| A | 13 | 248 | 700623 | 1331.9 | 2124 | 2071 | 524.5 |
| A | 0 | 12 | 90482 | 168.57 | 2124 | 2071 | 524.5 |
| B | 5 | 185 | 413820 | 914.65 | 2109 | 2025 | 450.2 |
| B | 10 | 247 | 140321 | 307.17 | 2109 | 2025 | 450.2 |
| B | 7 | 252 | 105429 | 229.67 | 2109 | 2025 | 450.2 |
| C | 15 | 224 | 12196381 | 23792.72 | 1903 | 1882 | 512.5 |
| C | 12 | 252 | 416929 | 809.8 | 1903 | 1882 | 512.5 |
| C | 14 | 254 | 387801 | 752.97 | 1903 | 1882 | 512.5 |
| D | 2 | 249 | 3340268 | 5926.12 | 2017 | 1924 | 563.3 |
| D | 8 | 240 | 669433 | 1184.94 | 2017 | 1924 | 563.3 |
| D | 2 | 31 | 442365 | 781.86 | 2017 | 1924 | 563.3 |
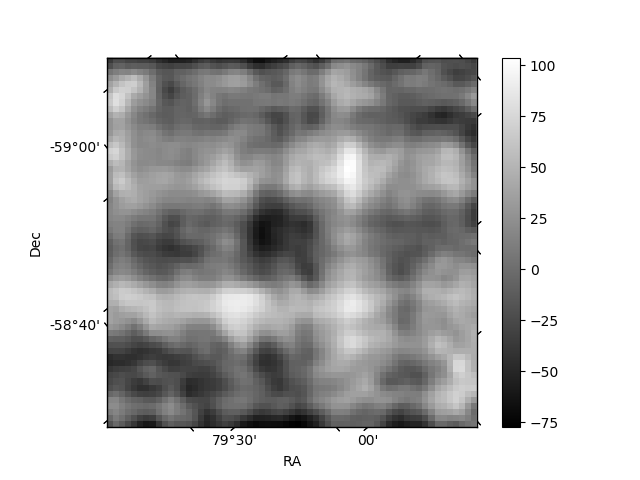
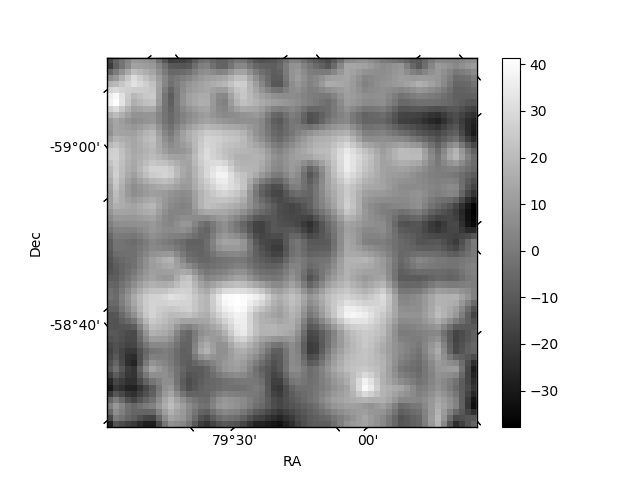
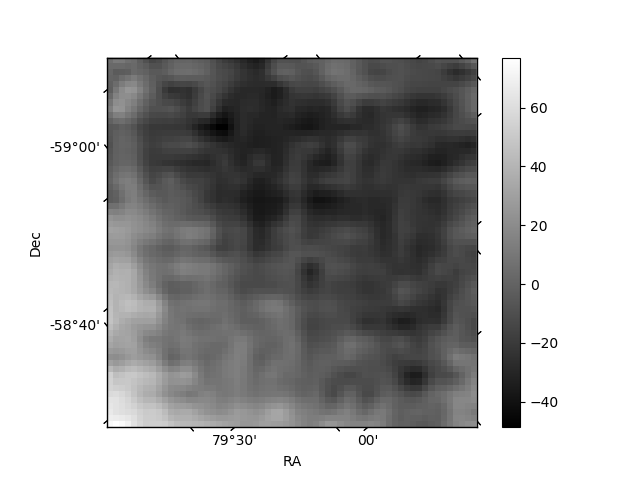
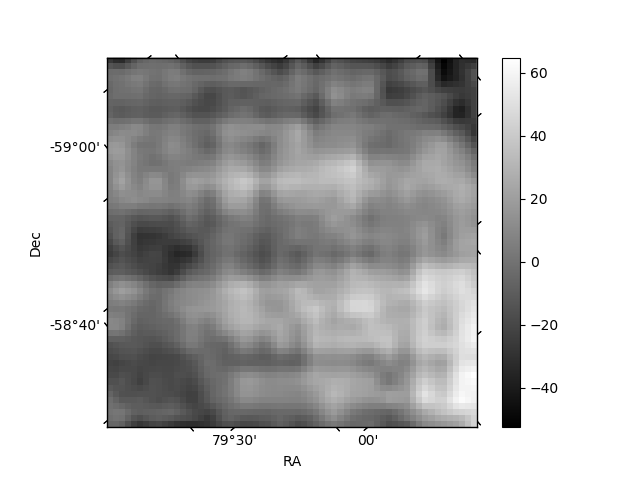
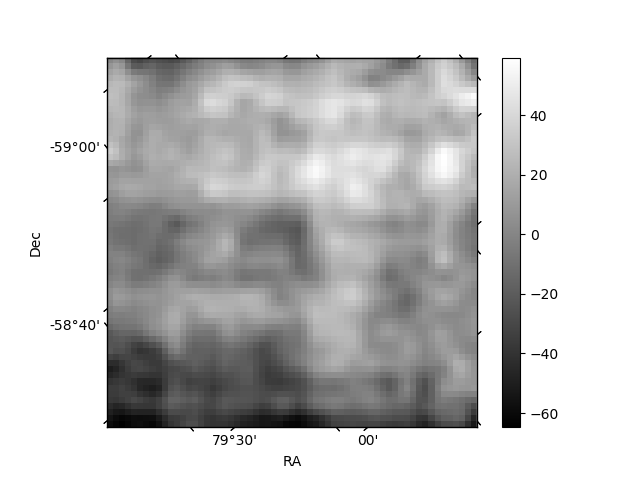
Histogram calculated using DETX and DETY for each event in the final _common_clean file
| Quadrant A | 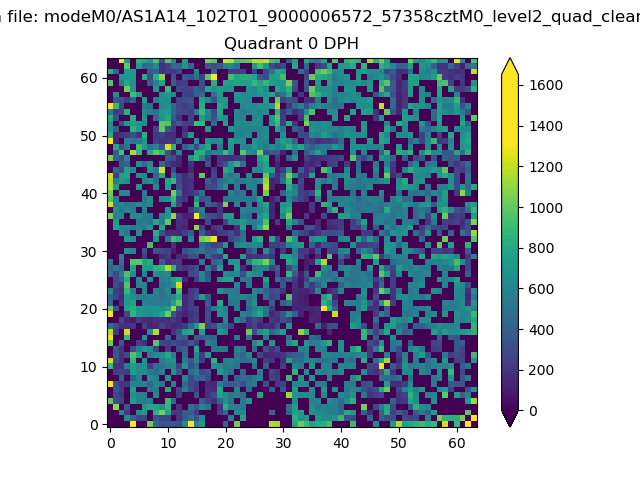 |
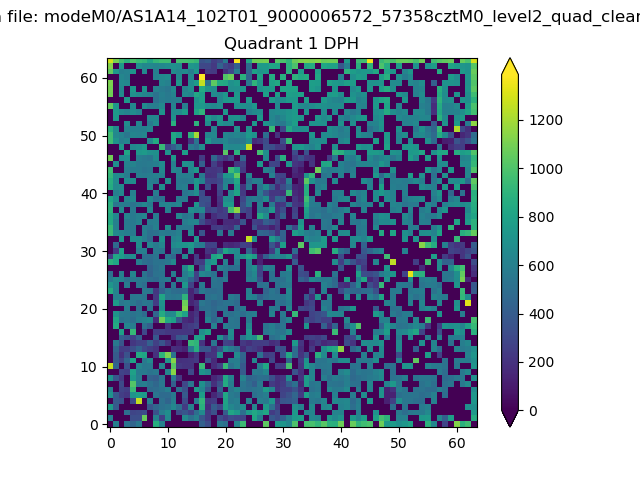 |
Quadrant B |
|---|---|---|---|
| Quadrant D | 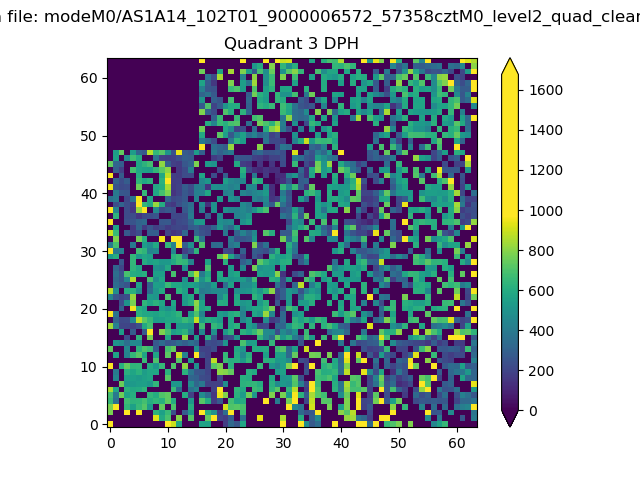 |
 |
Quadrant C |
| Plot type | Count rate plots | Images |
|---|---|---|
| Comparison with Poisson distribution Blue bars denote a histogram of data divided into 1 sec bins. Red curve is a Poisson curve with rate = median count rate of data. |
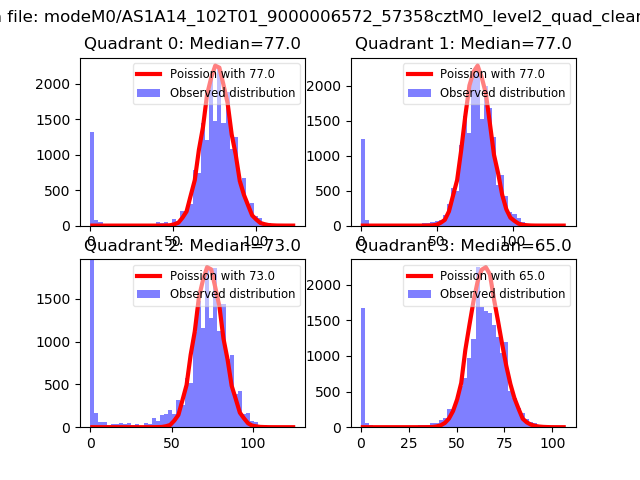 |
 |
| Quadrant-wise count rates Data is divided into 100 sec bins |
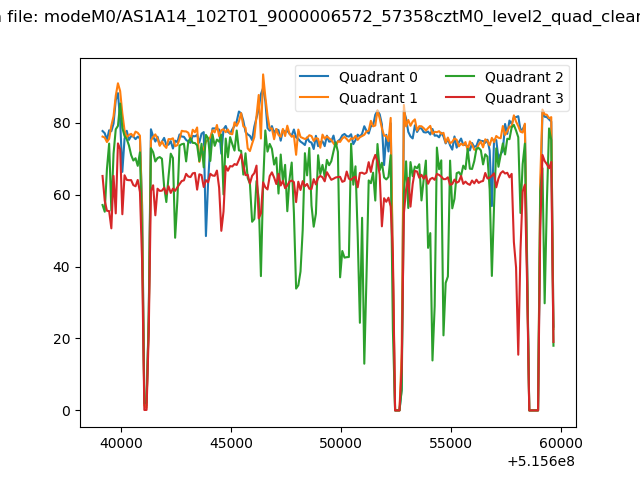 |
|
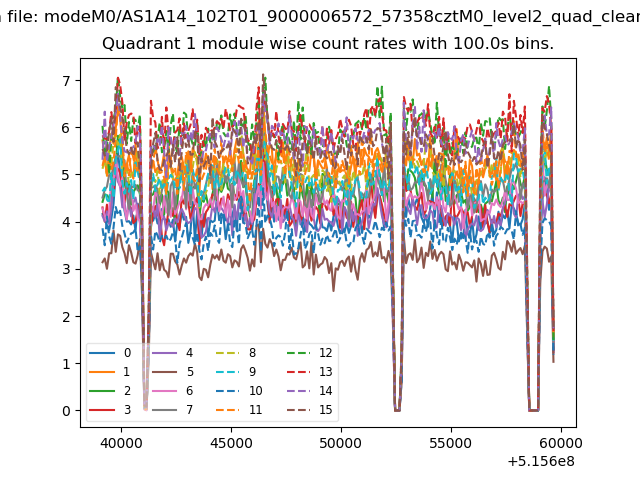
| Module-wise count rates for Quadrant A Data is divided into 100 sec bins |
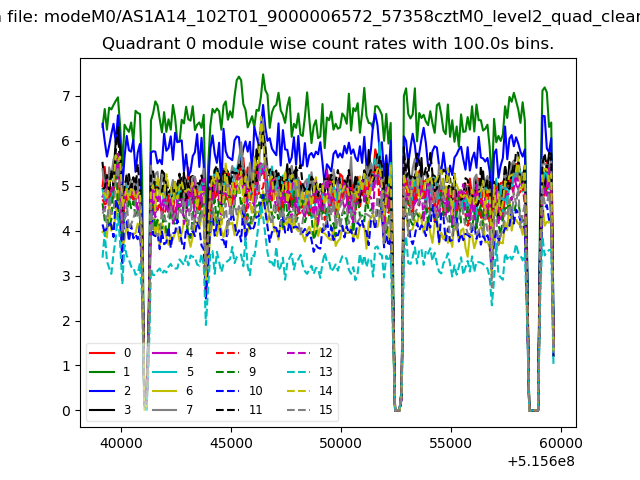 |
 |
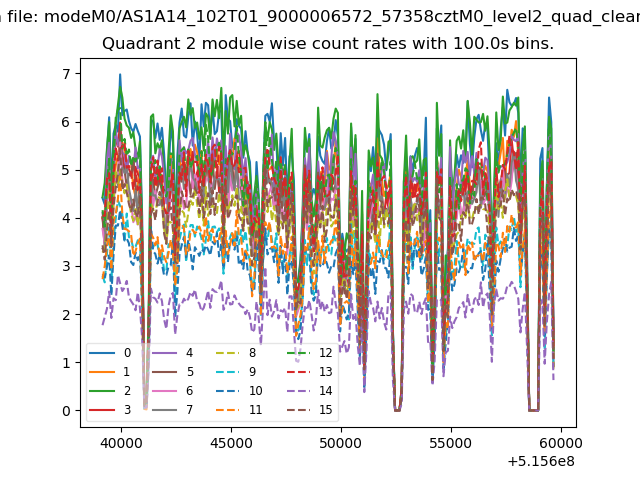
| Module-wise count rates for Quadrant B Data is divided into 100 sec bins |
 |
 |
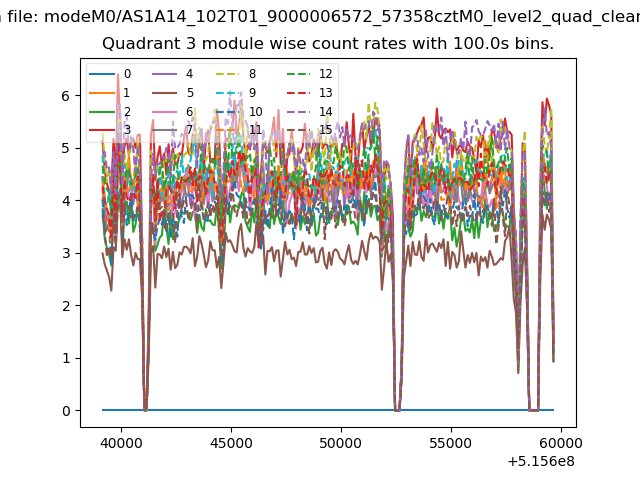
| Module-wise count rates for Quadrant C Data is divided into 100 sec bins |
 |
 |
| Module-wise count rates for Quadrant D Data is divided into 100 sec bins |
 |
 |
| Parameter | Plot |
|---|---|
| CZT HV Monitor | 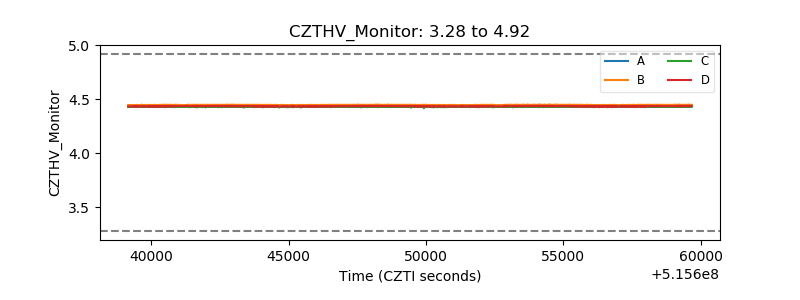 |
| D_VDD | 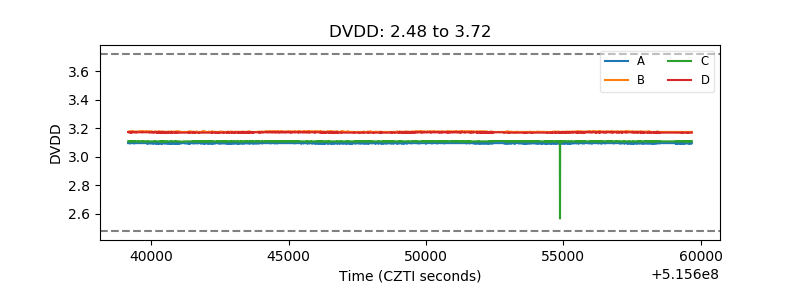 |
| Temperature 1 | 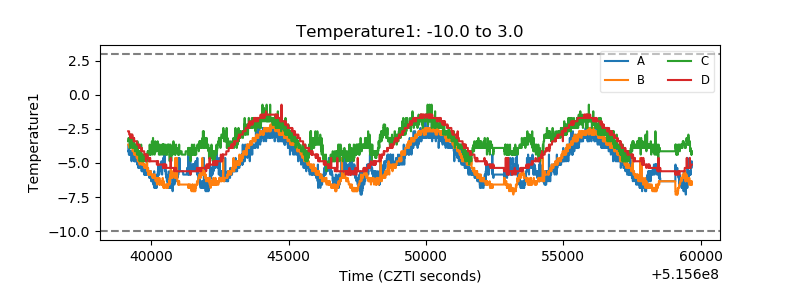 |
| Veto HV Monitor | 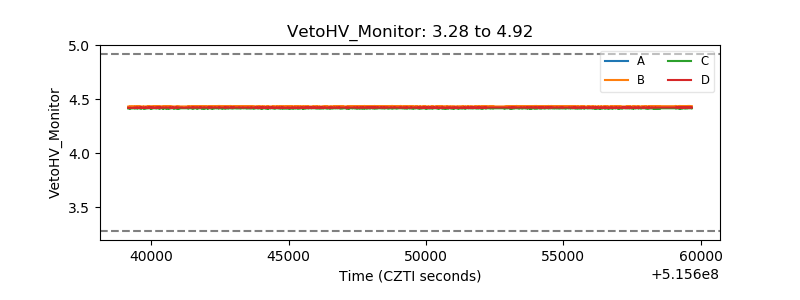 |
| Veto LLD | 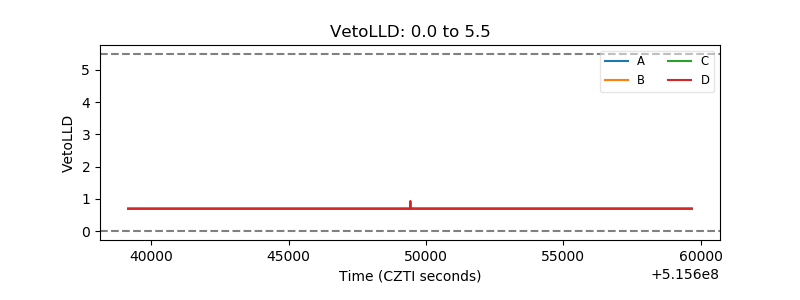 |
| Alpha Counter | 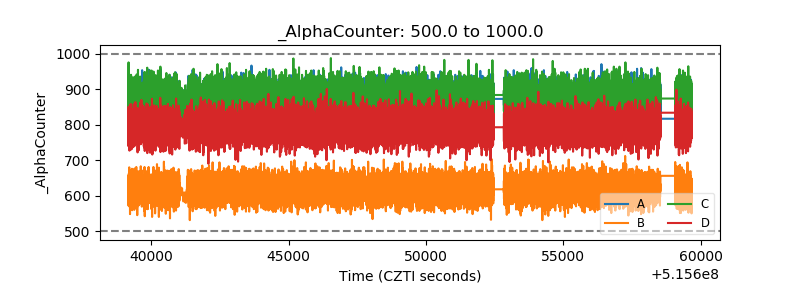 |
| _CPM_Rate | 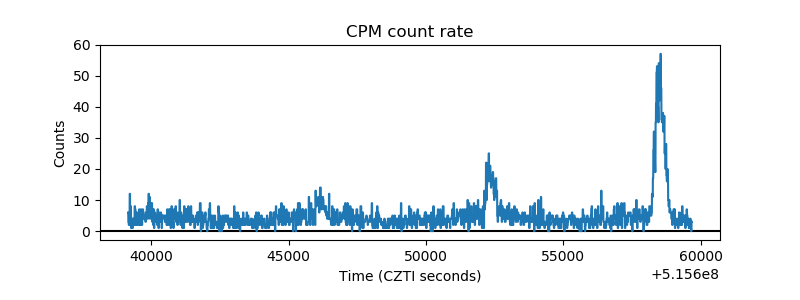 |
| CZT Counter | 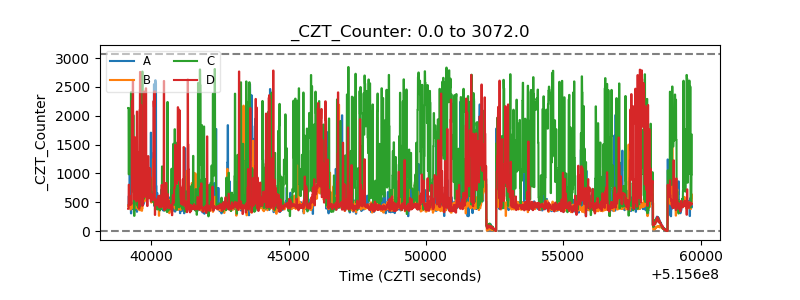 |
| +2.5 Volts monitor | 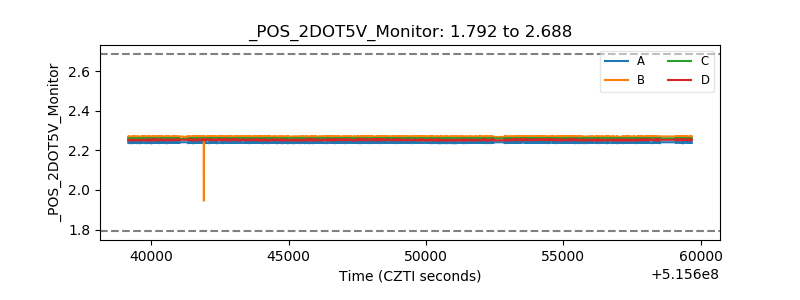 |
| +5 Volts monitor |  |
| _ROLL_ROT | 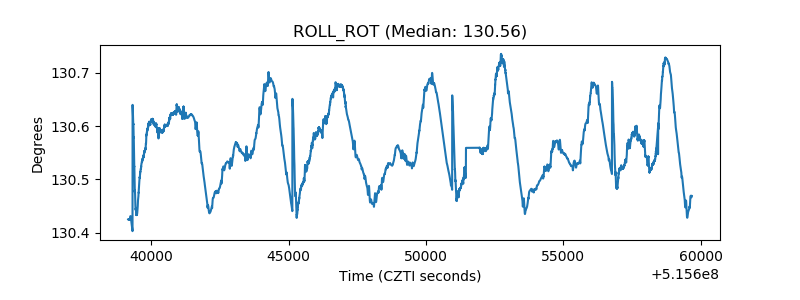 |
| _Roll_DEC | 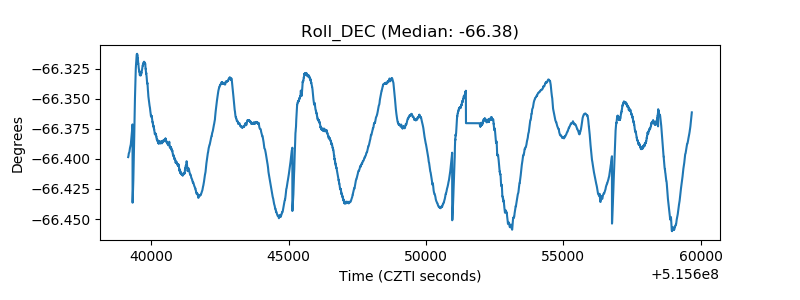 |
| _Roll_RA | 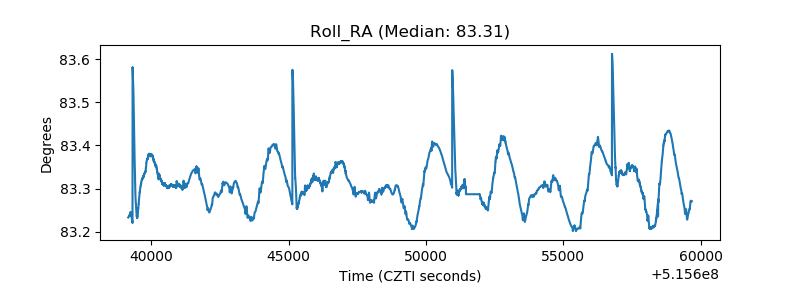 |
| Veto Counter | 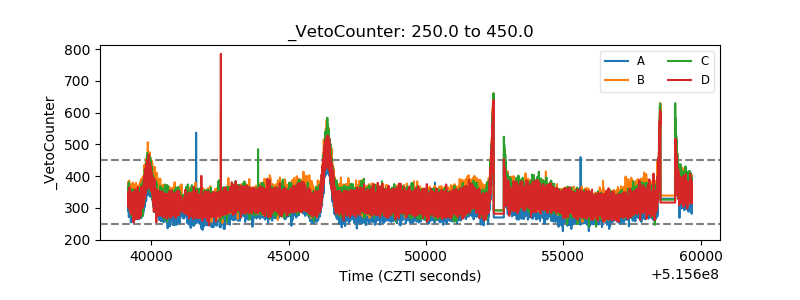 |