| Param | Original file | Final file |
|---|---|---|
| Filename | modeM0/AS1A14_102T01_9000006572_57360cztM0_level2.fits | modeM0/AS1A14_102T01_9000006572_57360cztM0_level2_quad_clean.evt |
| Size (bytes) | 462,432,960 | 87,062,400 |
| Size | 441.0 MB | 83.0 MB |
| Events in quadrant A | 2,888,149 | 585,590 |
| Events in quadrant B | 3,036,758 | 622,384 |
| Events in quadrant C | 7,151,428 | 476,425 |
| Events in quadrant D | 3,562,839 | 522,410 |
| Mode M0 | |||
|---|---|---|---|
| Quadrant | BADHDUFLAG | Total packets | Discarded packets |
| A | 0 | 13026 | 1 |
| B | 0 | 13496 | 1 |
| C | 0 | 25506 | 1 |
| D | 0 | 14810 | 1 |
| Mode M9 | |||
|---|---|---|---|
| Quadrant | BADHDUFLAG | Total packets | Discarded packets |
| A | 0 | 9 | 0 |
| B | 0 | 9 | 0 |
| C | 0 | 9 | 0 |
| D | 0 | 9 | 0 |
| Mode SS | |||
|---|---|---|---|
| Quadrant | BADHDUFLAG | Total packets | Discarded packets |
| A | 0 | 124 | 0 |
| B | 0 | 124 | 0 |
| C | 0 | 124 | 0 |
| D | 0 | 124 | 0 |
| Quadrant | Total seconds | Saturated seconds | Saturation percentage |
|---|---|---|---|
| A | 6153 | 65 | 1.056395% |
| B | 6153 | 126 | 2.047782% |
| C | 6153 | 1259 | 20.461563% |
| D | 6154 | 165 | 2.681183% |
Noise dominated data is calculated using 1-second bins in cleaned event files. If a bin has >2000 counts, and if more than 50% of those come from <1% of pixels, then it is considered to be noise-dominated and hence unusable.
| Quadrant | # 1 sec bins | Bins with >0 counts | Bins with >2000 counts | High rate bins dominated by noise | Noise dominated (total time) | Noise dominated (detector-on time) | Marked lightcurve |
|---|---|---|---|---|---|---|---|
| A | 7063 | 6153 | 5 | 5 | 0.07% | 0.08% | 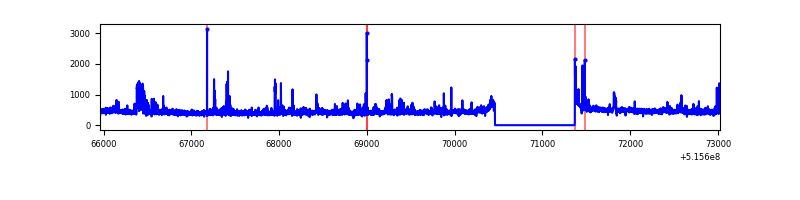 |
| B | 7063 | 6153 | 46 | 46 | 0.65% | 0.75% | 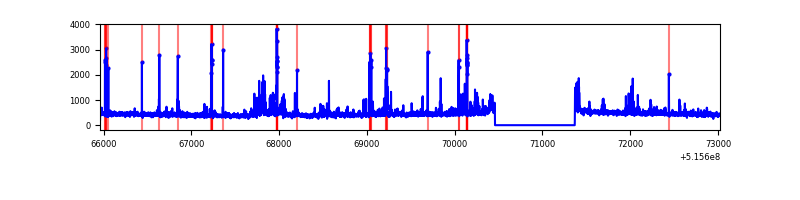 |
| C | 7063 | 6153 | 1079 | 1079 | 15.28% | 17.54% | 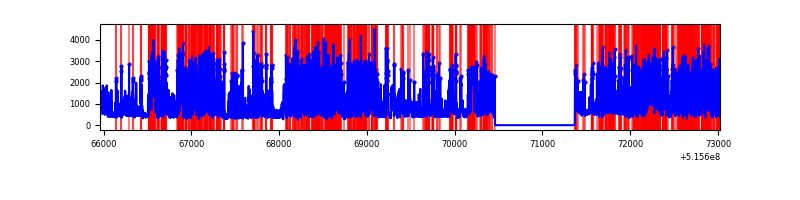 |
| D | 7064 | 6155 | 122 | 122 | 1.73% | 1.98% | 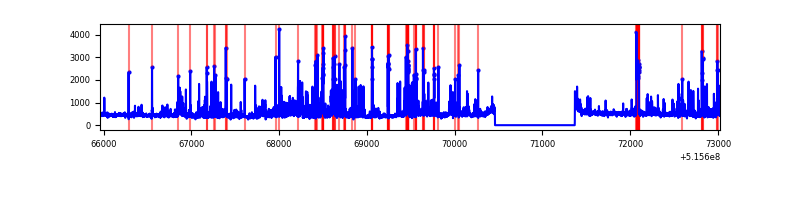 |
Top three noisy pixels from each quadrant. If the there are fewer than three noisy pixels in the level2.evt file, extra rows are filled as -1
| Pixel properties | Quadrant properties | ||||||
|---|---|---|---|---|---|---|---|
| Quadrant | DetID | PixID | Counts | Sigma | Mean | Median | Sigma |
| A | 3 | 14 | 114595 | 692.57 | 667 | 651 | 164.5 |
| A | 4 | 95 | 96178 | 580.63 | 667 | 651 | 164.5 |
| A | 0 | 12 | 33549 | 199.96 | 667 | 651 | 164.5 |
| B | 5 | 185 | 278640 | 1985.6 | 649 | 624 | 140.0 |
| B | 10 | 247 | 53671 | 378.86 | 649 | 624 | 140.0 |
| B | 7 | 252 | 40089 | 281.86 | 649 | 624 | 140.0 |
| C | 15 | 224 | 4468085 | 27644.25 | 589 | 581 | 161.6 |
| C | 12 | 252 | 189280 | 1167.64 | 589 | 581 | 161.6 |
| C | 14 | 254 | 69690 | 427.64 | 589 | 581 | 161.6 |
| D | 2 | 249 | 528517 | 2897.69 | 644 | 615 | 182.2 |
| D | 3 | 12 | 197844 | 1082.6 | 644 | 615 | 182.2 |
| D | 12 | 248 | 89118 | 485.8 | 644 | 615 | 182.2 |
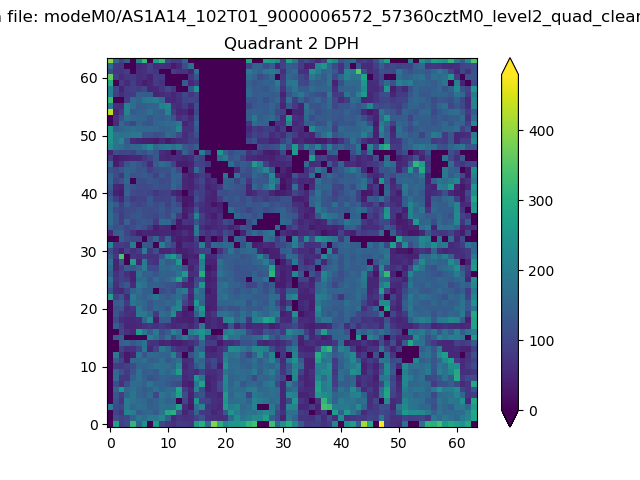
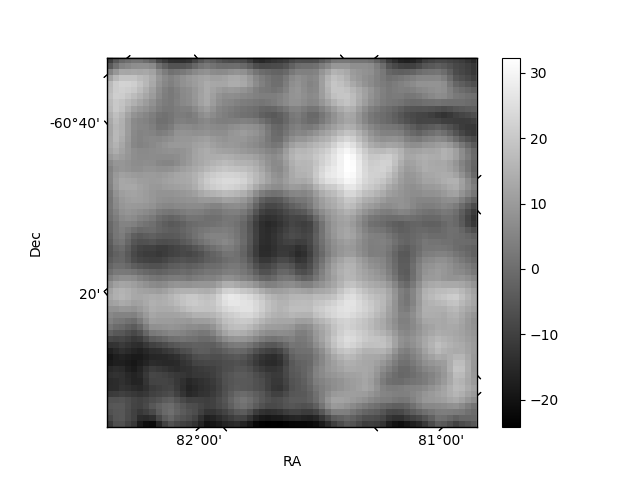
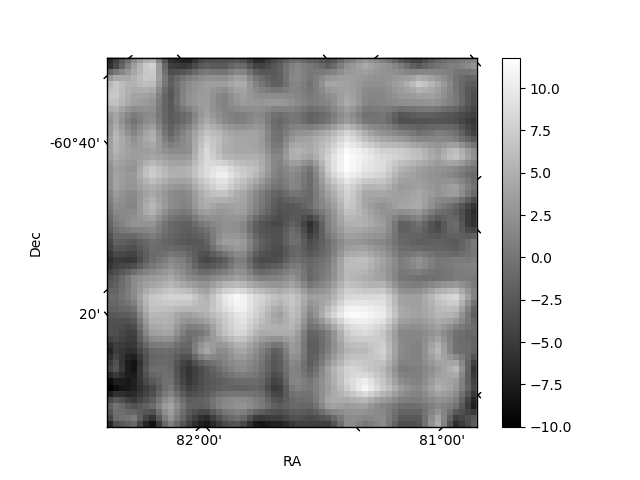
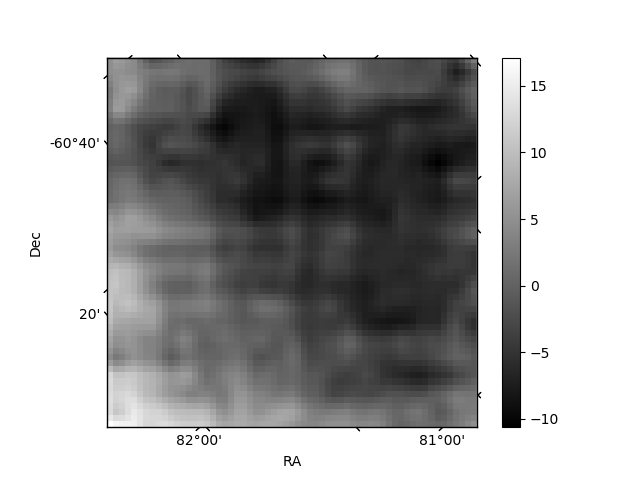
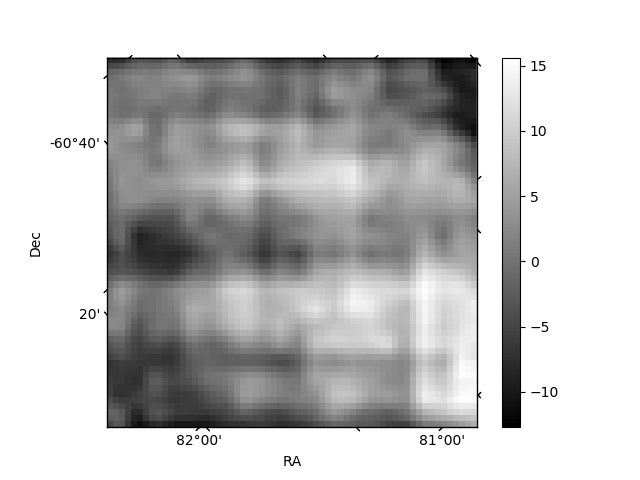
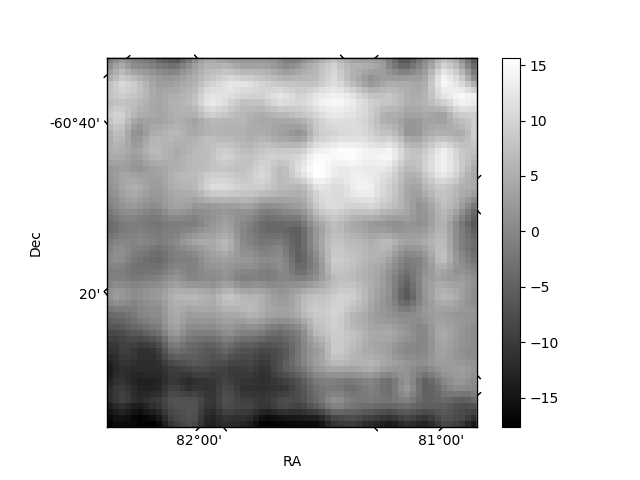
Histogram calculated using DETX and DETY for each event in the final _common_clean file
| Quadrant A | 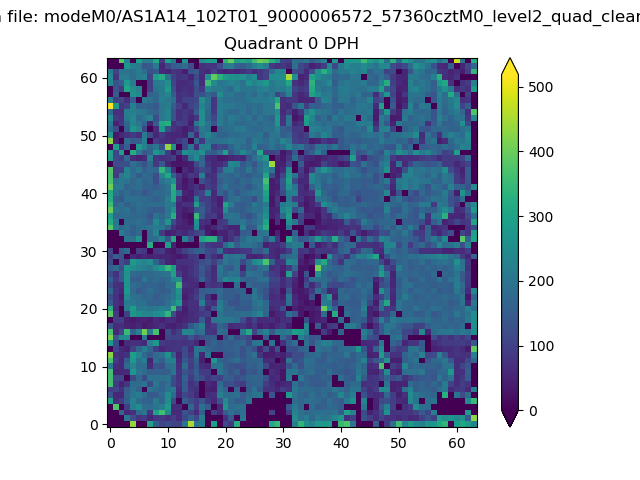 |
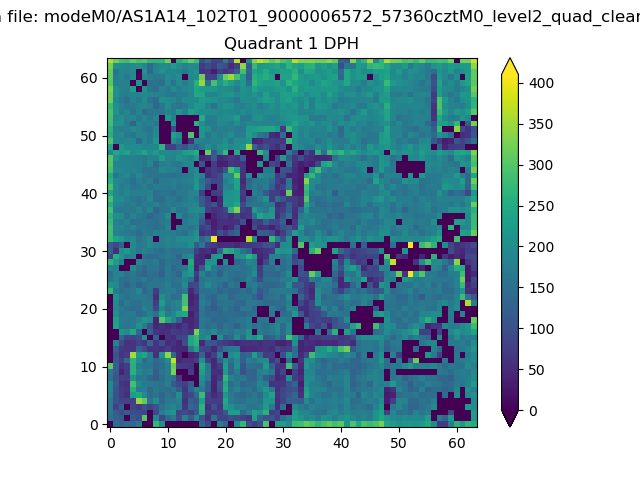 |
Quadrant B |
|---|---|---|---|
| Quadrant D | 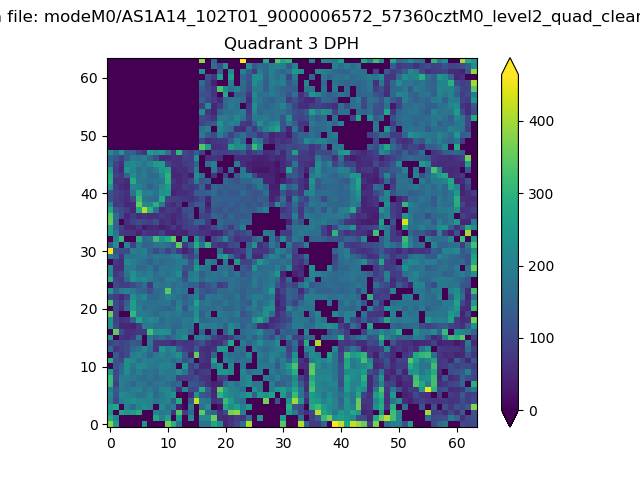 |
 |
Quadrant C |
| Plot type | Count rate plots | Images |
|---|---|---|
| Comparison with Poisson distribution Blue bars denote a histogram of data divided into 1 sec bins. Red curve is a Poisson curve with rate = median count rate of data. |
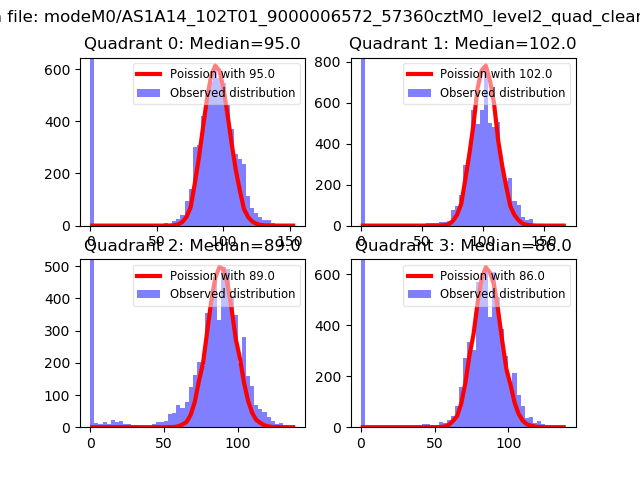 |
 |
| Quadrant-wise count rates Data is divided into 100 sec bins |
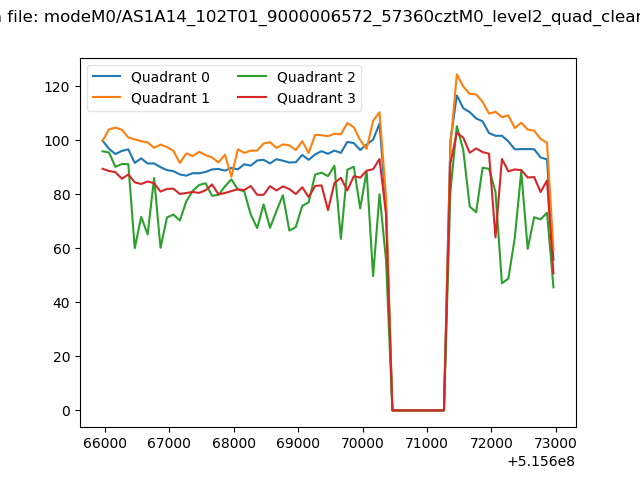 |
|
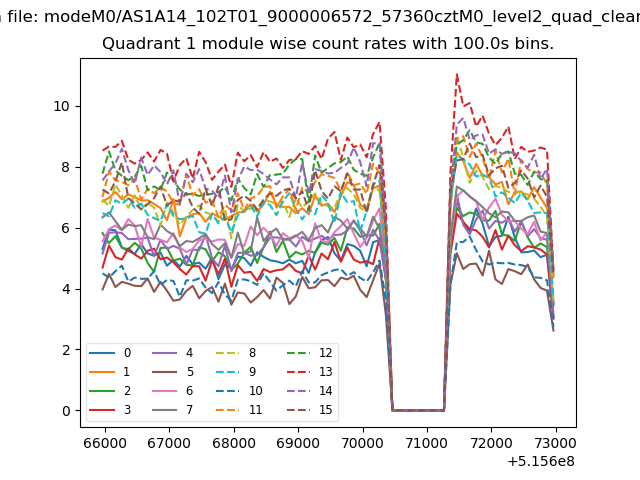
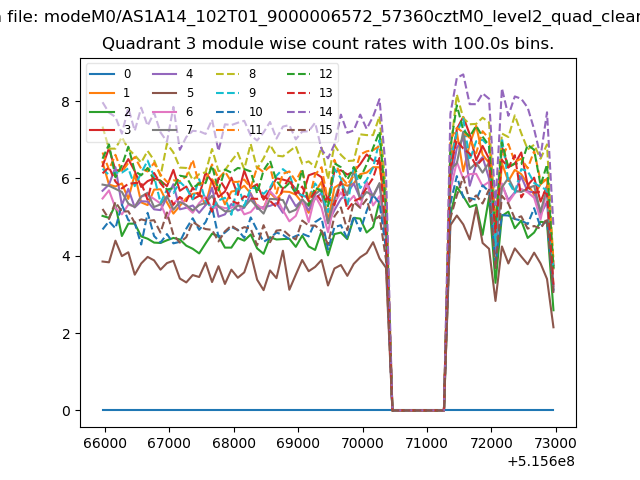
| Module-wise count rates for Quadrant A Data is divided into 100 sec bins |
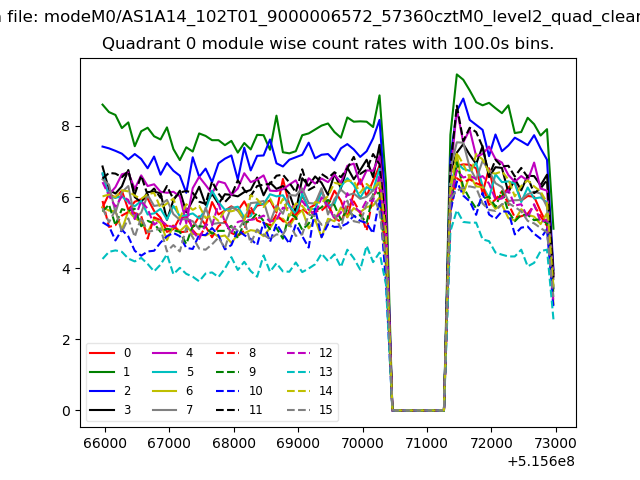 |
 |
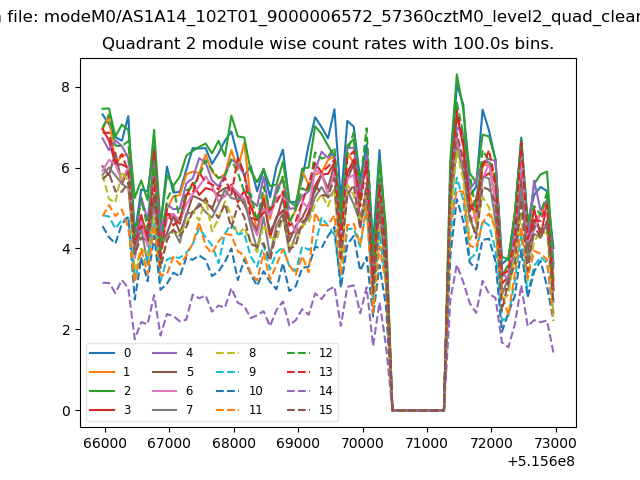
| Module-wise count rates for Quadrant B Data is divided into 100 sec bins |
 |
 |
| Module-wise count rates for Quadrant C Data is divided into 100 sec bins |
 |
 |
| Module-wise count rates for Quadrant D Data is divided into 100 sec bins |
 |
 |
| Parameter | Plot |
|---|---|
| CZT HV Monitor | 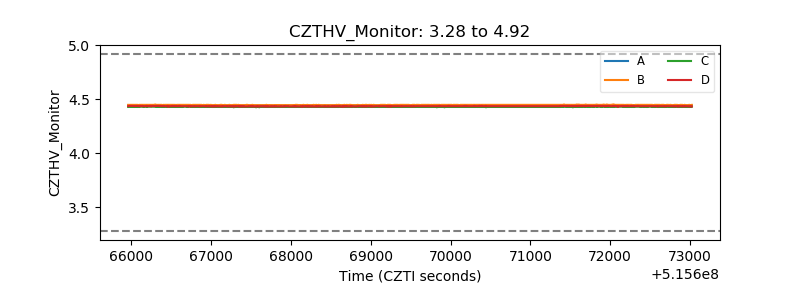 |
| D_VDD | 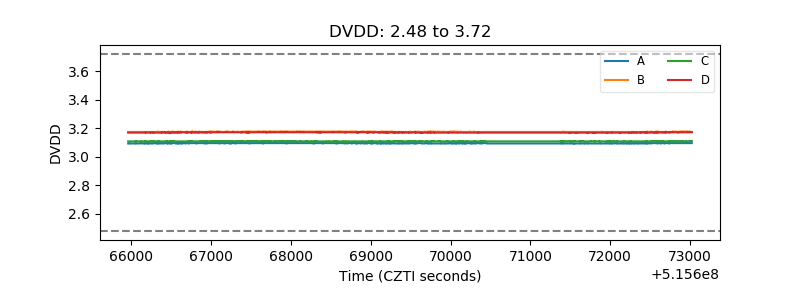 |
| Temperature 1 | 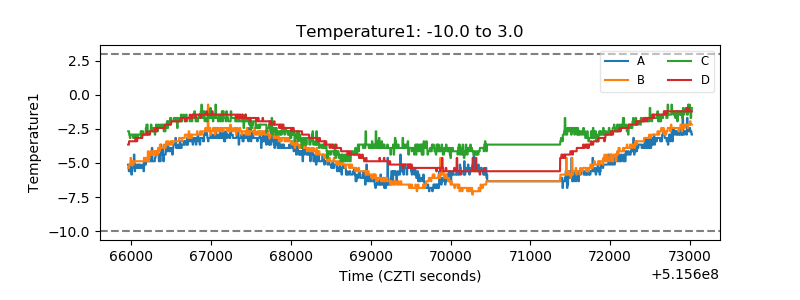 |
| Veto HV Monitor | 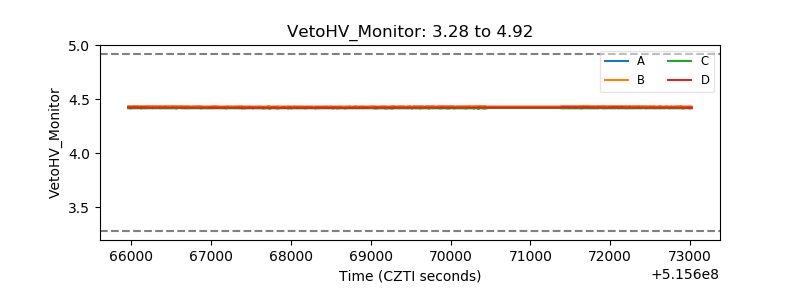 |
| Veto LLD | 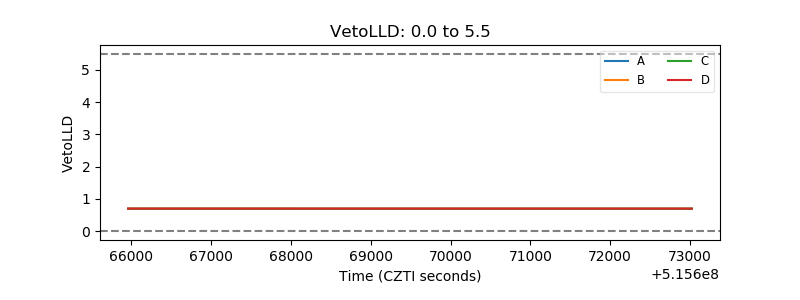 |
| Alpha Counter | 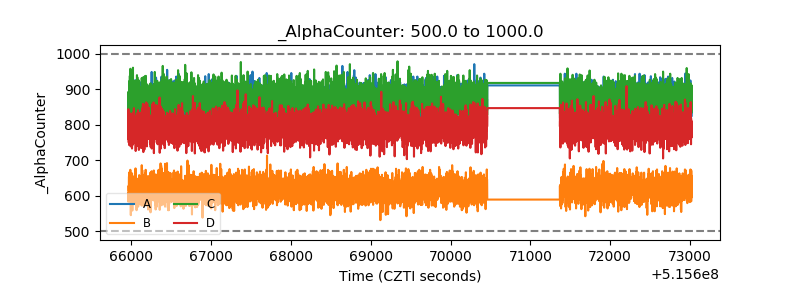 |
| _CPM_Rate | 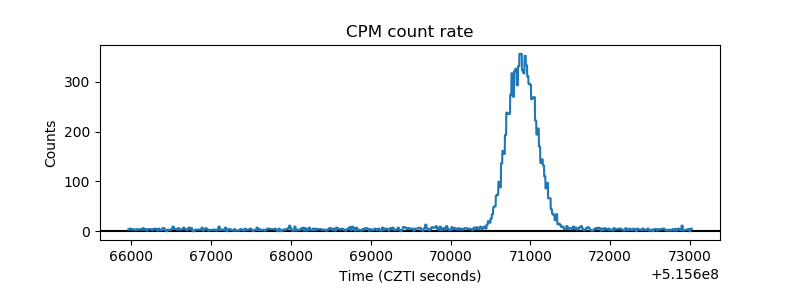 |
| CZT Counter | 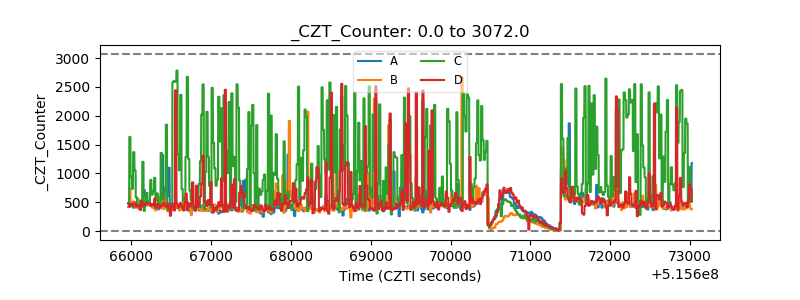 |
| +2.5 Volts monitor | 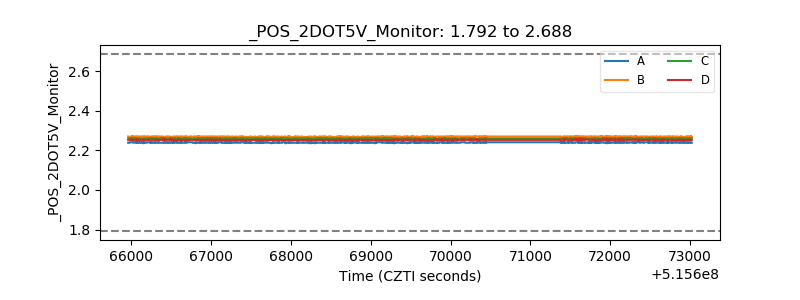 |
| +5 Volts monitor | 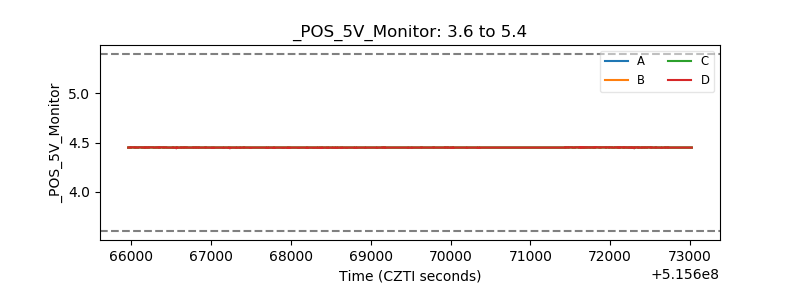 |
| _ROLL_ROT | 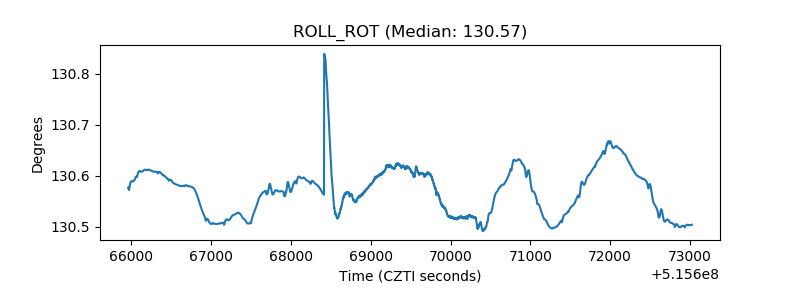 |
| _Roll_DEC | 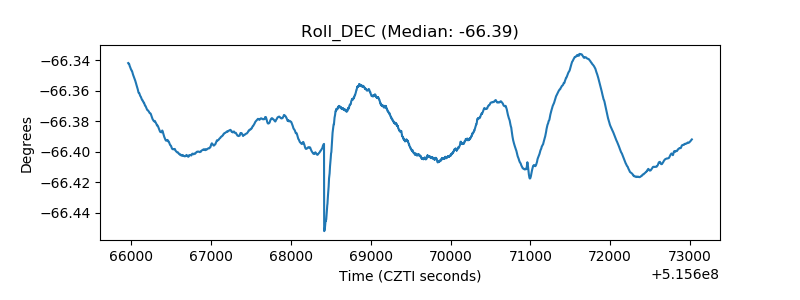 |
| _Roll_RA | 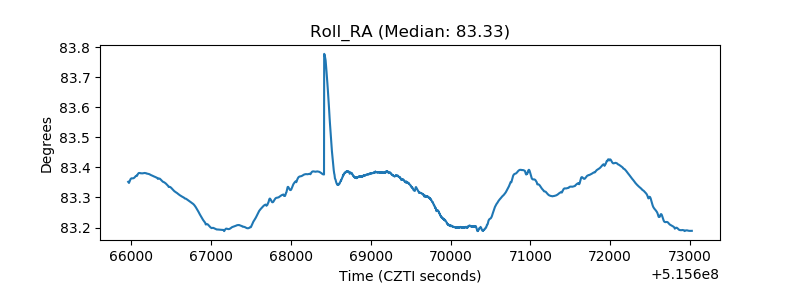 |
| Veto Counter | 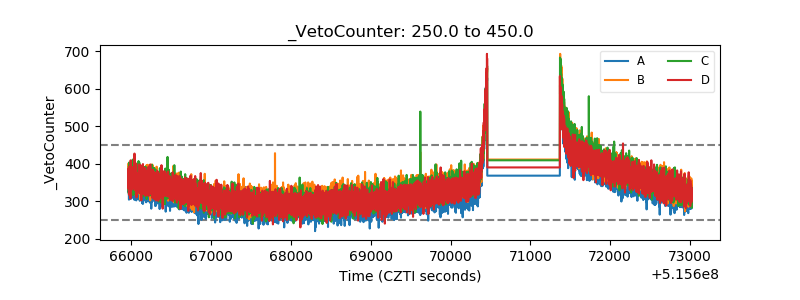 |