| Param | Original file | Final file |
|---|---|---|
| Filename | modeM0/AS1A14_102T01_9000006572_57362cztM0_level2.fits | modeM0/AS1A14_102T01_9000006572_57362cztM0_level2_quad_clean.evt |
| Size (bytes) | 484,588,800 | 86,374,080 |
| Size | 462.1 MB | 82.4 MB |
| Events in quadrant A | 2,900,699 | 593,638 |
| Events in quadrant B | 2,843,985 | 632,920 |
| Events in quadrant C | 7,886,171 | 444,955 |
| Events in quadrant D | 3,832,151 | 517,204 |
| Mode M0 | |||
|---|---|---|---|
| Quadrant | BADHDUFLAG | Total packets | Discarded packets |
| A | 0 | 13050 | 1 |
| B | 0 | 12916 | 1 |
| C | 0 | 27684 | 1 |
| D | 0 | 15629 | 1 |
| Mode M9 | |||
|---|---|---|---|
| Quadrant | BADHDUFLAG | Total packets | Discarded packets |
| A | 0 | 10 | 0 |
| B | 0 | 10 | 0 |
| C | 0 | 10 | 0 |
| D | 0 | 10 | 0 |
| Mode SS | |||
|---|---|---|---|
| Quadrant | BADHDUFLAG | Total packets | Discarded packets |
| A | 0 | 124 | 0 |
| B | 0 | 124 | 0 |
| C | 0 | 124 | 0 |
| D | 0 | 124 | 0 |
| Quadrant | Total seconds | Saturated seconds | Saturation percentage |
|---|---|---|---|
| A | 6105 | 55 | 0.900901% |
| B | 6106 | 77 | 1.261055% |
| C | 6106 | 1617 | 26.482149% |
| D | 6106 | 272 | 4.454635% |
Noise dominated data is calculated using 1-second bins in cleaned event files. If a bin has >2000 counts, and if more than 50% of those come from <1% of pixels, then it is considered to be noise-dominated and hence unusable.
| Quadrant | # 1 sec bins | Bins with >0 counts | Bins with >2000 counts | High rate bins dominated by noise | Noise dominated (total time) | Noise dominated (detector-on time) | Marked lightcurve |
|---|---|---|---|---|---|---|---|
| A | 7145 | 6105 | 10 | 10 | 0.14% | 0.16% | 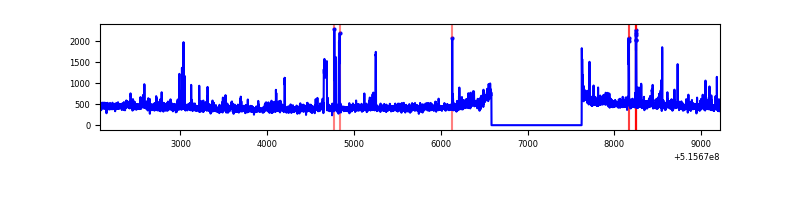 |
| B | 7146 | 6106 | 28 | 28 | 0.39% | 0.46% | 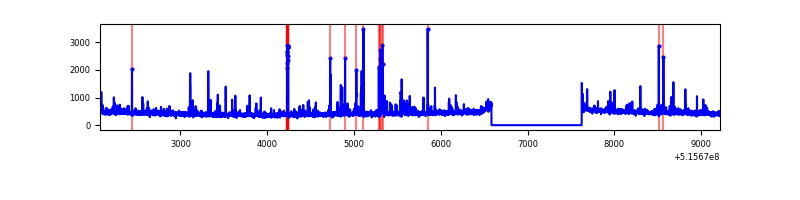 |
| C | 7146 | 6106 | 1436 | 1436 | 20.10% | 23.52% | 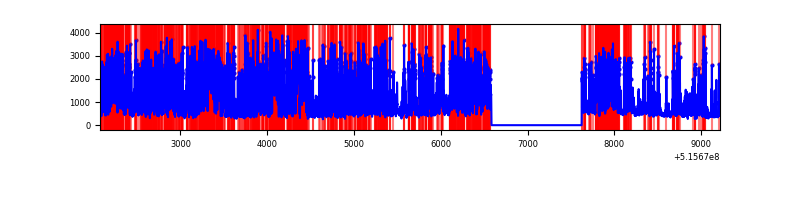 |
| D | 7146 | 6107 | 234 | 234 | 3.27% | 3.83% | 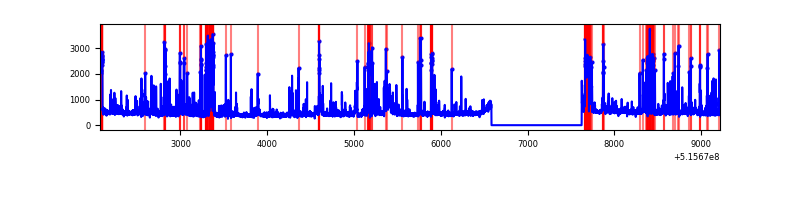 |
Top three noisy pixels from each quadrant. If the there are fewer than three noisy pixels in the level2.evt file, extra rows are filled as -1
| Pixel properties | Quadrant properties | ||||||
|---|---|---|---|---|---|---|---|
| Quadrant | DetID | PixID | Counts | Sigma | Mean | Median | Sigma |
| A | 0 | 12 | 114900 | 699.05 | 665 | 649 | 163.4 |
| A | 3 | 14 | 102011 | 620.19 | 665 | 649 | 163.4 |
| A | 8 | 4 | 56826 | 343.72 | 665 | 649 | 163.4 |
| B | 5 | 185 | 89137 | 630.21 | 650 | 626 | 140.4 |
| B | 0 | 213 | 47953 | 336.97 | 650 | 626 | 140.4 |
| B | 7 | 252 | 45236 | 317.63 | 650 | 626 | 140.4 |
| C | 15 | 224 | 5501949 | 35680.07 | 565 | 559 | 154.2 |
| C | 12 | 252 | 103004 | 664.42 | 565 | 559 | 154.2 |
| C | 14 | 254 | 30898 | 196.77 | 565 | 559 | 154.2 |
| D | 2 | 249 | 341128 | 1910.25 | 630 | 603 | 178.3 |
| D | 3 | 12 | 301572 | 1688.35 | 630 | 603 | 178.3 |
| D | 15 | 142 | 218008 | 1219.58 | 630 | 603 | 178.3 |
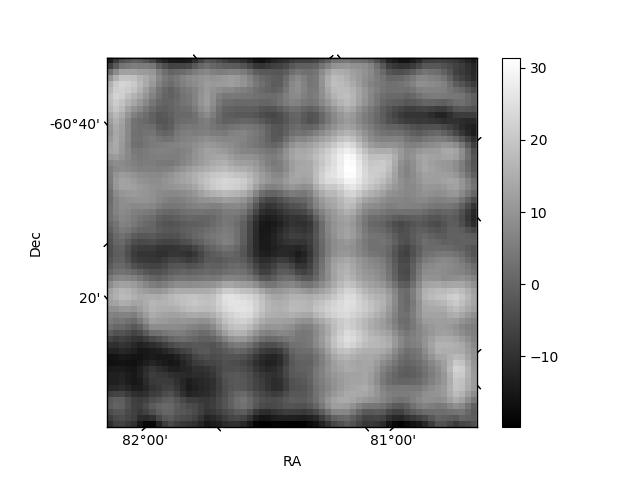
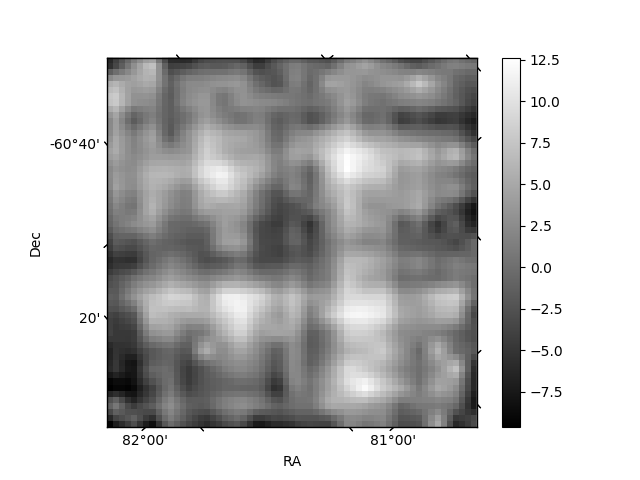
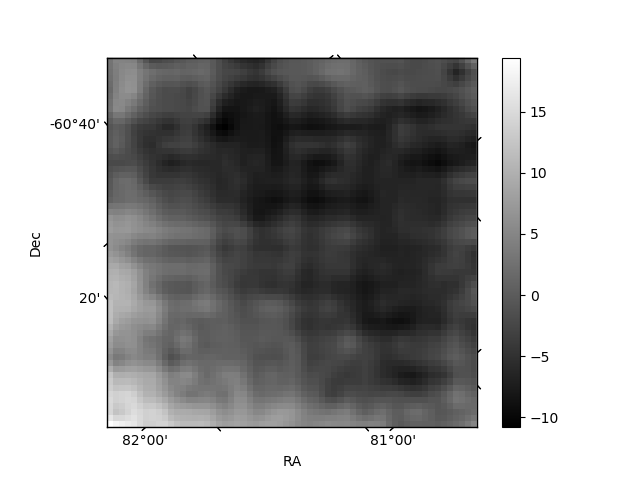
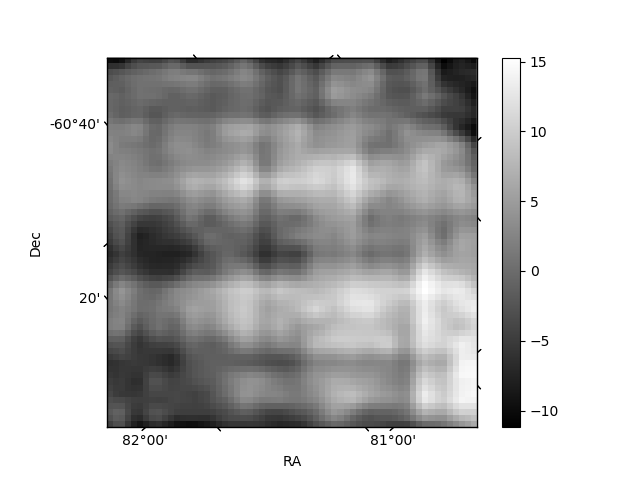
Histogram calculated using DETX and DETY for each event in the final _common_clean file
| Quadrant A | 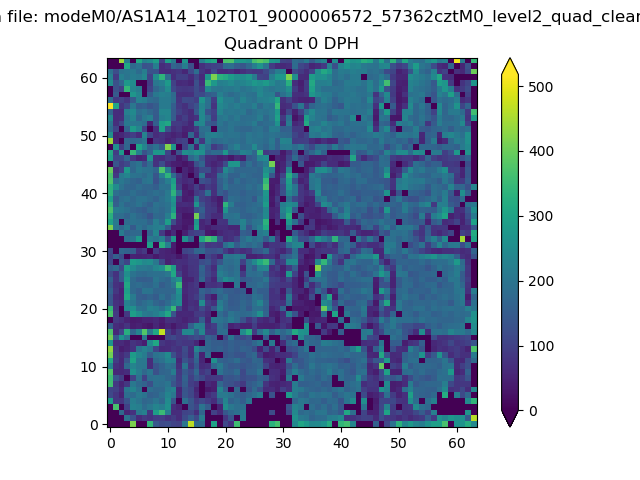 |
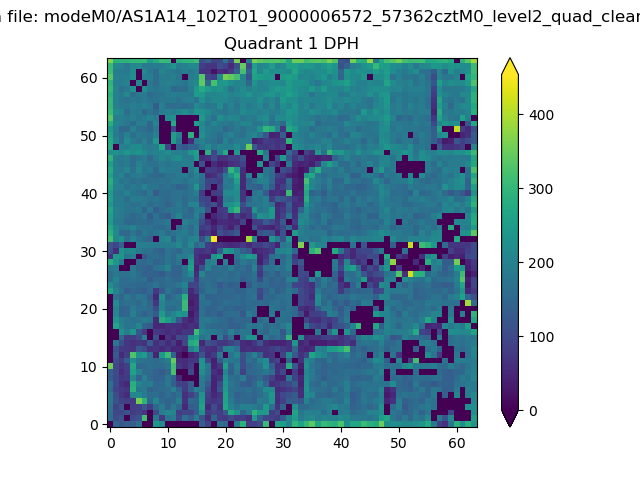 |
Quadrant B |
|---|---|---|---|
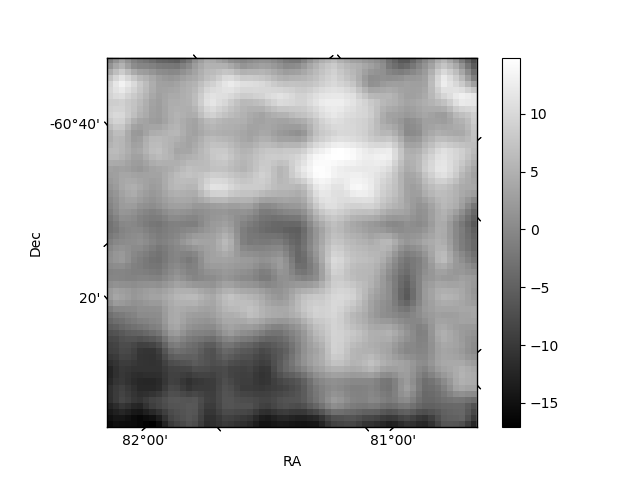
| Quadrant D | 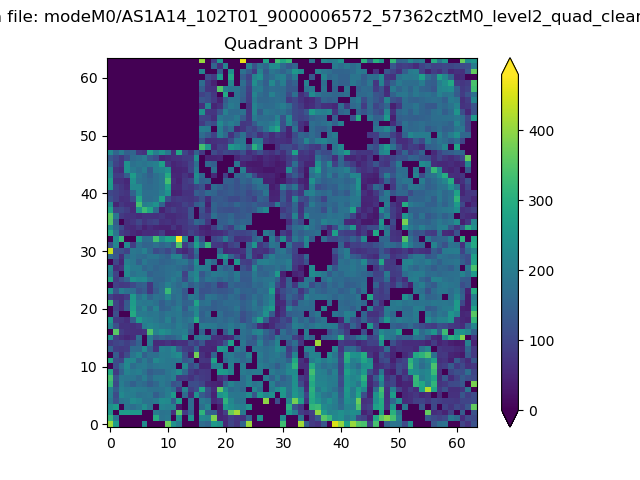 |
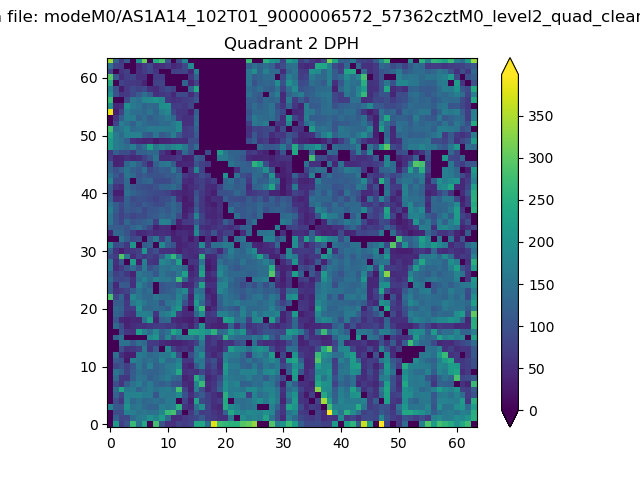 |
Quadrant C |
| Plot type | Count rate plots | Images |
|---|---|---|
| Comparison with Poisson distribution Blue bars denote a histogram of data divided into 1 sec bins. Red curve is a Poisson curve with rate = median count rate of data. |
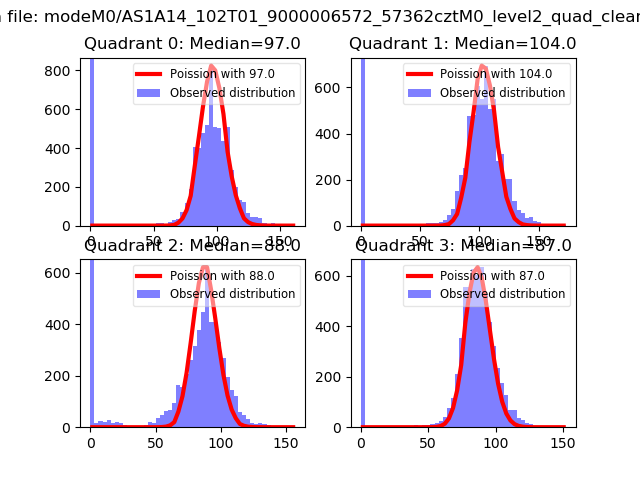 |
 |
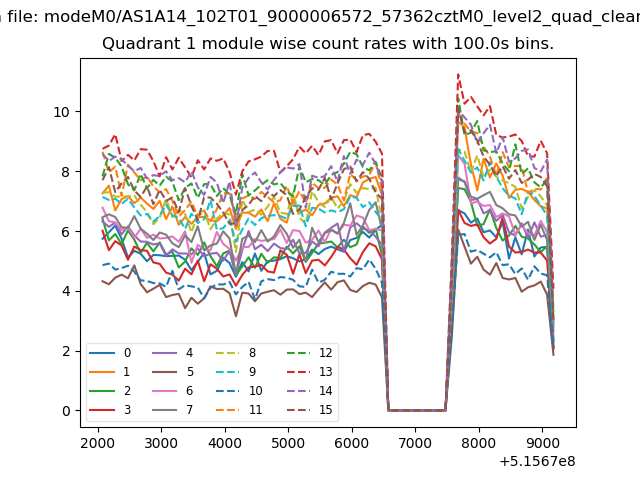
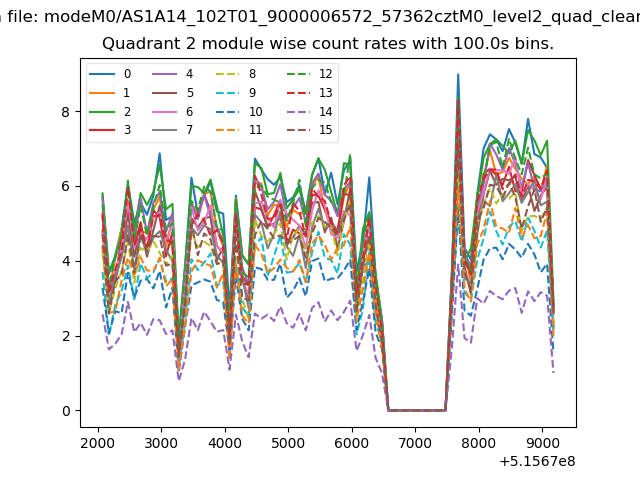
| Quadrant-wise count rates Data is divided into 100 sec bins |
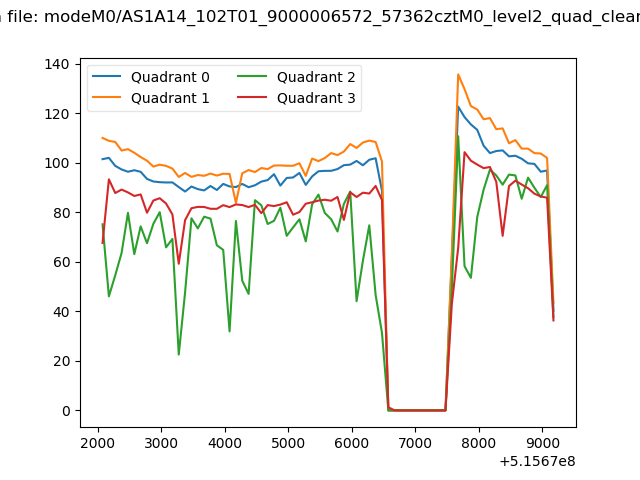 |
|
| Module-wise count rates for Quadrant A Data is divided into 100 sec bins |
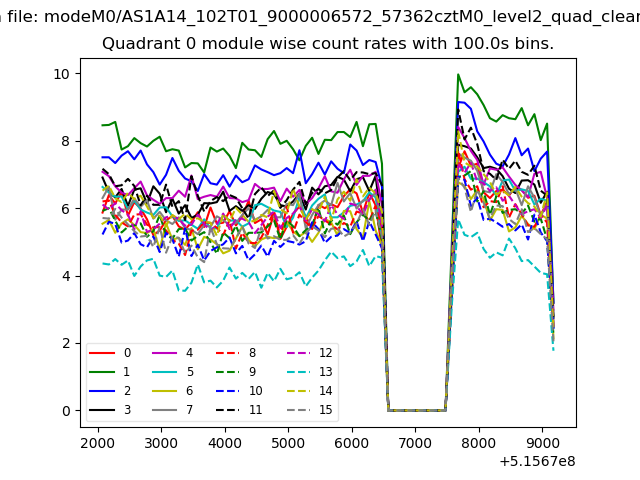 |
 |
| Module-wise count rates for Quadrant B Data is divided into 100 sec bins |
 |
 |
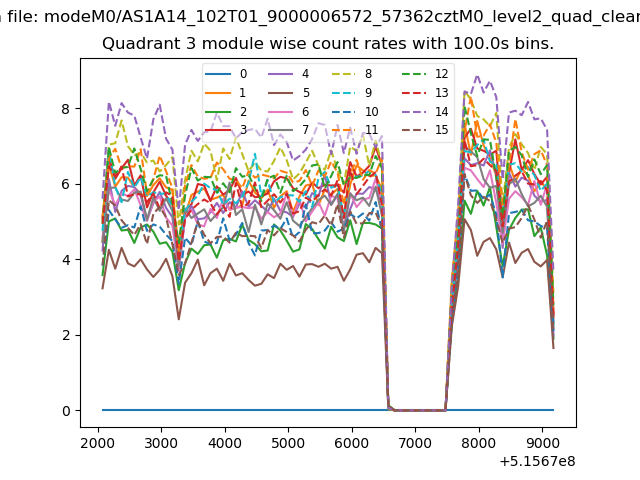
| Module-wise count rates for Quadrant C Data is divided into 100 sec bins |
 |
 |
| Module-wise count rates for Quadrant D Data is divided into 100 sec bins |
 |
 |
| Parameter | Plot |
|---|---|
| CZT HV Monitor | 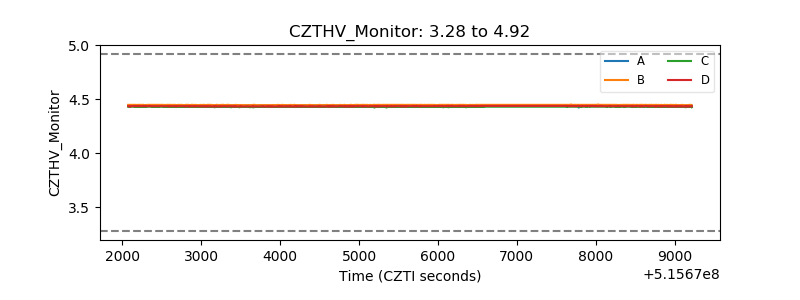 |
| D_VDD | 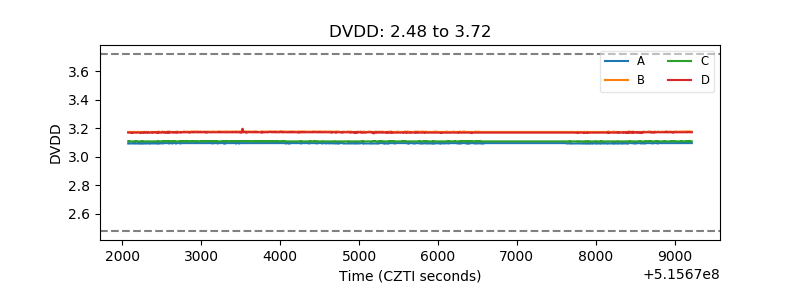 |
| Temperature 1 | 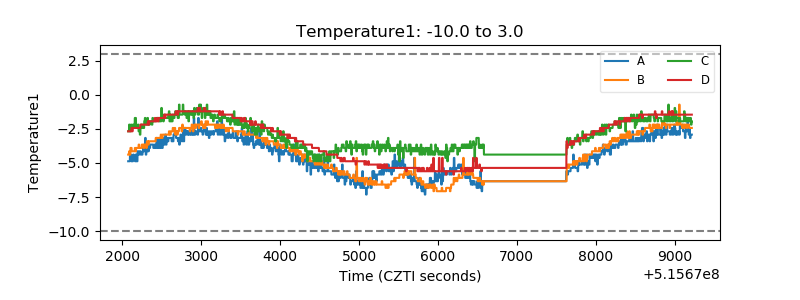 |
| Veto HV Monitor | 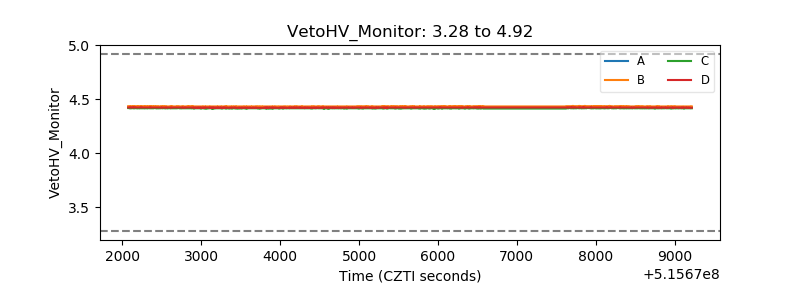 |
| Veto LLD | 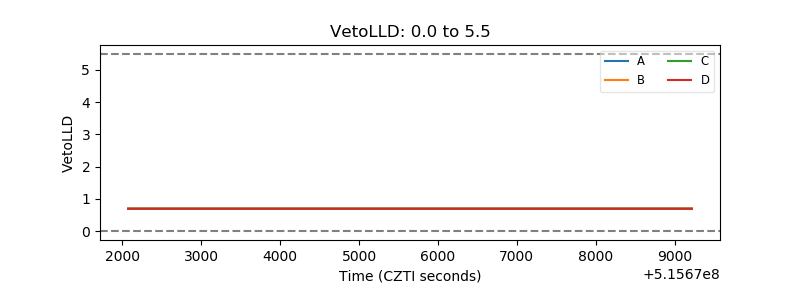 |
| Alpha Counter | 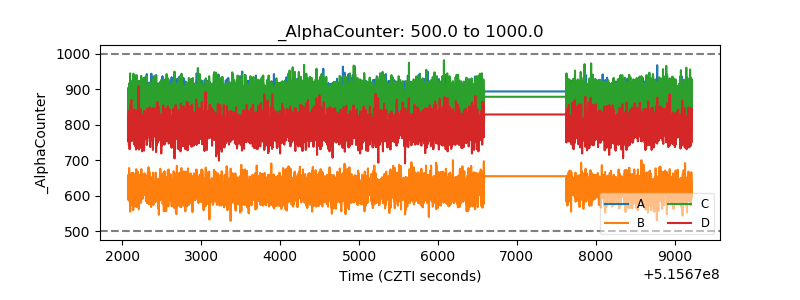 |
| _CPM_Rate | 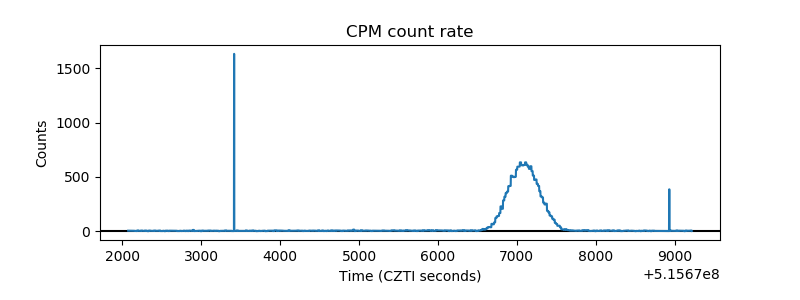 |
| CZT Counter | 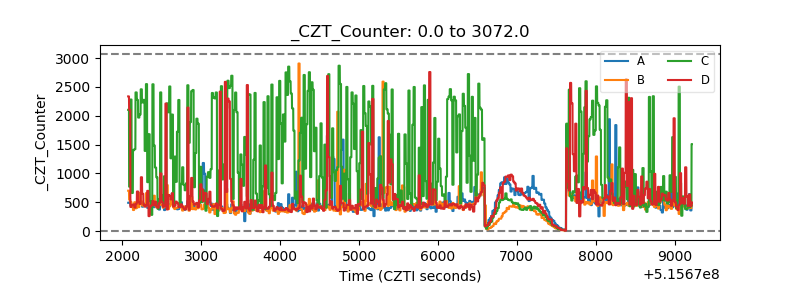 |
| +2.5 Volts monitor |  |
| +5 Volts monitor |  |
| _ROLL_ROT | 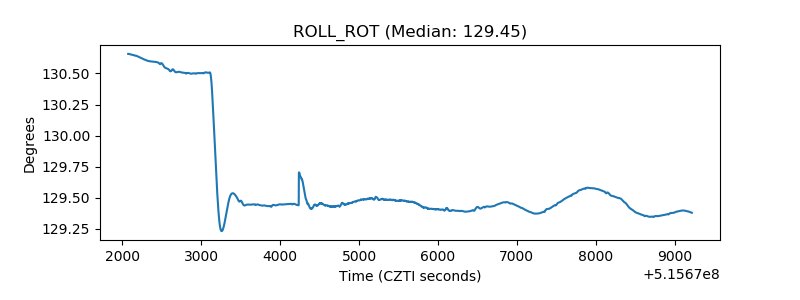 |
| _Roll_DEC | 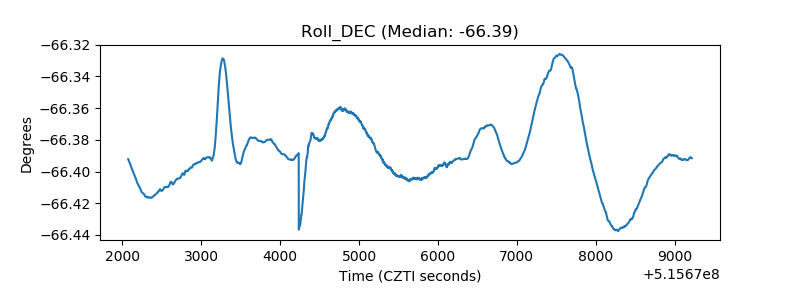 |
| _Roll_RA | 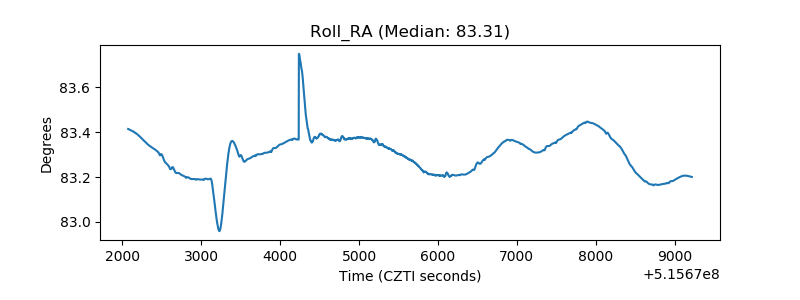 |
| Veto Counter | 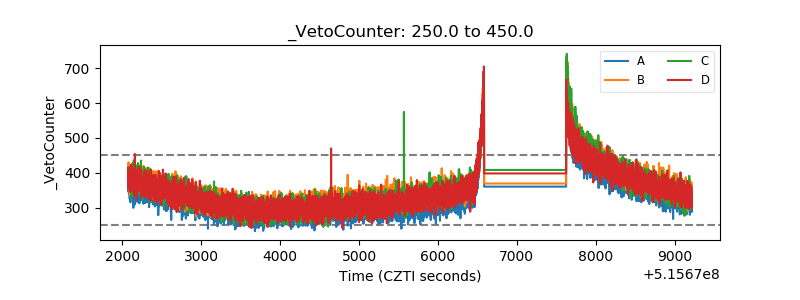 |