| Param | Original file | Final file |
|---|---|---|
| Filename | modeM0/AS1A14_102T01_9000006572_57363cztM0_level2.fits | modeM0/AS1A14_102T01_9000006572_57363cztM0_level2_quad_clean.evt |
| Size (bytes) | 471,939,840 | 90,319,680 |
| Size | 450.1 MB | 86.1 MB |
| Events in quadrant A | 3,073,157 | 612,809 |
| Events in quadrant B | 2,895,753 | 659,658 |
| Events in quadrant C | 6,966,676 | 494,173 |
| Events in quadrant D | 4,053,733 | 536,980 |
| Mode M0 | |||
|---|---|---|---|
| Quadrant | BADHDUFLAG | Total packets | Discarded packets |
| A | 0 | 13533 | 1 |
| B | 0 | 13033 | 1 |
| C | 0 | 25062 | 1 |
| D | 0 | 16287 | 1 |
| Mode M9 | |||
|---|---|---|---|
| Quadrant | BADHDUFLAG | Total packets | Discarded packets |
| A | 0 | 12 | 0 |
| B | 0 | 12 | 0 |
| C | 0 | 12 | 0 |
| D | 0 | 12 | 0 |
| Mode SS | |||
|---|---|---|---|
| Quadrant | BADHDUFLAG | Total packets | Discarded packets |
| A | 0 | 124 | 0 |
| B | 0 | 124 | 0 |
| C | 0 | 124 | 0 |
| D | 0 | 124 | 0 |
| Quadrant | Total seconds | Saturated seconds | Saturation percentage |
|---|---|---|---|
| A | 6181 | 91 | 1.472254% |
| B | 6182 | 46 | 0.744096% |
| C | 6181 | 1200 | 19.414334% |
| D | 6181 | 273 | 4.416761% |
Noise dominated data is calculated using 1-second bins in cleaned event files. If a bin has >2000 counts, and if more than 50% of those come from <1% of pixels, then it is considered to be noise-dominated and hence unusable.
| Quadrant | # 1 sec bins | Bins with >0 counts | Bins with >2000 counts | High rate bins dominated by noise | Noise dominated (total time) | Noise dominated (detector-on time) | Marked lightcurve |
|---|---|---|---|---|---|---|---|
| A | 7316 | 6182 | 46 | 46 | 0.63% | 0.74% | 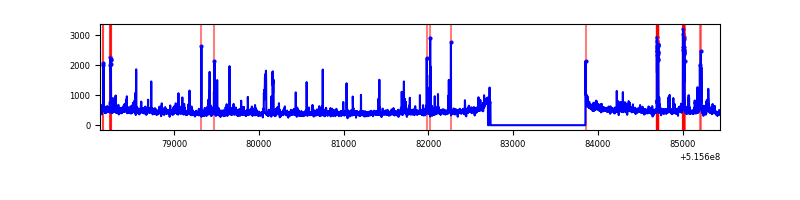 |
| B | 7317 | 6183 | 5 | 5 | 0.07% | 0.08% | 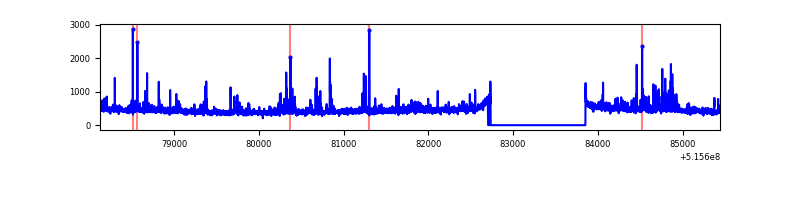 |
| C | 7315 | 6181 | 1058 | 1058 | 14.46% | 17.12% | 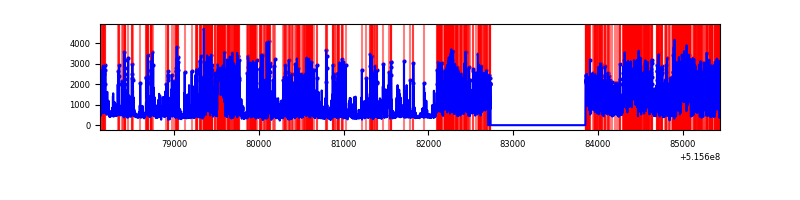 |
| D | 7316 | 6182 | 248 | 248 | 3.39% | 4.01% | 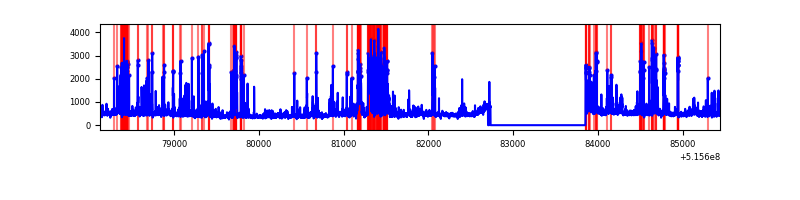 |
Top three noisy pixels from each quadrant. If the there are fewer than three noisy pixels in the level2.evt file, extra rows are filled as -1
| Pixel properties | Quadrant properties | ||||||
|---|---|---|---|---|---|---|---|
| Quadrant | DetID | PixID | Counts | Sigma | Mean | Median | Sigma |
| A | 13 | 248 | 181360 | 1072.12 | 679 | 663 | 168.5 |
| A | 0 | 12 | 88482 | 521.05 | 679 | 663 | 168.5 |
| A | 8 | 4 | 61709 | 362.2 | 679 | 663 | 168.5 |
| B | 5 | 185 | 161072 | 1121.33 | 666 | 640 | 143.1 |
| B | 7 | 252 | 17775 | 119.76 | 666 | 640 | 143.1 |
| B | 12 | 111 | 17566 | 118.3 | 666 | 640 | 143.1 |
| C | 15 | 224 | 4363881 | 26778.09 | 593 | 586 | 162.9 |
| C | 12 | 252 | 171802 | 1050.77 | 593 | 586 | 162.9 |
| C | 14 | 254 | 43895 | 265.79 | 593 | 586 | 162.9 |
| D | 8 | 240 | 632676 | 3445.6 | 644 | 615 | 183.4 |
| D | 2 | 249 | 261647 | 1422.98 | 644 | 615 | 183.4 |
| D | 3 | 12 | 186437 | 1012.98 | 644 | 615 | 183.4 |
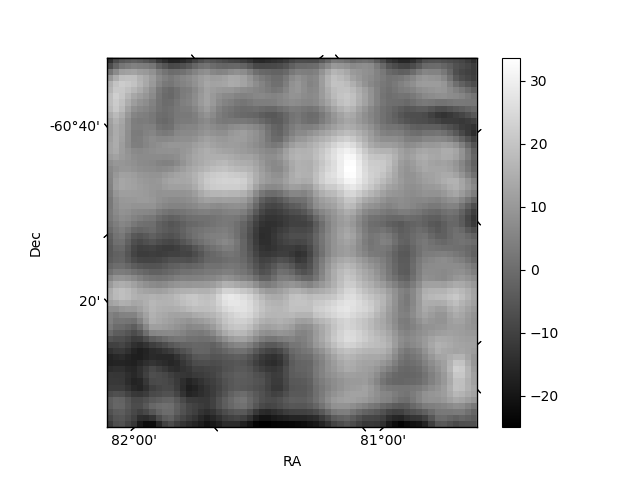
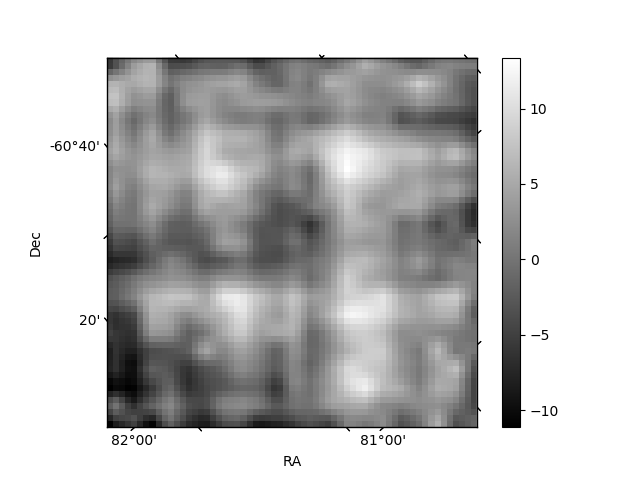
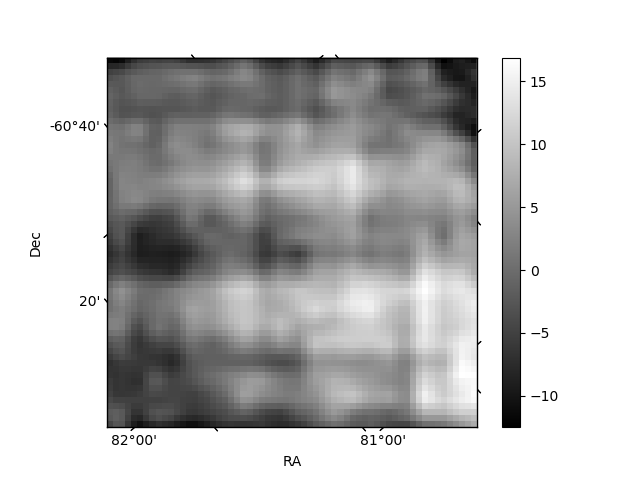
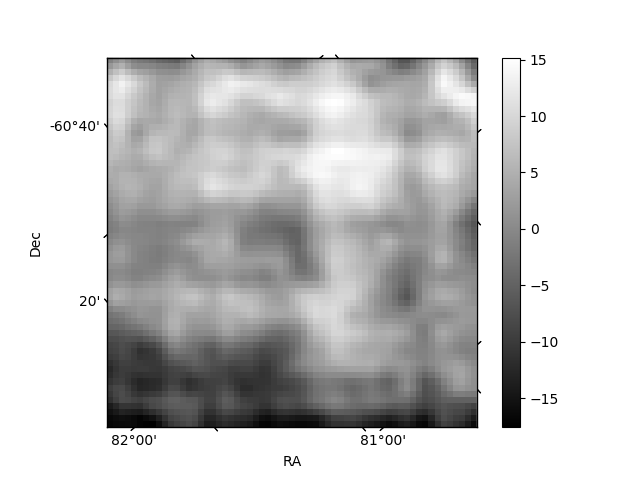
Histogram calculated using DETX and DETY for each event in the final _common_clean file
| Quadrant A | 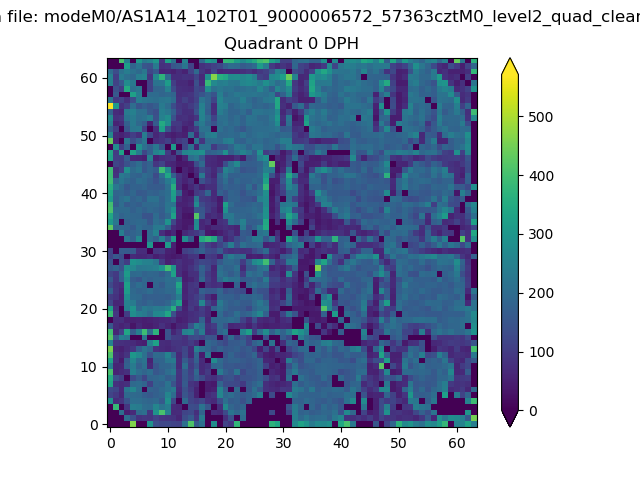 |
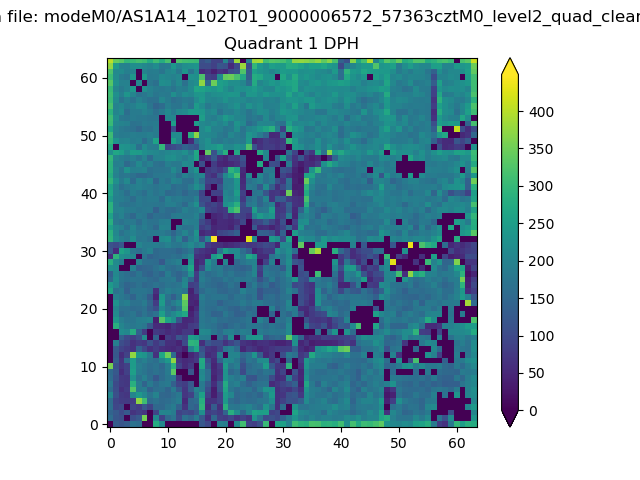 |
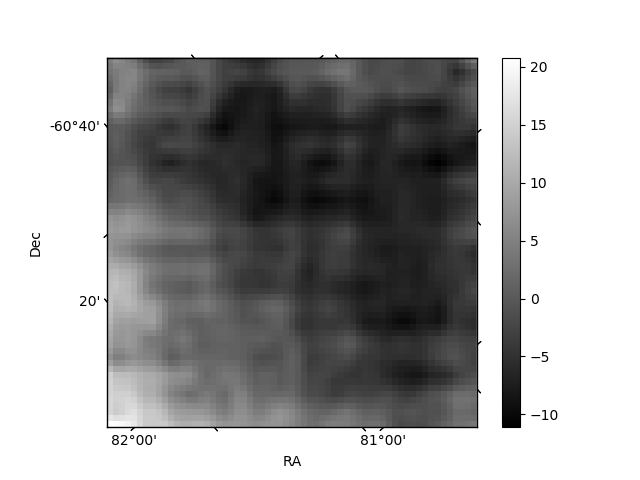
Quadrant B |
|---|---|---|---|
| Quadrant D | 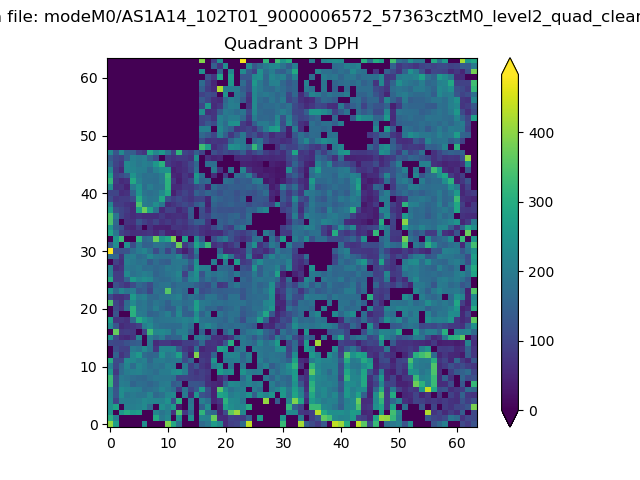 |
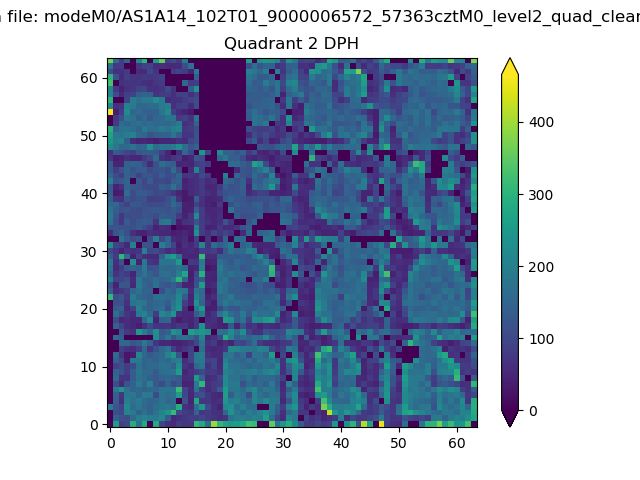 |
Quadrant C |
| Plot type | Count rate plots | Images |
|---|---|---|
| Comparison with Poisson distribution Blue bars denote a histogram of data divided into 1 sec bins. Red curve is a Poisson curve with rate = median count rate of data. |
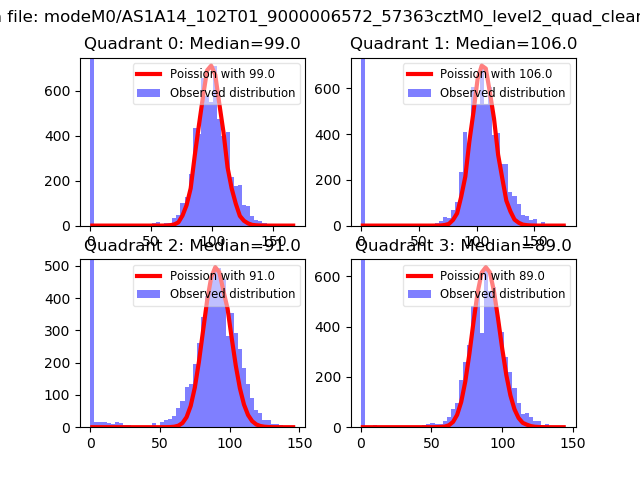 |
 |
| Quadrant-wise count rates Data is divided into 100 sec bins |
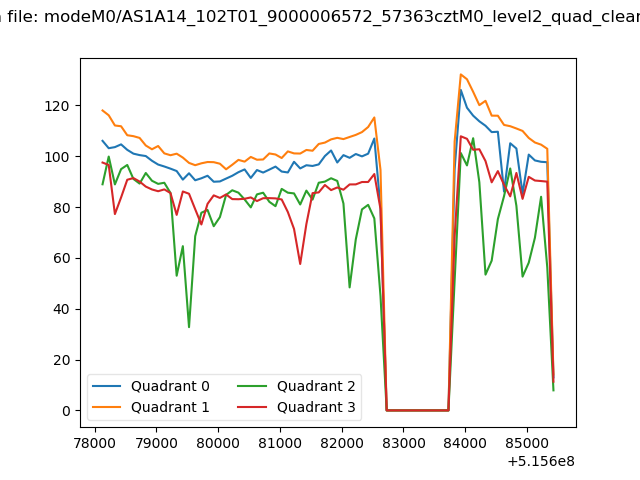 |
|
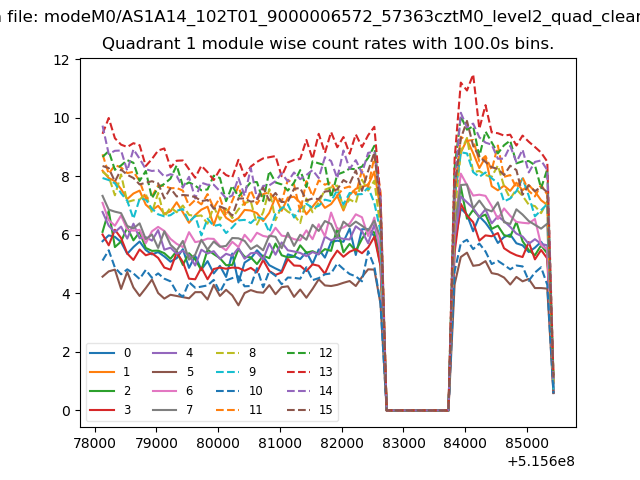
| Module-wise count rates for Quadrant A Data is divided into 100 sec bins |
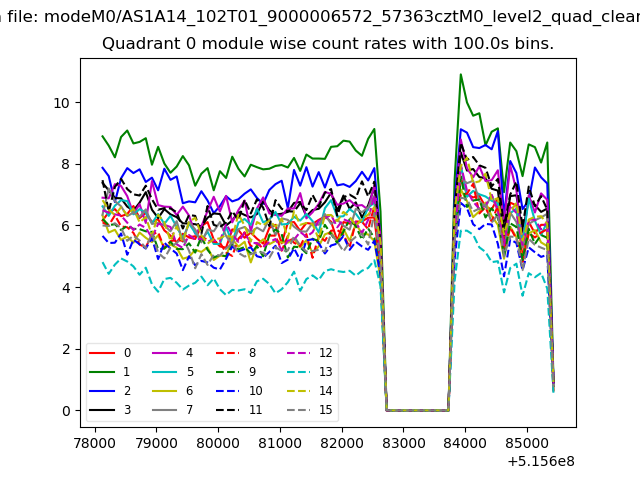 |
 |
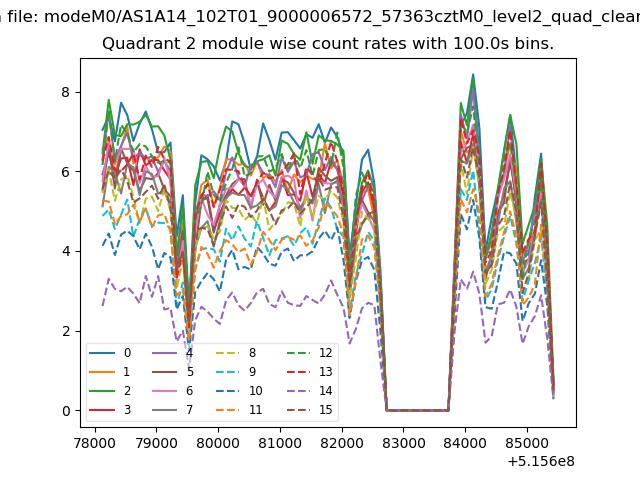
| Module-wise count rates for Quadrant B Data is divided into 100 sec bins |
 |
 |
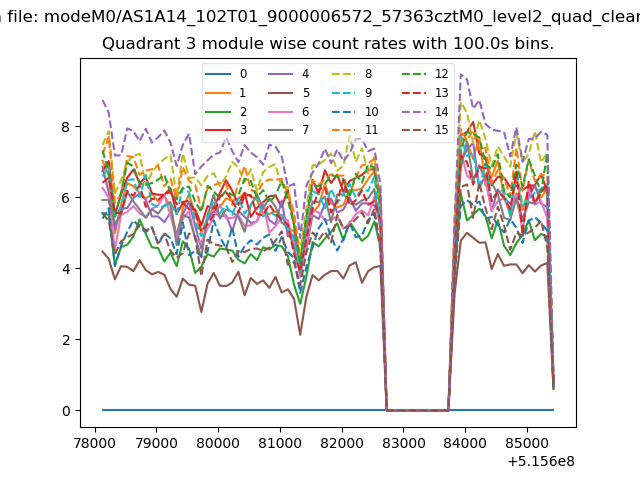
| Module-wise count rates for Quadrant C Data is divided into 100 sec bins |
 |
 |
| Module-wise count rates for Quadrant D Data is divided into 100 sec bins |
 |
 |
| Parameter | Plot |
|---|---|
| CZT HV Monitor |  |
| D_VDD | 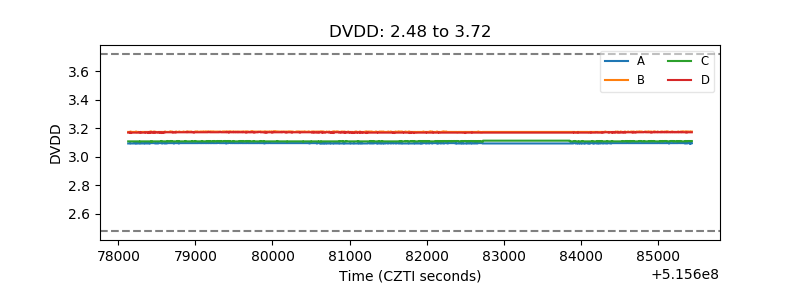 |
| Temperature 1 | 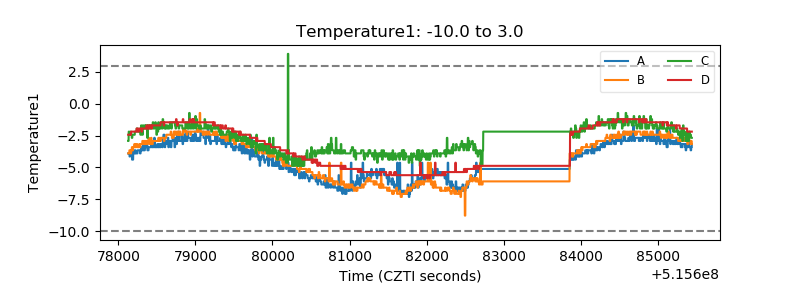 |
| Veto HV Monitor | 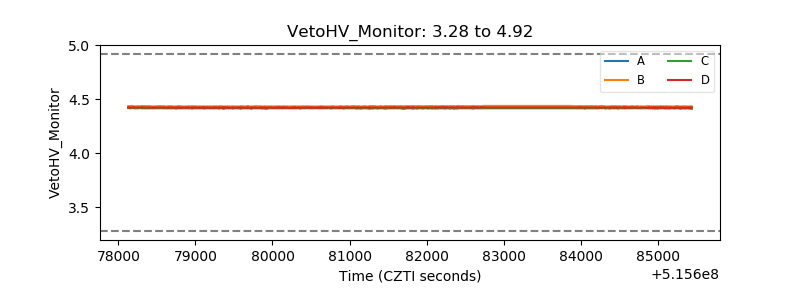 |
| Veto LLD | 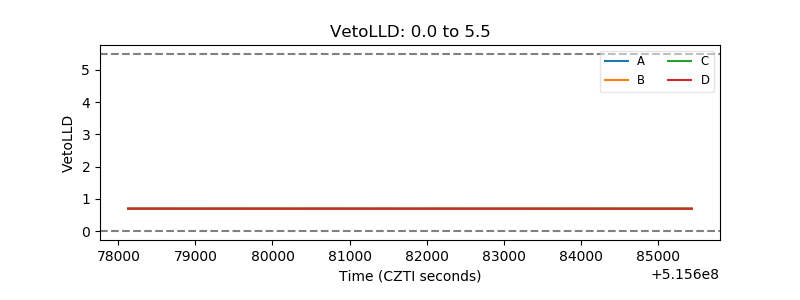 |
| Alpha Counter | 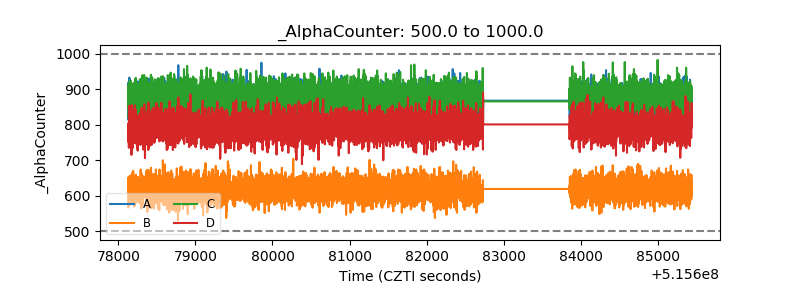 |
| _CPM_Rate | 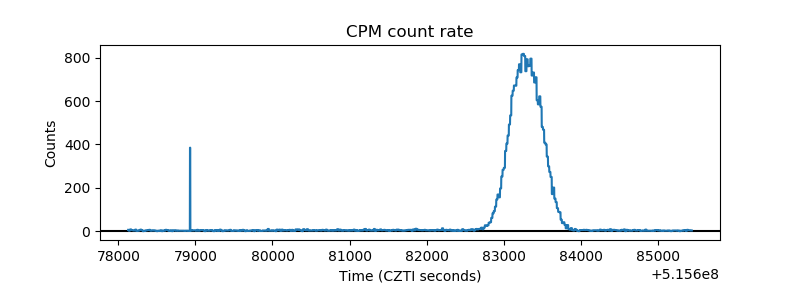 |
| CZT Counter | 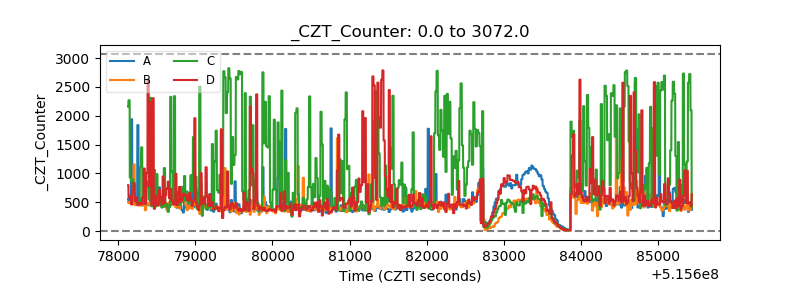 |
| +2.5 Volts monitor |  |
| +5 Volts monitor |  |
| _ROLL_ROT | 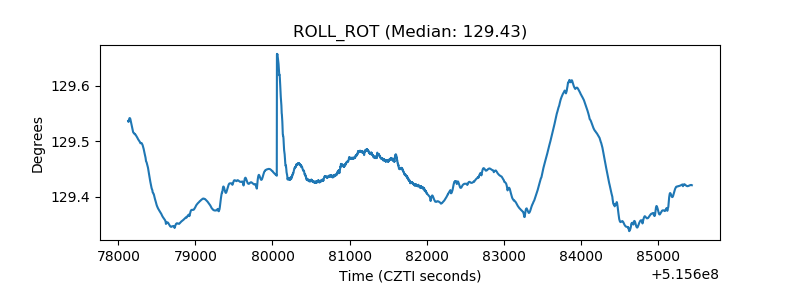 |
| _Roll_DEC | 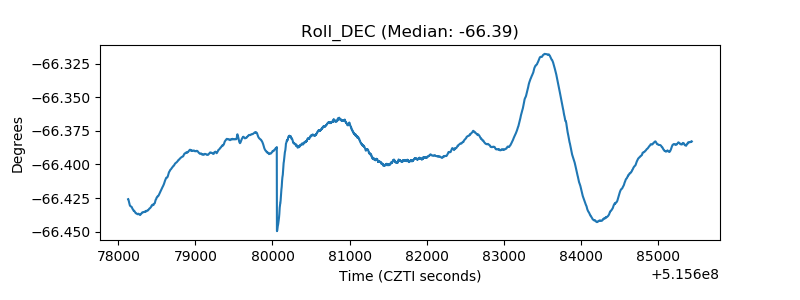 |
| _Roll_RA | 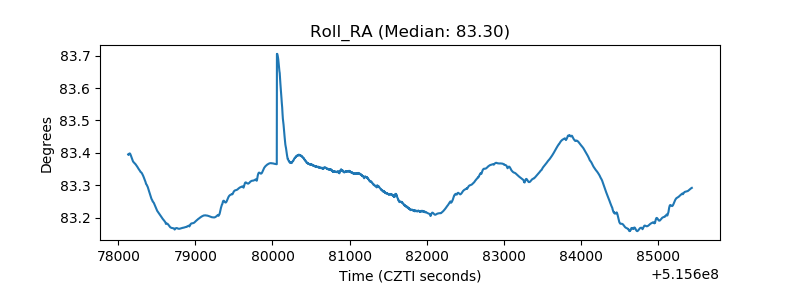 |
| Veto Counter | 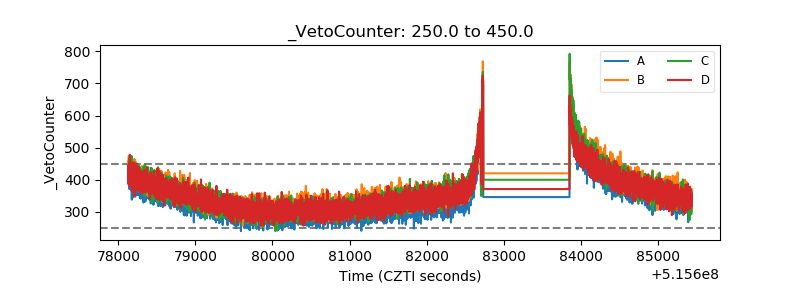 |