| Param | Original file | Final file |
|---|---|---|
| Filename | modeM0/AS1A14_102T01_9000006572_57365cztM0_level2.fits | modeM0/AS1A14_102T01_9000006572_57365cztM0_level2_quad_clean.evt |
| Size (bytes) | 478,431,360 | 78,076,800 |
| Size | 456.3 MB | 74.5 MB |
| Events in quadrant A | 3,022,688 | 531,363 |
| Events in quadrant B | 2,930,961 | 570,855 |
| Events in quadrant C | 7,555,314 | 376,104 |
| Events in quadrant D | 3,733,308 | 465,673 |
| Mode M0 | |||
|---|---|---|---|
| Quadrant | BADHDUFLAG | Total packets | Discarded packets |
| A | 0 | 13275 | 1 |
| B | 0 | 13093 | 3 |
| C | 0 | 26706 | 1 |
| D | 0 | 15334 | 9 |
| Mode M9 | |||
|---|---|---|---|
| Quadrant | BADHDUFLAG | Total packets | Discarded packets |
| A | 0 | 12 | 0 |
| B | 0 | 12 | 0 |
| C | 0 | 12 | 0 |
| D | 0 | 12 | 0 |
| Mode SS | |||
|---|---|---|---|
| Quadrant | BADHDUFLAG | Total packets | Discarded packets |
| A | 0 | 122 | 0 |
| B | 0 | 122 | 0 |
| C | 0 | 122 | 0 |
| D | 0 | 122 | 0 |
| Quadrant | Total seconds | Saturated seconds | Saturation percentage |
|---|---|---|---|
| A | 6013 | 70 | 1.164144% |
| B | 6012 | 87 | 1.447106% |
| C | 6014 | 1739 | 28.915863% |
| D | 6013 | 207 | 3.442541% |
Noise dominated data is calculated using 1-second bins in cleaned event files. If a bin has >2000 counts, and if more than 50% of those come from <1% of pixels, then it is considered to be noise-dominated and hence unusable.
| Quadrant | # 1 sec bins | Bins with >0 counts | Bins with >2000 counts | High rate bins dominated by noise | Noise dominated (total time) | Noise dominated (detector-on time) | Marked lightcurve |
|---|---|---|---|---|---|---|---|
| A | 7453 | 6293 | 16 | 16 | 0.21% | 0.25% | 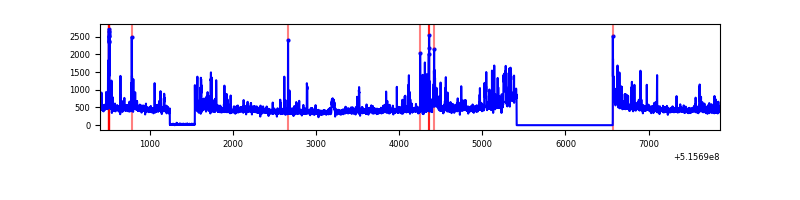 |
| B | 7453 | 6293 | 33 | 33 | 0.44% | 0.52% | 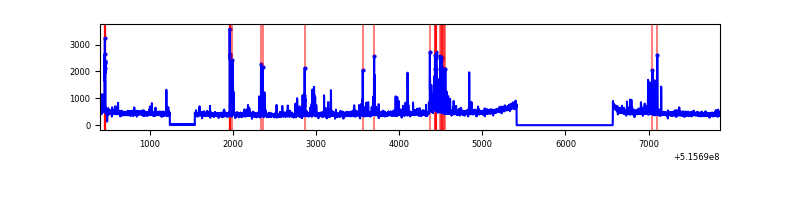 |
| C | 7454 | 6288 | 1528 | 1528 | 20.50% | 24.30% | 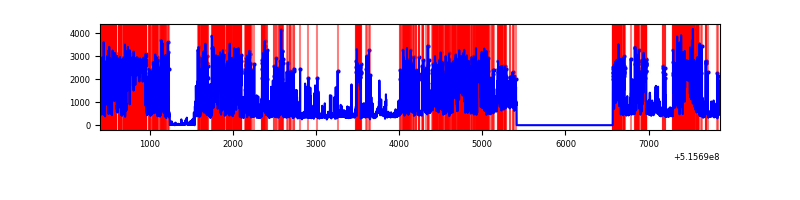 |
| D | 7454 | 6295 | 196 | 196 | 2.63% | 3.11% | 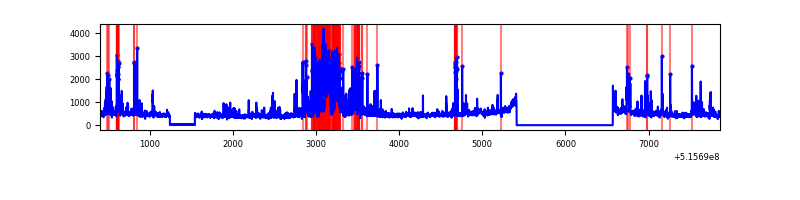 |
Top three noisy pixels from each quadrant. If the there are fewer than three noisy pixels in the level2.evt file, extra rows are filled as -1
| Pixel properties | Quadrant properties | ||||||
|---|---|---|---|---|---|---|---|
| Quadrant | DetID | PixID | Counts | Sigma | Mean | Median | Sigma |
| A | 8 | 4 | 149956 | 909.18 | 661 | 644 | 164.2 |
| A | 3 | 14 | 118005 | 714.63 | 661 | 644 | 164.2 |
| A | 3 | 61 | 81593 | 492.91 | 661 | 644 | 164.2 |
| B | 5 | 185 | 245289 | 1767.67 | 650 | 627 | 138.4 |
| B | 0 | 153 | 37363 | 265.42 | 650 | 627 | 138.4 |
| B | 7 | 252 | 26227 | 184.96 | 650 | 627 | 138.4 |
| C | 15 | 224 | 4824480 | 33201.23 | 532 | 526 | 145.3 |
| C | 8 | 7 | 260620 | 1790.12 | 532 | 526 | 145.3 |
| C | 12 | 254 | 119188 | 816.7 | 532 | 526 | 145.3 |
| D | 2 | 249 | 651274 | 3669.4 | 625 | 597 | 177.3 |
| D | 8 | 240 | 209617 | 1178.74 | 625 | 597 | 177.3 |
| D | 15 | 142 | 173580 | 975.51 | 625 | 597 | 177.3 |
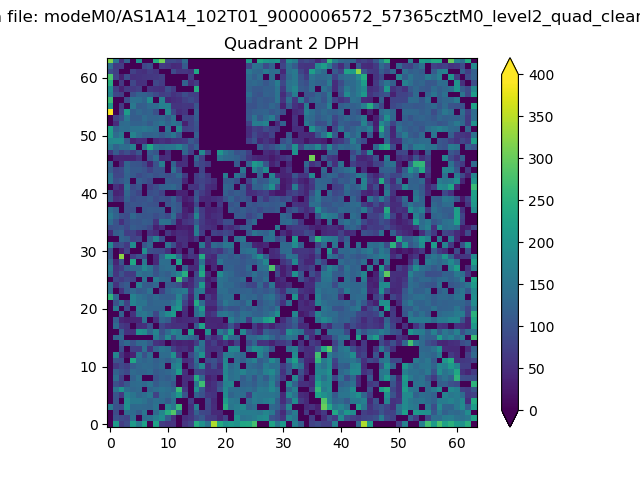
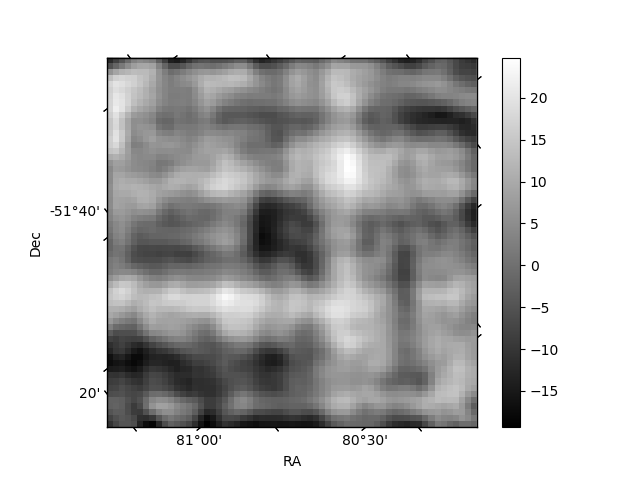
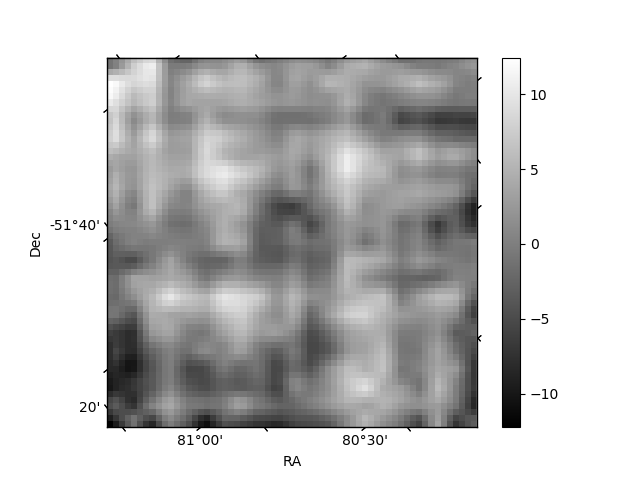
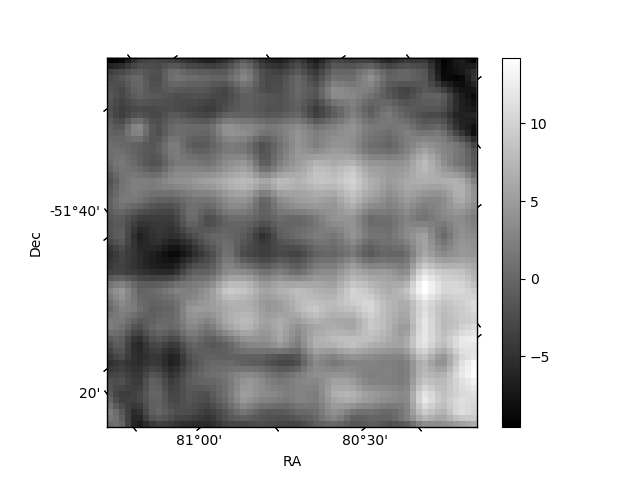
Histogram calculated using DETX and DETY for each event in the final _common_clean file
| Quadrant A | 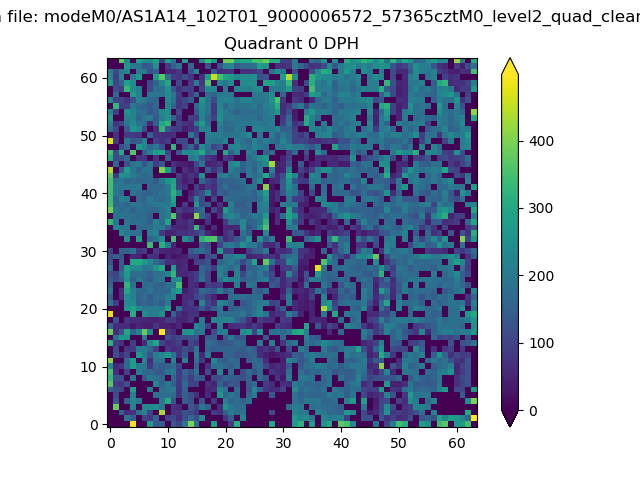 |
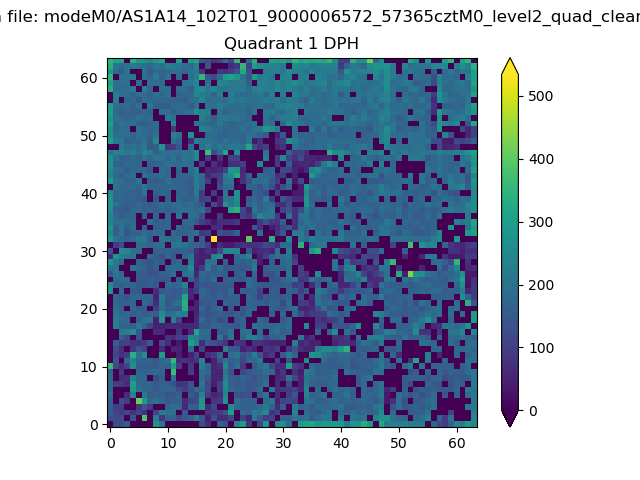 |
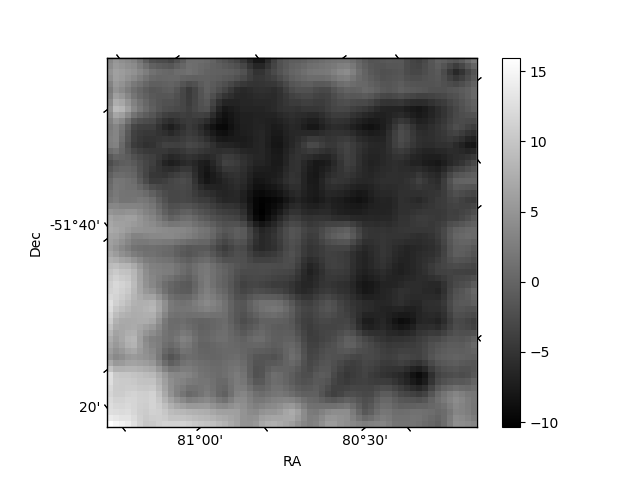
Quadrant B |
|---|---|---|---|
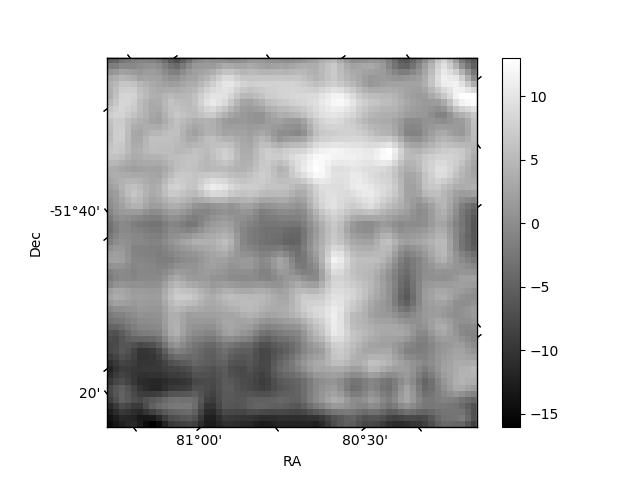
| Quadrant D | 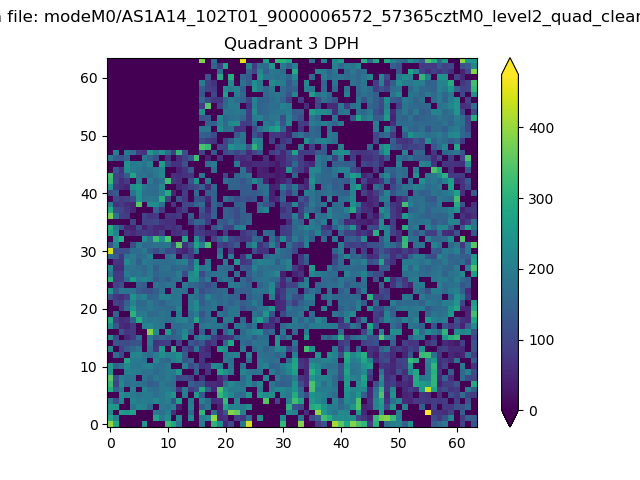 |
 |
Quadrant C |
| Plot type | Count rate plots | Images |
|---|---|---|
| Comparison with Poisson distribution Blue bars denote a histogram of data divided into 1 sec bins. Red curve is a Poisson curve with rate = median count rate of data. |
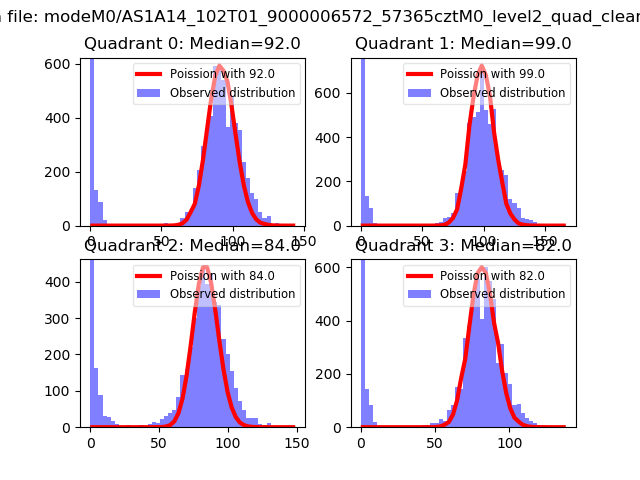 |
 |
| Quadrant-wise count rates Data is divided into 100 sec bins |
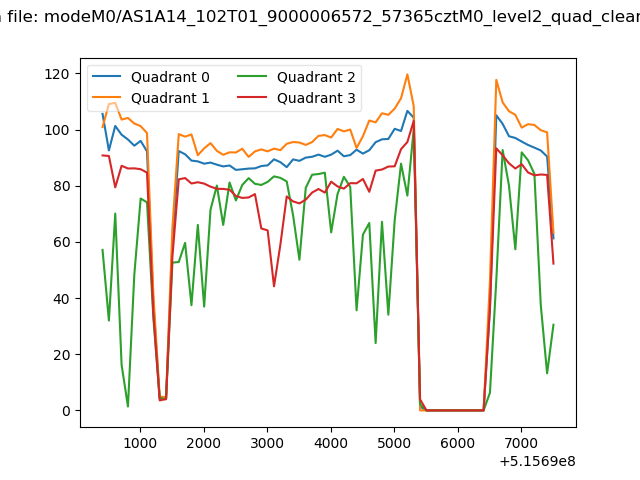 |
|
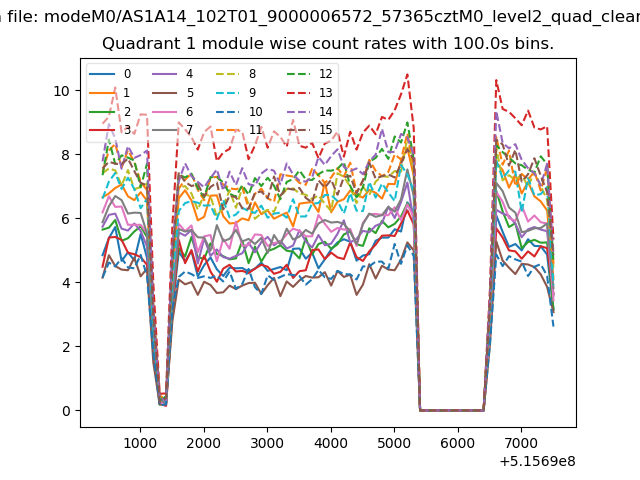
| Module-wise count rates for Quadrant A Data is divided into 100 sec bins |
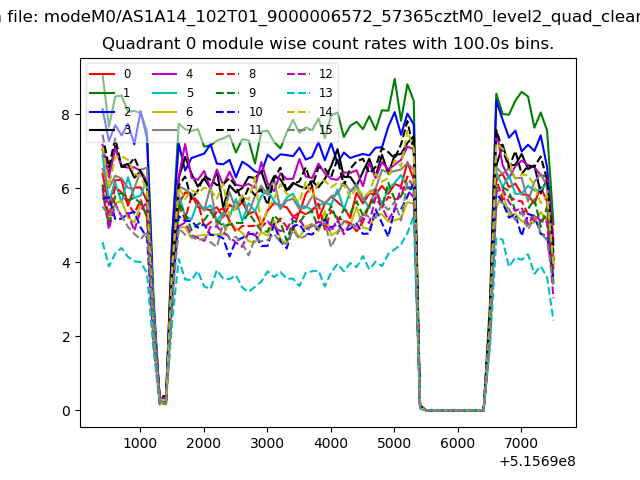 |
 |
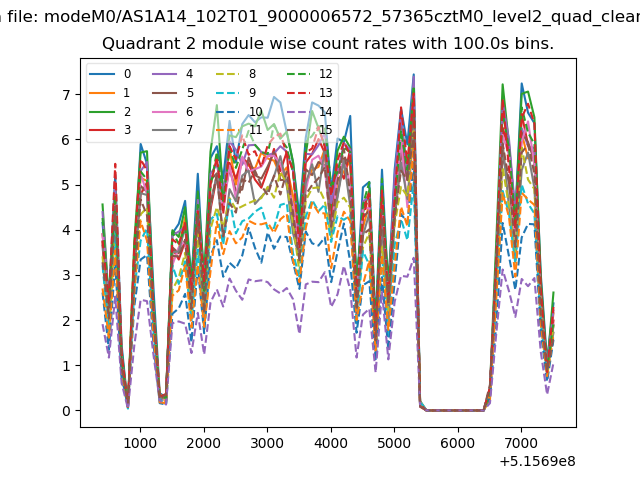
| Module-wise count rates for Quadrant B Data is divided into 100 sec bins |
 |
 |
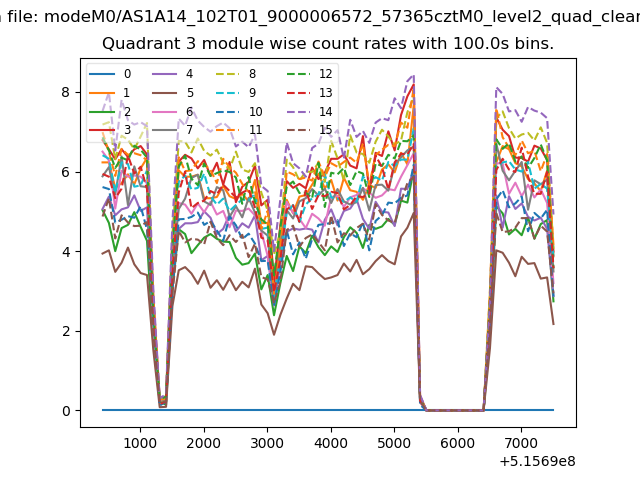
| Module-wise count rates for Quadrant C Data is divided into 100 sec bins |
 |
 |
| Module-wise count rates for Quadrant D Data is divided into 100 sec bins |
 |
 |
| Parameter | Plot |
|---|---|
| CZT HV Monitor |  |
| D_VDD | 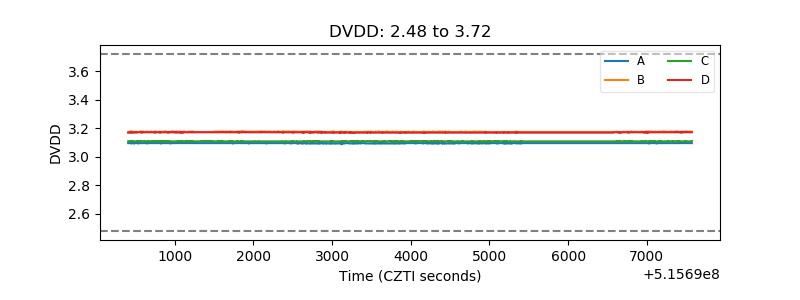 |
| Temperature 1 | 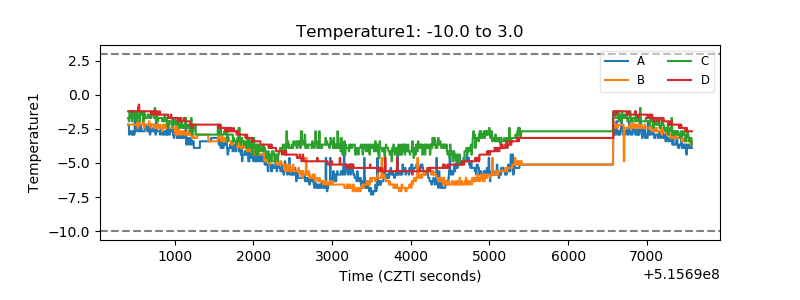 |
| Veto HV Monitor | 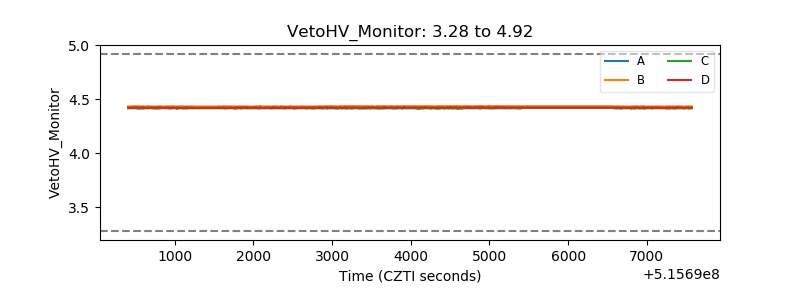 |
| Veto LLD | 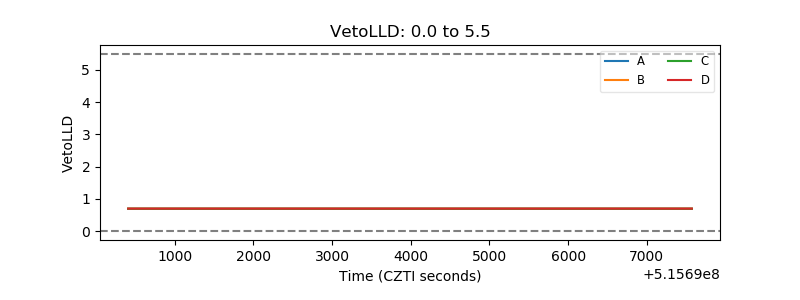 |
| Alpha Counter | 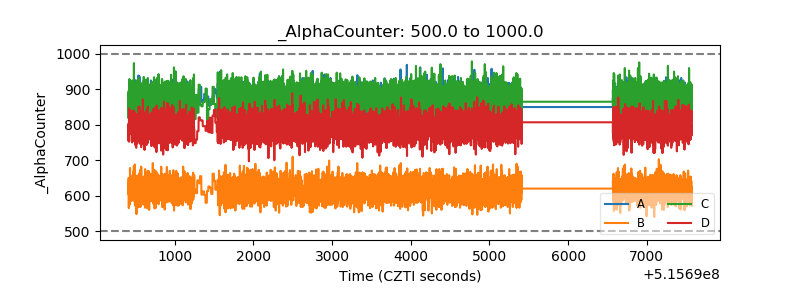 |
| _CPM_Rate | 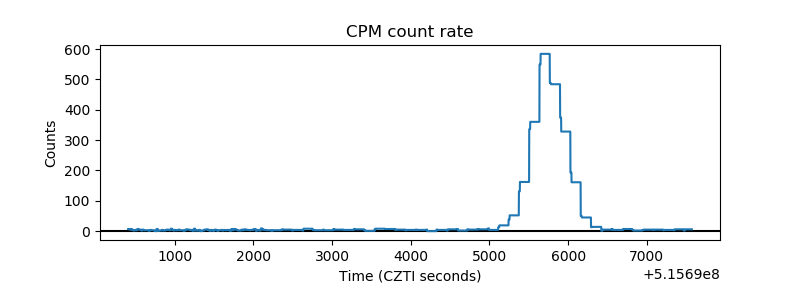 |
| CZT Counter | 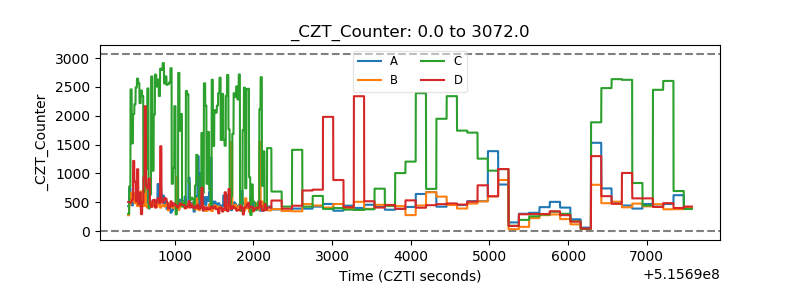 |
| +2.5 Volts monitor | 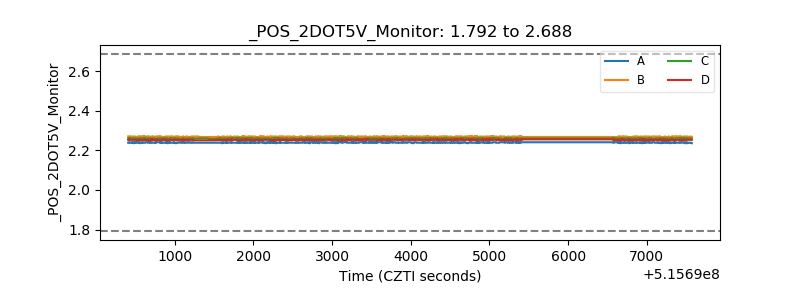 |
| +5 Volts monitor | 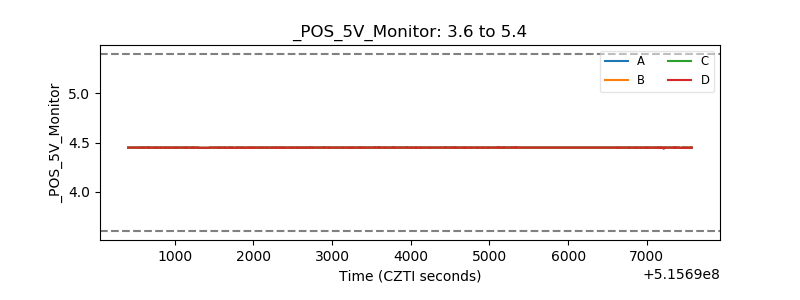 |
| _ROLL_ROT | 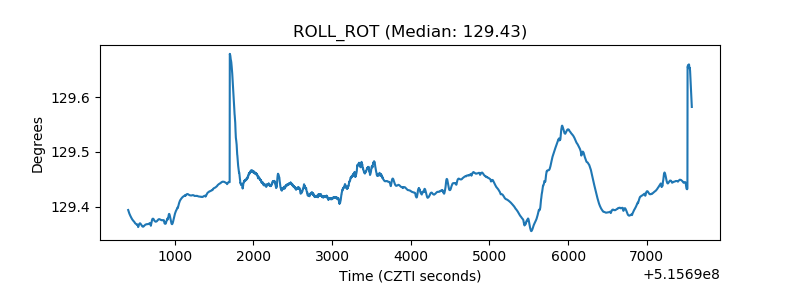 |
| _Roll_DEC | 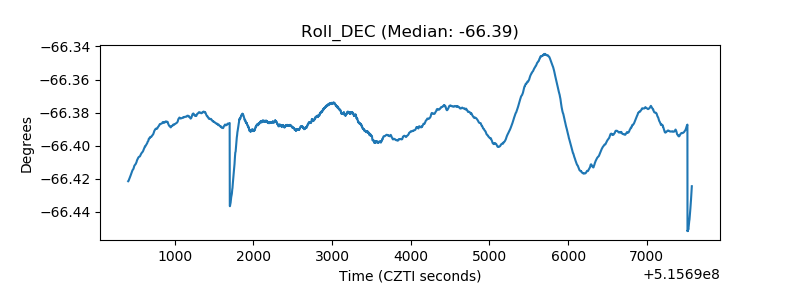 |
| _Roll_RA | 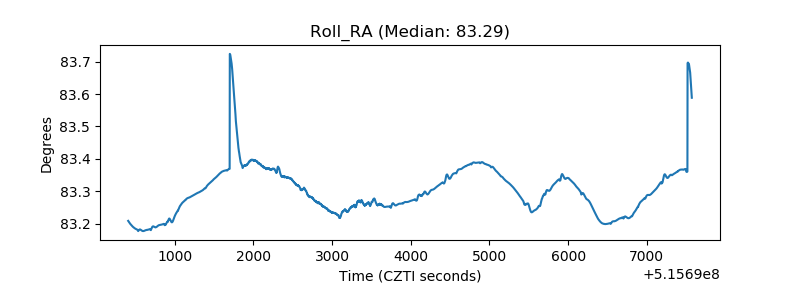 |
| Veto Counter | 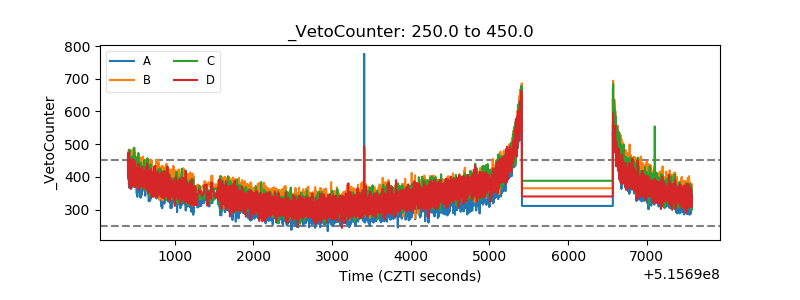 |