| Param | Original file | Final file |
|---|---|---|
| Filename | modeM0/AS1A14_102T01_9000006572_57366cztM0_level2.fits | modeM0/AS1A14_102T01_9000006572_57366cztM0_level2_quad_clean.evt |
| Size (bytes) | 505,638,720 | 80,913,600 |
| Size | 482.2 MB | 77.2 MB |
| Events in quadrant A | 2,918,221 | 564,763 |
| Events in quadrant B | 2,971,721 | 604,462 |
| Events in quadrant C | 8,825,410 | 369,233 |
| Events in quadrant D | 3,513,468 | 473,258 |
| Mode M0 | |||
|---|---|---|---|
| Quadrant | BADHDUFLAG | Total packets | Discarded packets |
| A | 0 | 13291 | 16 |
| B | 0 | 13439 | 12 |
| C | 0 | 30672 | 104 |
| D | 0 | 15093 | 31 |
| Mode M9 | |||
|---|---|---|---|
| Quadrant | BADHDUFLAG | Total packets | Discarded packets |
| A | 0 | 10 | 0 |
| B | 0 | 10 | 0 |
| C | 0 | 10 | 0 |
| D | 0 | 10 | 0 |
| Mode SS | |||
|---|---|---|---|
| Quadrant | BADHDUFLAG | Total packets | Discarded packets |
| A | 0 | 128 | 0 |
| B | 0 | 128 | 0 |
| C | 0 | 128 | 0 |
| D | 0 | 128 | 0 |
| Quadrant | Total seconds | Saturated seconds | Saturation percentage |
|---|---|---|---|
| A | 6277 | 27 | 0.430142% |
| B | 6278 | 60 | 0.955718% |
| C | 6269 | 2285 | 36.449194% |
| D | 6271 | 186 | 2.966034% |
Noise dominated data is calculated using 1-second bins in cleaned event files. If a bin has >2000 counts, and if more than 50% of those come from <1% of pixels, then it is considered to be noise-dominated and hence unusable.
| Quadrant | # 1 sec bins | Bins with >0 counts | Bins with >2000 counts | High rate bins dominated by noise | Noise dominated (total time) | Noise dominated (detector-on time) | Marked lightcurve |
|---|---|---|---|---|---|---|---|
| A | 7602 | 6563 | 5 | 5 | 0.07% | 0.08% | 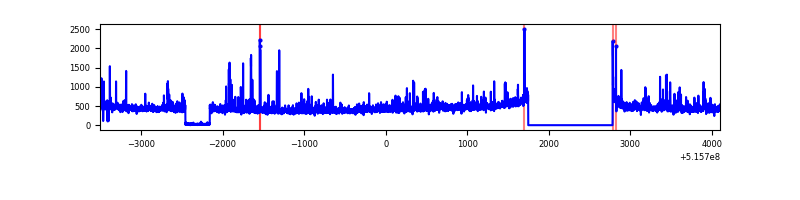 |
| B | 7602 | 6563 | 15 | 15 | 0.20% | 0.23% | 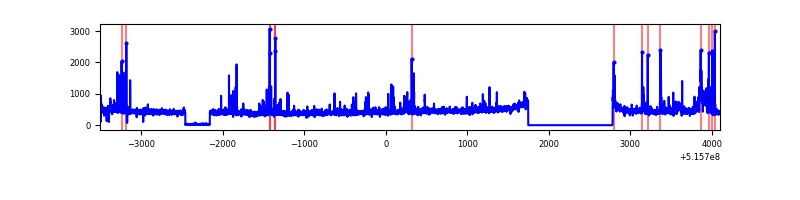 |
| C | 7601 | 6546 | 1979 | 1979 | 26.04% | 30.23% | 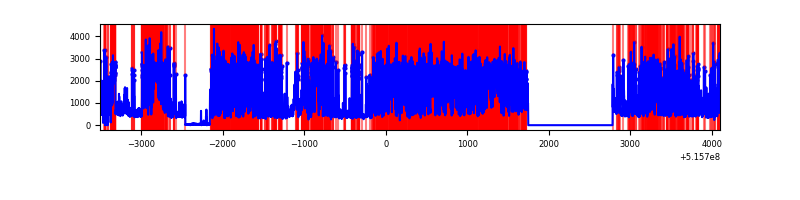 |
| D | 7602 | 6562 | 194 | 194 | 2.55% | 2.96% | 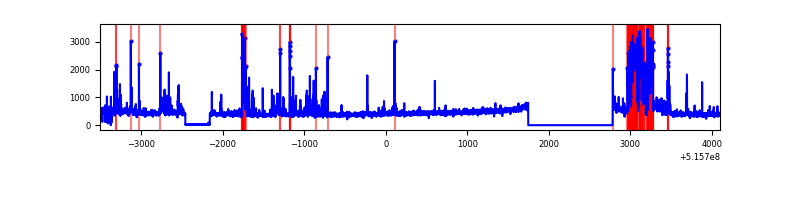 |
Top three noisy pixels from each quadrant. If the there are fewer than three noisy pixels in the level2.evt file, extra rows are filled as -1
| Pixel properties | Quadrant properties | ||||||
|---|---|---|---|---|---|---|---|
| Quadrant | DetID | PixID | Counts | Sigma | Mean | Median | Sigma |
| A | 8 | 4 | 139007 | 827.39 | 677 | 659 | 167.2 |
| A | 0 | 12 | 61793 | 365.61 | 677 | 659 | 167.2 |
| A | 3 | 14 | 24502 | 142.59 | 677 | 659 | 167.2 |
| B | 5 | 185 | 111583 | 770.67 | 670 | 646 | 143.9 |
| B | 0 | 213 | 90910 | 627.06 | 670 | 646 | 143.9 |
| B | 7 | 252 | 24341 | 164.61 | 670 | 646 | 143.9 |
| C | 15 | 224 | 6175928 | 43475.76 | 522 | 517 | 142.0 |
| C | 14 | 254 | 136040 | 954.1 | 522 | 517 | 142.0 |
| C | 12 | 2 | 121658 | 852.85 | 522 | 517 | 142.0 |
| D | 3 | 224 | 526506 | 2912.84 | 639 | 608 | 180.5 |
| D | 8 | 240 | 123785 | 682.25 | 639 | 608 | 180.5 |
| D | 12 | 191 | 103619 | 570.56 | 639 | 608 | 180.5 |
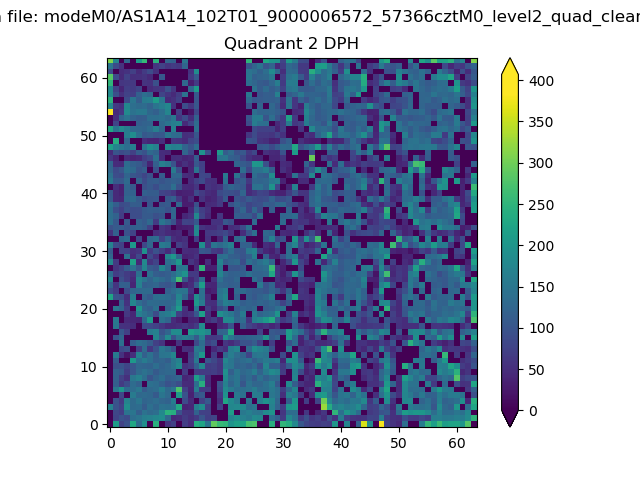
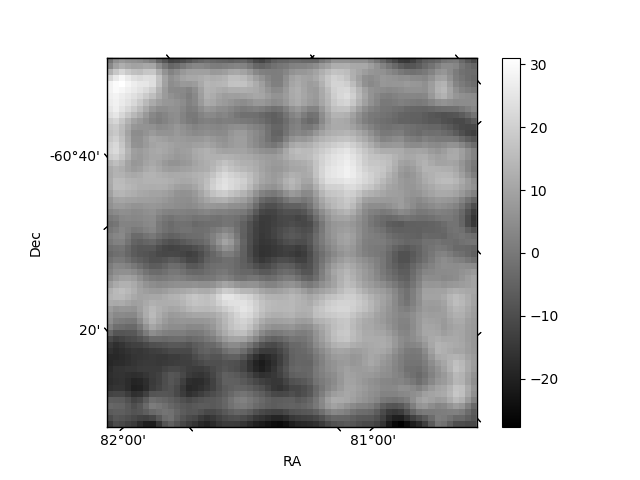
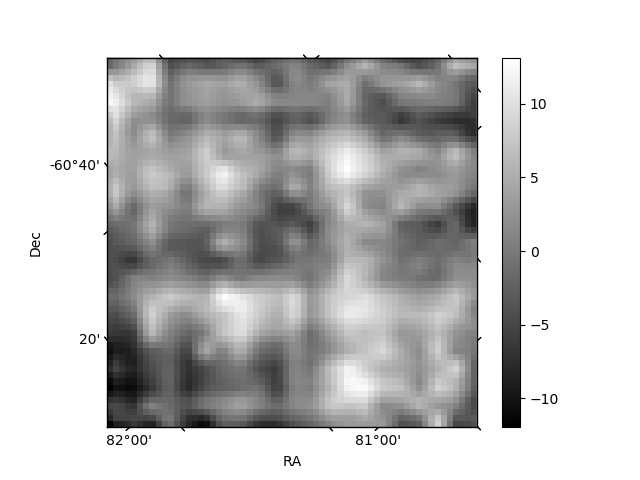
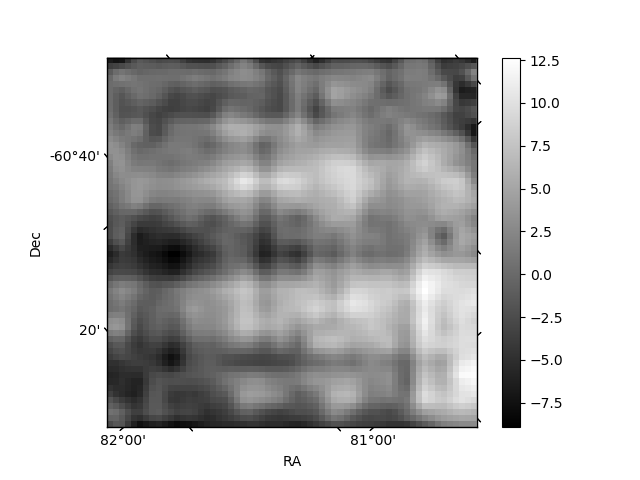
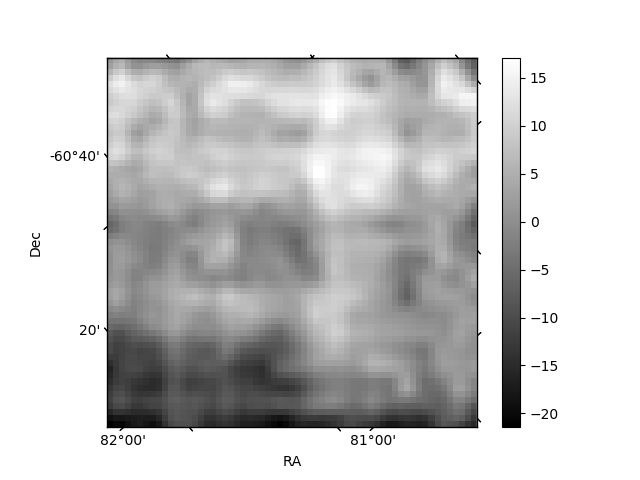
Histogram calculated using DETX and DETY for each event in the final _common_clean file
| Quadrant A | 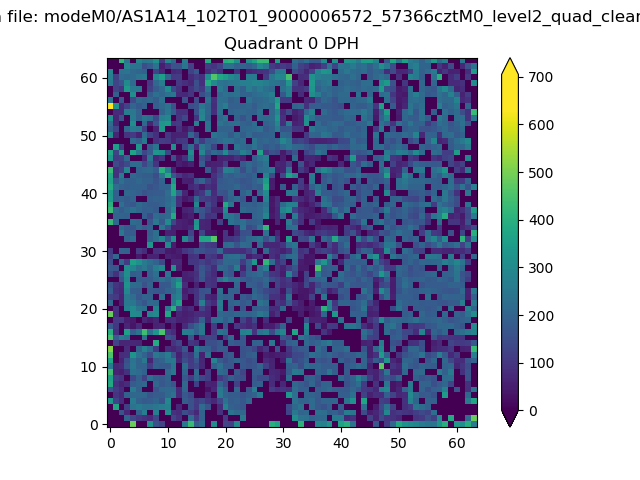 |
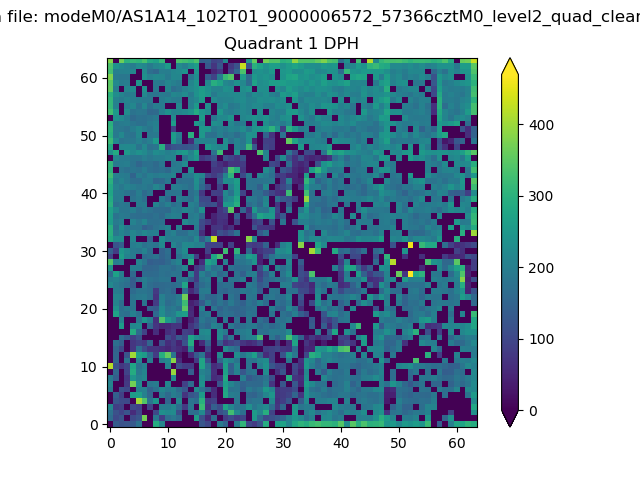 |
Quadrant B |
|---|---|---|---|
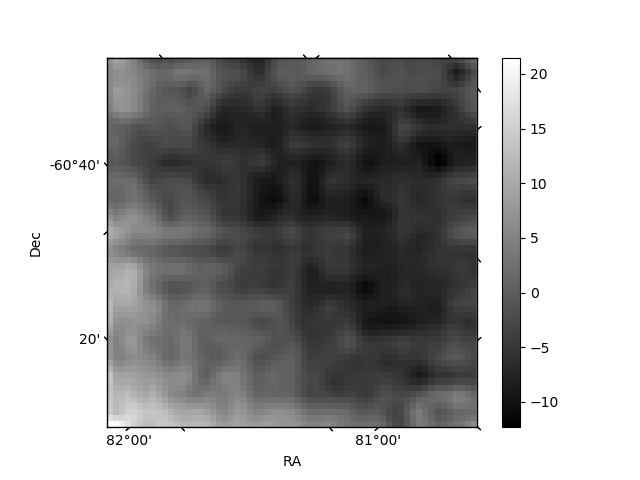
| Quadrant D | 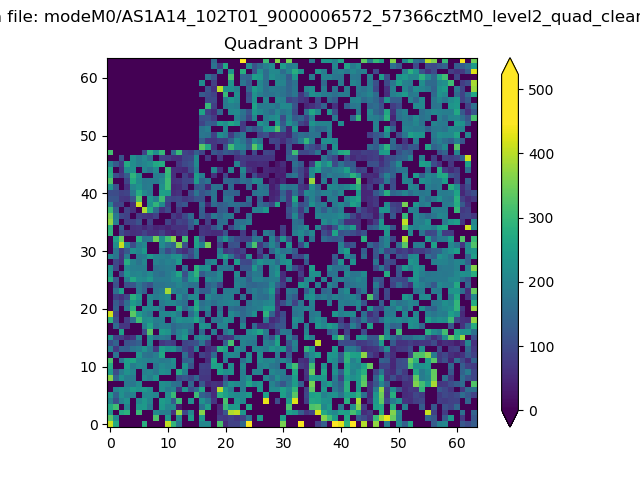 |
 |
Quadrant C |
| Plot type | Count rate plots | Images |
|---|---|---|
| Comparison with Poisson distribution Blue bars denote a histogram of data divided into 1 sec bins. Red curve is a Poisson curve with rate = median count rate of data. |
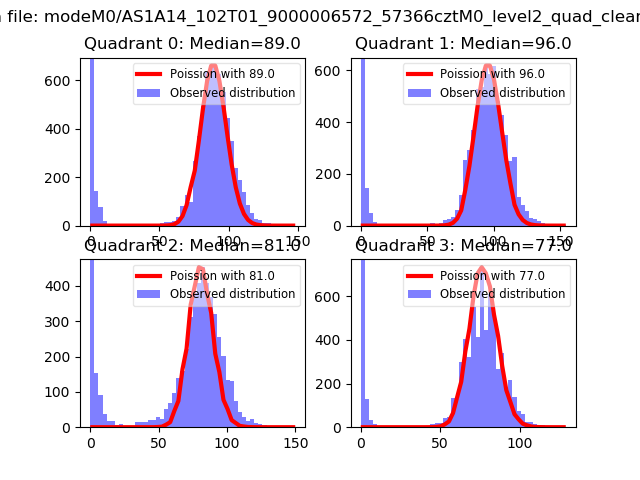 |
 |
| Quadrant-wise count rates Data is divided into 100 sec bins |
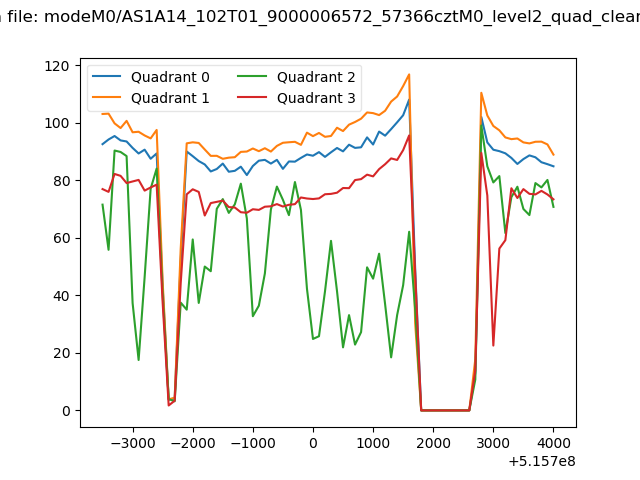 |
|
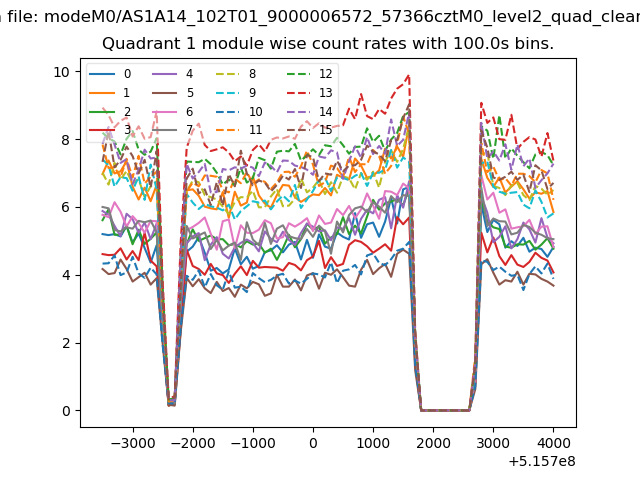
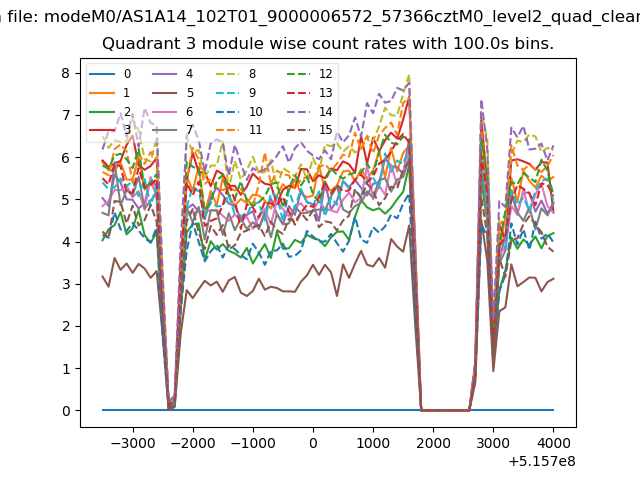
| Module-wise count rates for Quadrant A Data is divided into 100 sec bins |
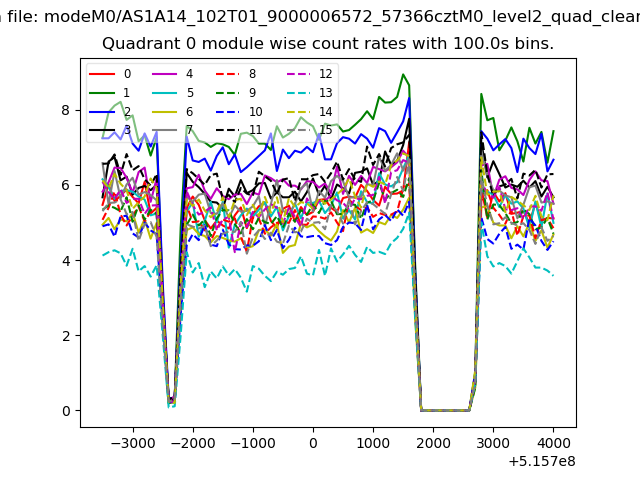 |
 |
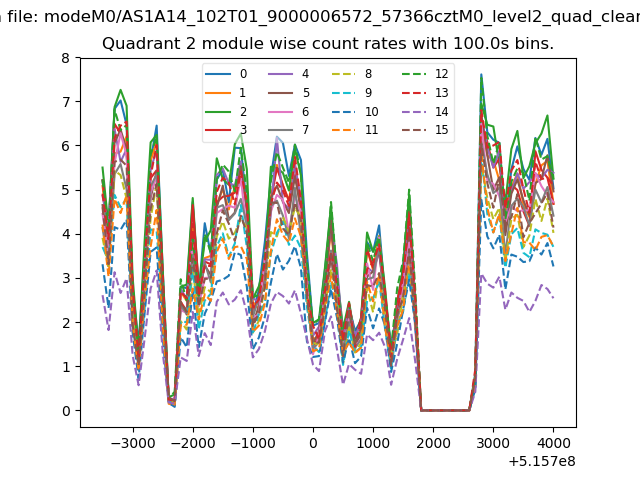
| Module-wise count rates for Quadrant B Data is divided into 100 sec bins |
 |
 |
| Module-wise count rates for Quadrant C Data is divided into 100 sec bins |
 |
 |
| Module-wise count rates for Quadrant D Data is divided into 100 sec bins |
 |
 |
| Parameter | Plot |
|---|---|
| CZT HV Monitor | 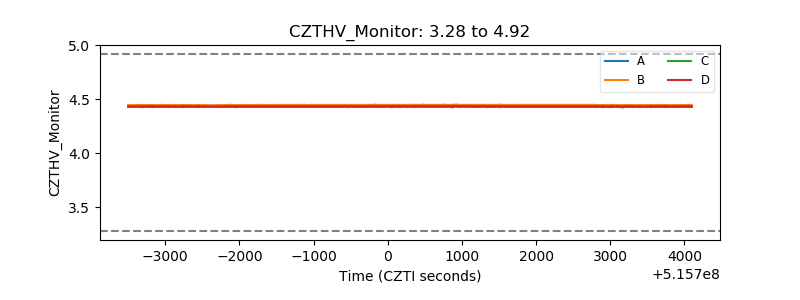 |
| D_VDD | 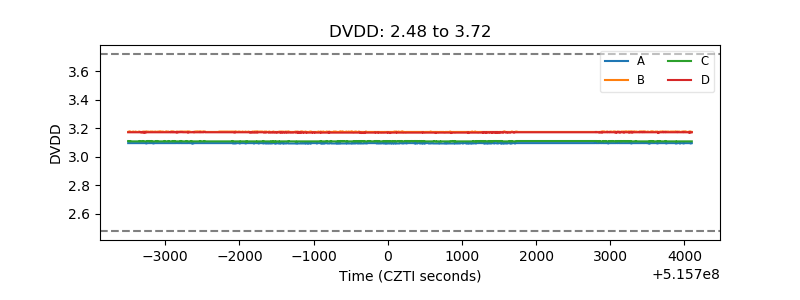 |
| Temperature 1 | 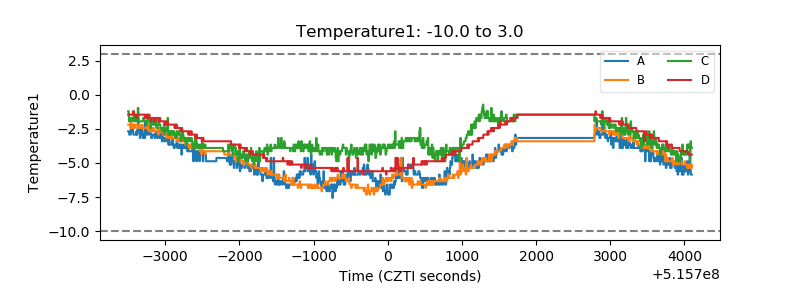 |
| Veto HV Monitor |  |
| Veto LLD | 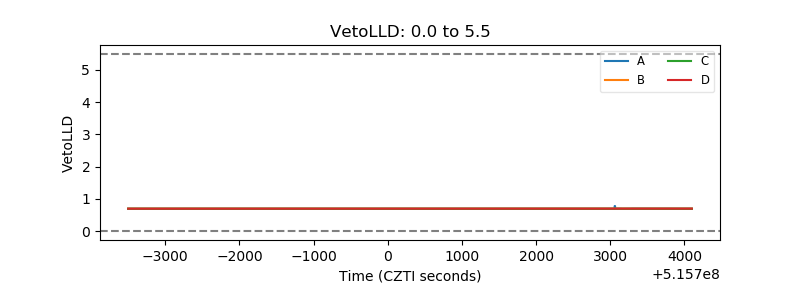 |
| Alpha Counter | 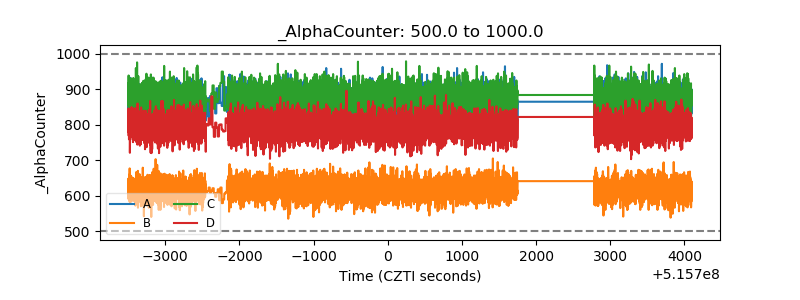 |
| _CPM_Rate | 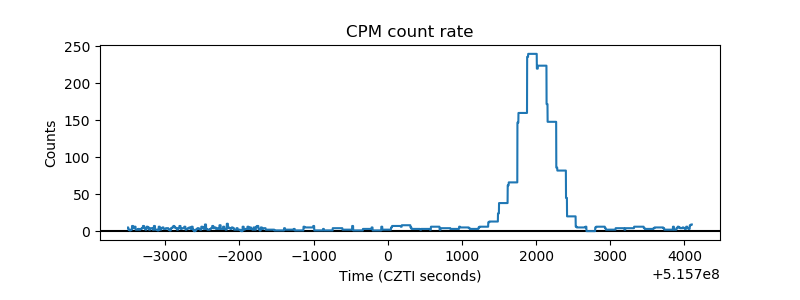 |
| CZT Counter | 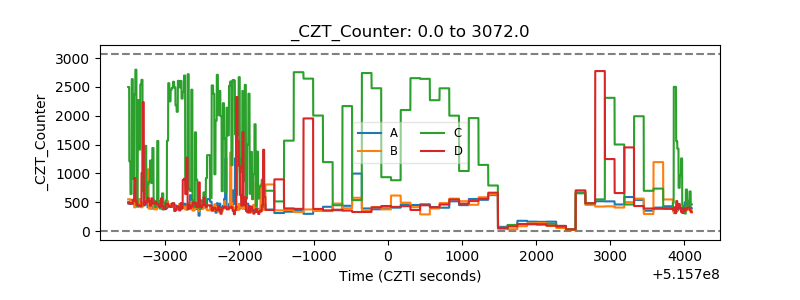 |
| +2.5 Volts monitor |  |
| +5 Volts monitor | 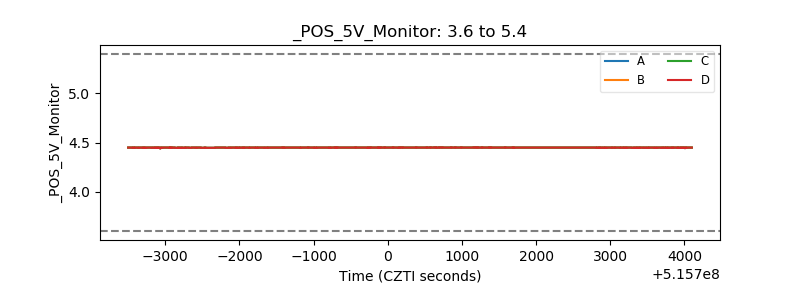 |
| _ROLL_ROT | 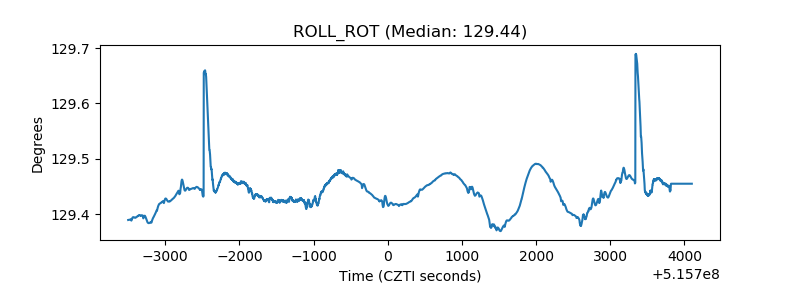 |
| _Roll_DEC | 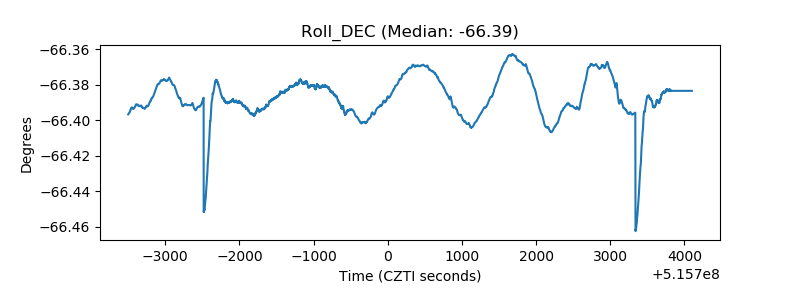 |
| _Roll_RA | 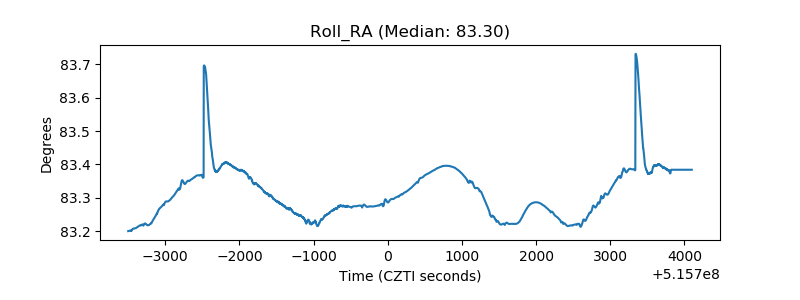 |
| Veto Counter | 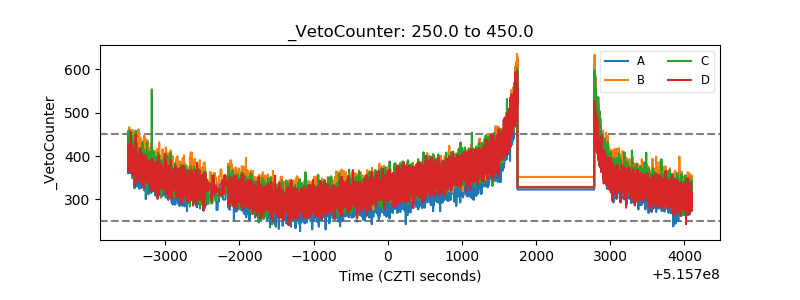 |