| Param | Original file | Final file |
|---|---|---|
| Filename | modeM0/AS1A14_102T01_9000006572_57370cztM0_level2.fits | modeM0/AS1A14_102T01_9000006572_57370cztM0_level2_quad_clean.evt |
| Size (bytes) | 601,646,400 | 106,179,840 |
| Size | 573.8 MB | 101.3 MB |
| Events in quadrant A | 4,355,498 | 698,319 |
| Events in quadrant B | 4,352,521 | 725,704 |
| Events in quadrant C | 7,988,013 | 590,661 |
| Events in quadrant D | 4,903,230 | 598,980 |
| Mode M0 | |||
|---|---|---|---|
| Quadrant | BADHDUFLAG | Total packets | Discarded packets |
| A | 0 | 19157 | 0 |
| B | 0 | 19331 | 0 |
| C | 0 | 29823 | 0 |
| D | 0 | 20886 | 0 |
| Mode SS | |||
|---|---|---|---|
| Quadrant | BADHDUFLAG | Total packets | Discarded packets |
| A | 0 | 172 | 0 |
| B | 0 | 172 | 0 |
| C | 0 | 172 | 0 |
| D | 0 | 172 | 0 |
| Quadrant | Total seconds | Saturated seconds | Saturation percentage |
|---|---|---|---|
| A | 8657 | 28 | 0.323438% |
| B | 8656 | 115 | 1.328558% |
| C | 8657 | 1015 | 11.724616% |
| D | 8657 | 129 | 1.490124% |
Noise dominated data is calculated using 1-second bins in cleaned event files. If a bin has >2000 counts, and if more than 50% of those come from <1% of pixels, then it is considered to be noise-dominated and hence unusable.
| Quadrant | # 1 sec bins | Bins with >0 counts | Bins with >2000 counts | High rate bins dominated by noise | Noise dominated (total time) | Noise dominated (detector-on time) | Marked lightcurve |
|---|---|---|---|---|---|---|---|
| A | 8939 | 8939 | 7 | 7 | 0.08% | 0.08% | 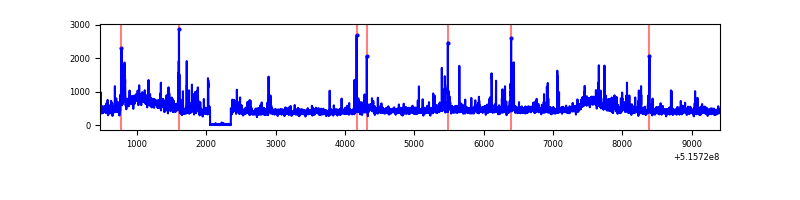 |
| B | 8938 | 8938 | 56 | 56 | 0.63% | 0.63% | 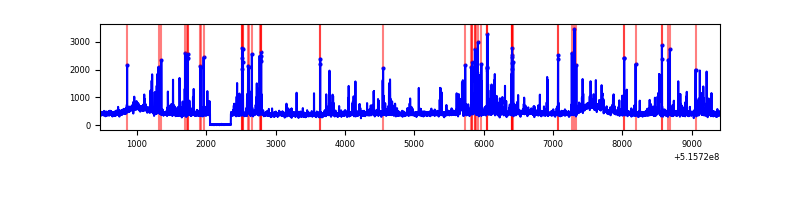 |
| C | 8939 | 8939 | 882 | 882 | 9.87% | 9.87% | 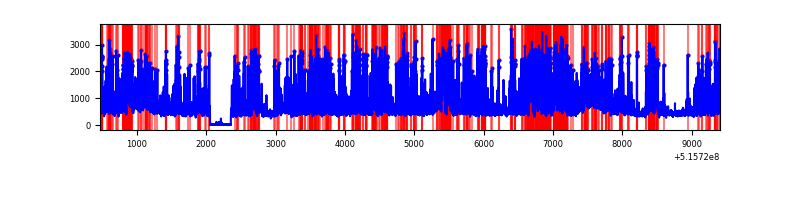 |
| D | 8939 | 8939 | 130 | 130 | 1.45% | 1.45% | 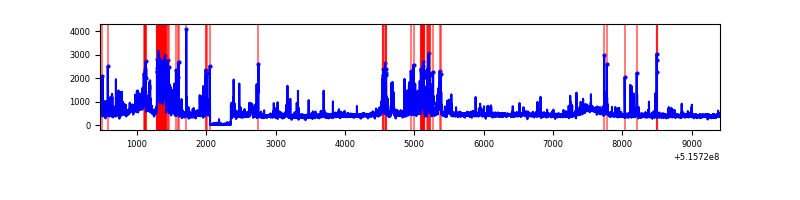 |
Top three noisy pixels from each quadrant. If the there are fewer than three noisy pixels in the level2.evt file, extra rows are filled as -1
| Pixel properties | Quadrant properties | ||||||
|---|---|---|---|---|---|---|---|
| Quadrant | DetID | PixID | Counts | Sigma | Mean | Median | Sigma |
| A | 3 | 14 | 332286 | 1423.76 | 939 | 913 | 232.7 |
| A | 0 | 12 | 163378 | 698.04 | 939 | 913 | 232.7 |
| A | 8 | 4 | 113492 | 483.7 | 939 | 913 | 232.7 |
| B | 5 | 185 | 190816 | 942.73 | 935 | 899 | 201.5 |
| B | 7 | 252 | 90772 | 446.12 | 935 | 899 | 201.5 |
| B | 4 | 201 | 72924 | 357.52 | 935 | 899 | 201.5 |
| C | 15 | 224 | 4114528 | 17414.59 | 869 | 859 | 236.2 |
| C | 12 | 252 | 150582 | 633.83 | 869 | 859 | 236.2 |
| C | 6 | 223 | 69207 | 289.34 | 869 | 859 | 236.2 |
| D | 2 | 249 | 544692 | 2152.06 | 902 | 863 | 252.7 |
| D | 15 | 142 | 274546 | 1083.03 | 902 | 863 | 252.7 |
| D | 8 | 240 | 122996 | 483.31 | 902 | 863 | 252.7 |
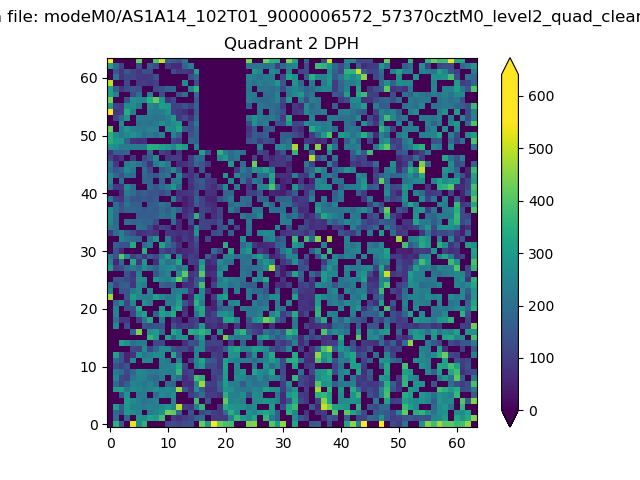
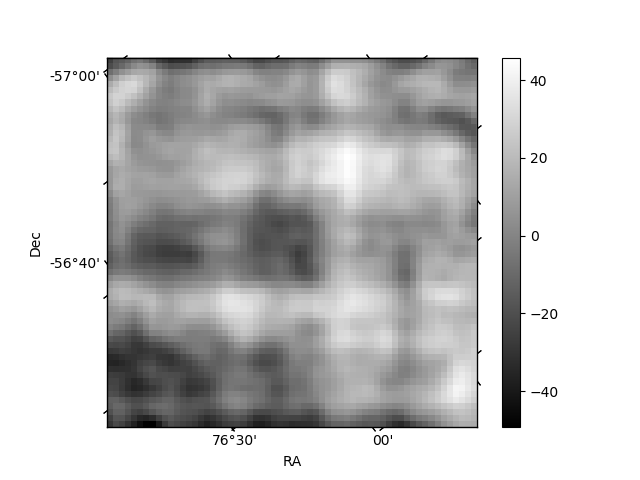
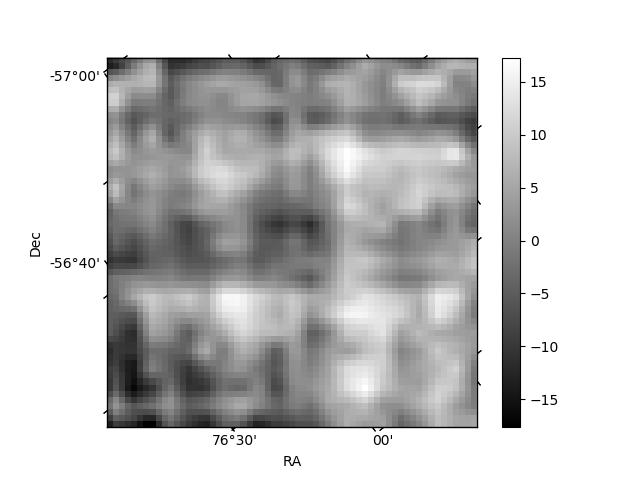
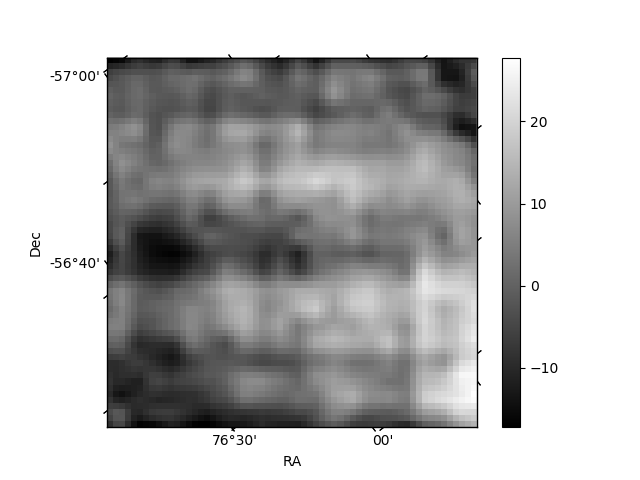
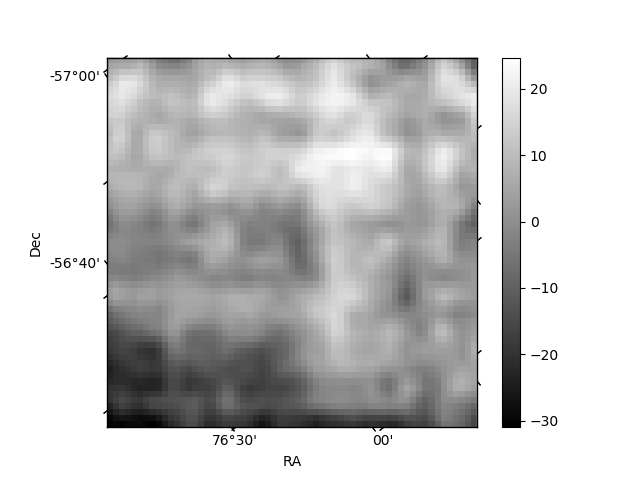
Histogram calculated using DETX and DETY for each event in the final _common_clean file
| Quadrant A | 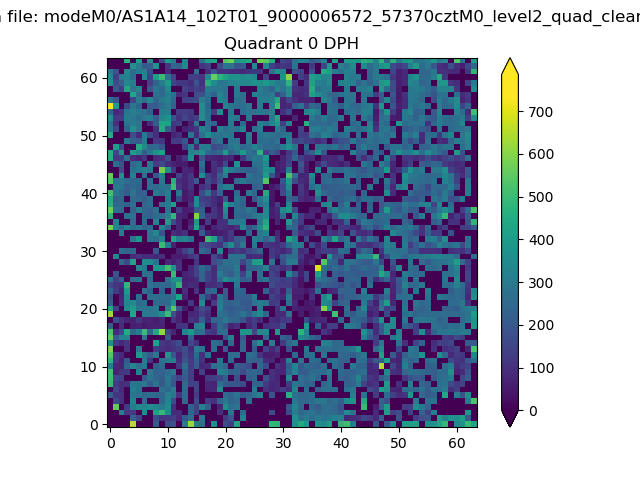 |
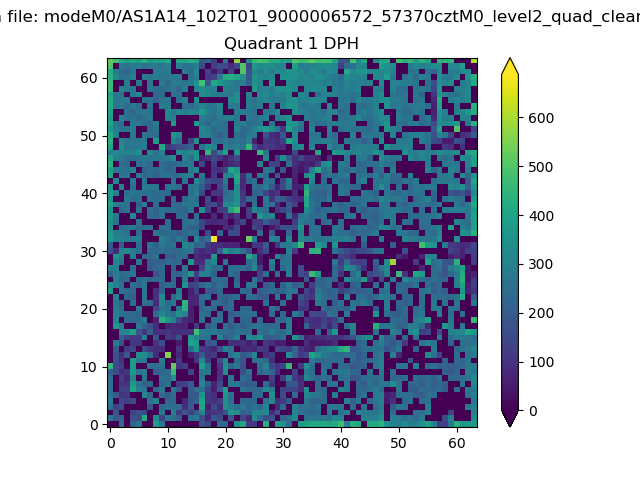 |
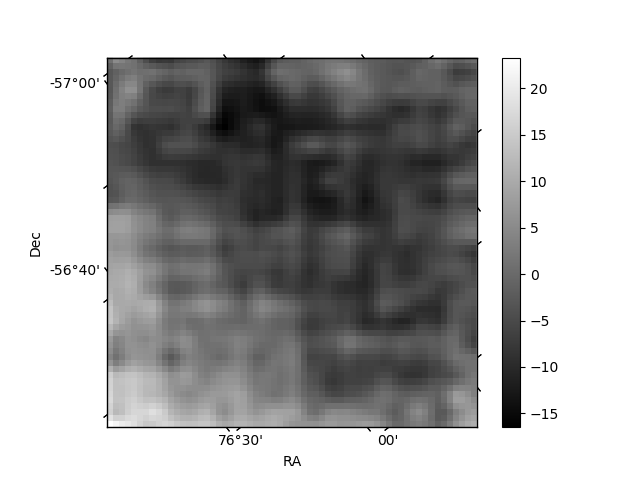
Quadrant B |
|---|---|---|---|
| Quadrant D | 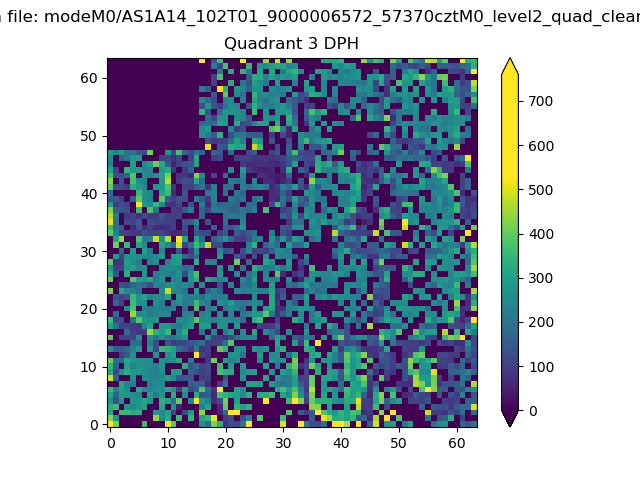 |
 |
Quadrant C |
| Plot type | Count rate plots | Images |
|---|---|---|
| Comparison with Poisson distribution Blue bars denote a histogram of data divided into 1 sec bins. Red curve is a Poisson curve with rate = median count rate of data. |
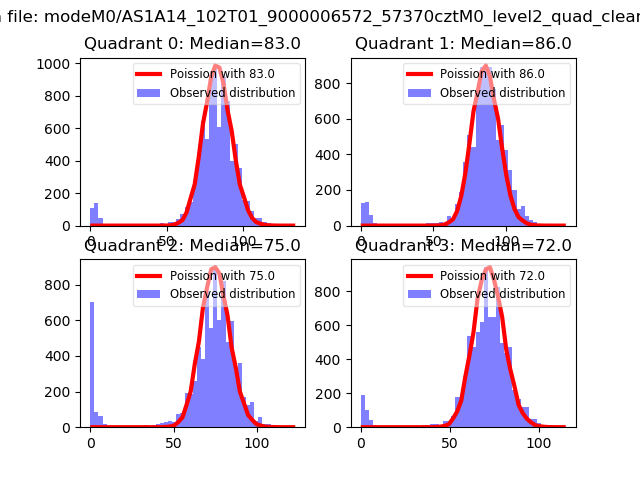 |
 |
| Quadrant-wise count rates Data is divided into 100 sec bins |
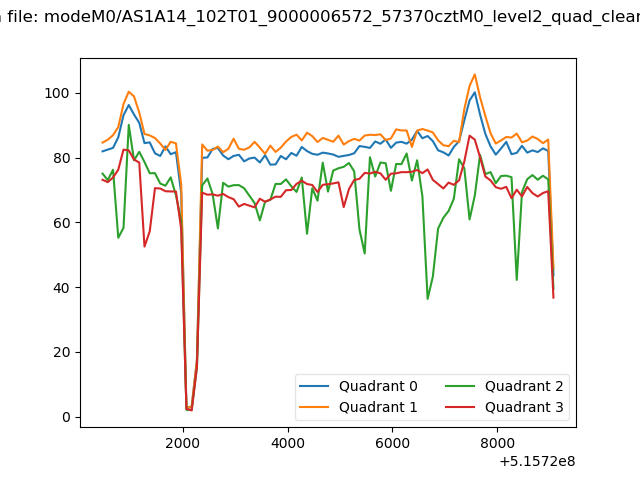 |
|
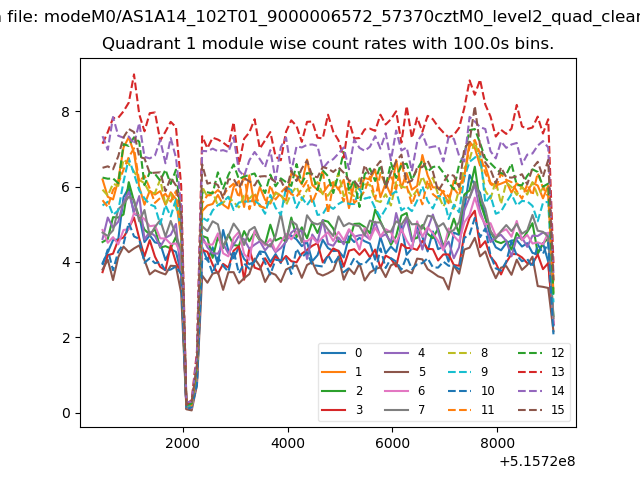
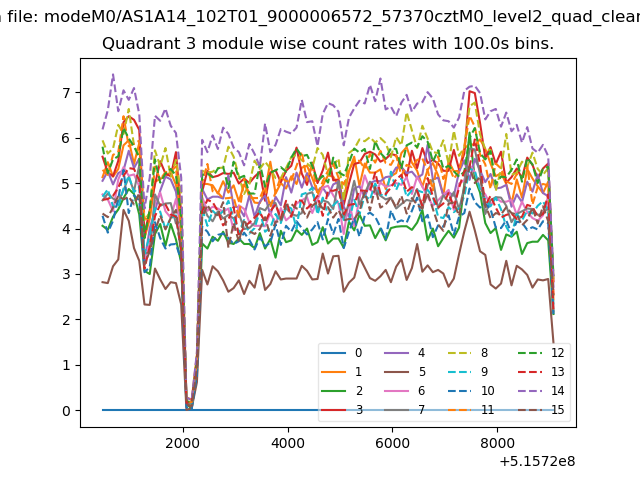
| Module-wise count rates for Quadrant A Data is divided into 100 sec bins |
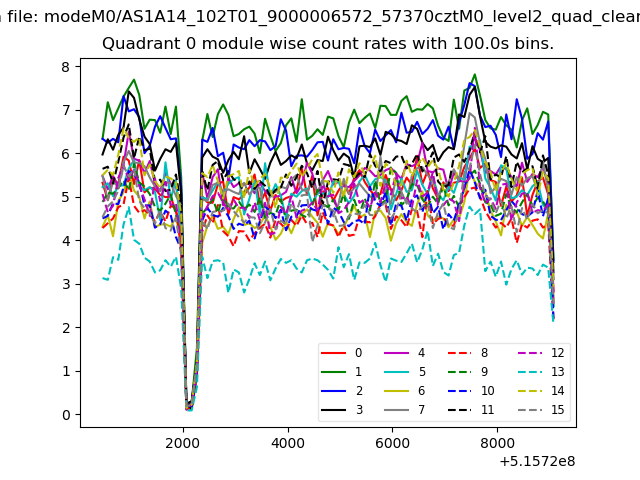 |
 |
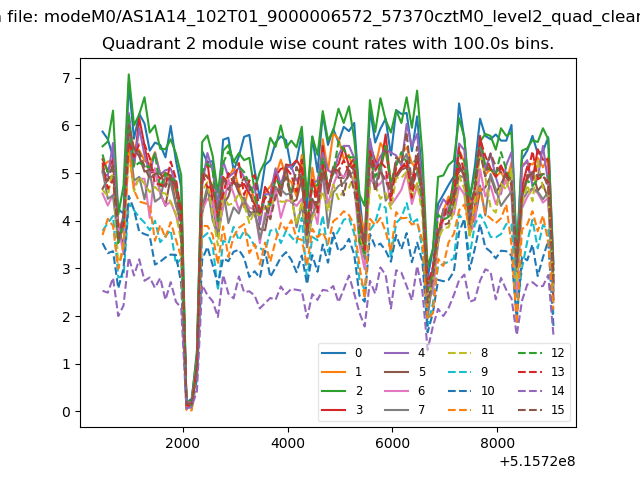
| Module-wise count rates for Quadrant B Data is divided into 100 sec bins |
 |
 |
| Module-wise count rates for Quadrant C Data is divided into 100 sec bins |
 |
 |
| Module-wise count rates for Quadrant D Data is divided into 100 sec bins |
 |
 |
| Parameter | Plot |
|---|---|
| CZT HV Monitor | 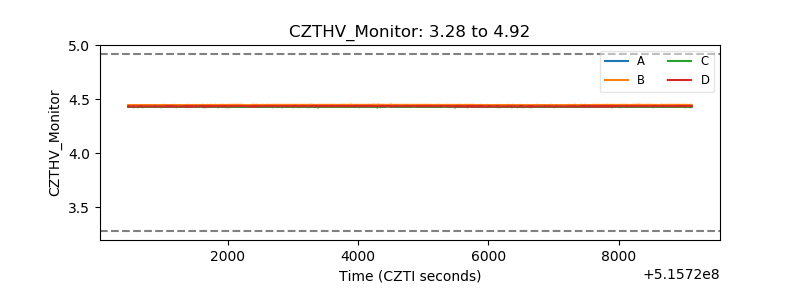 |
| D_VDD | 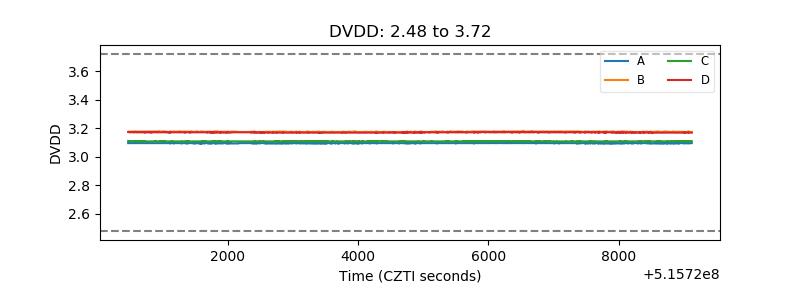 |
| Temperature 1 | 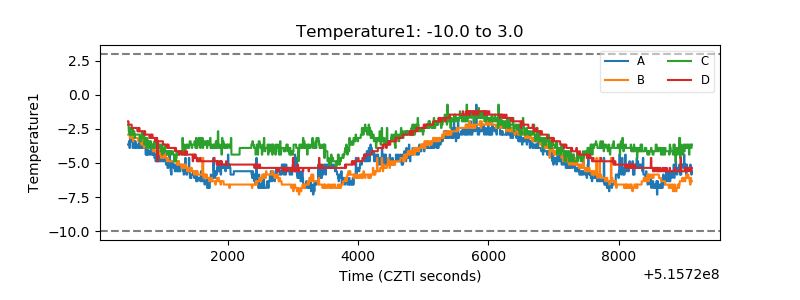 |
| Veto HV Monitor | 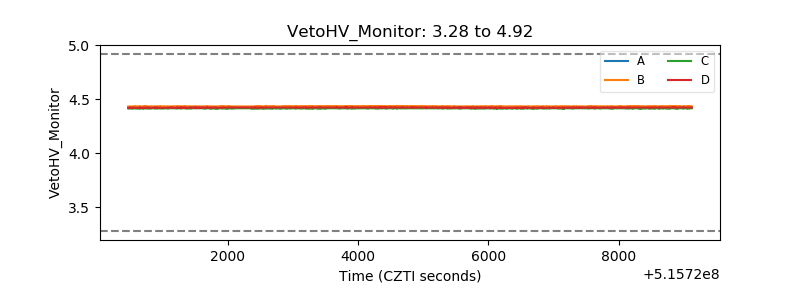 |
| Veto LLD | 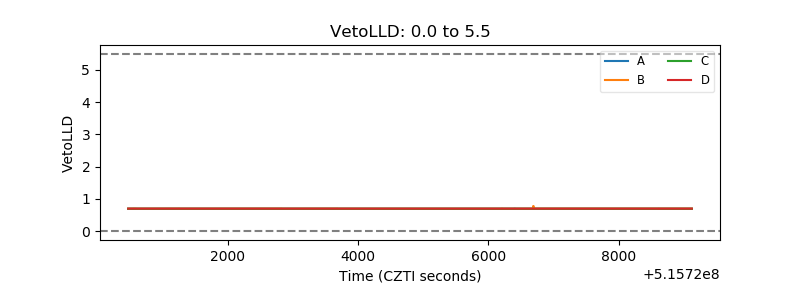 |
| Alpha Counter | 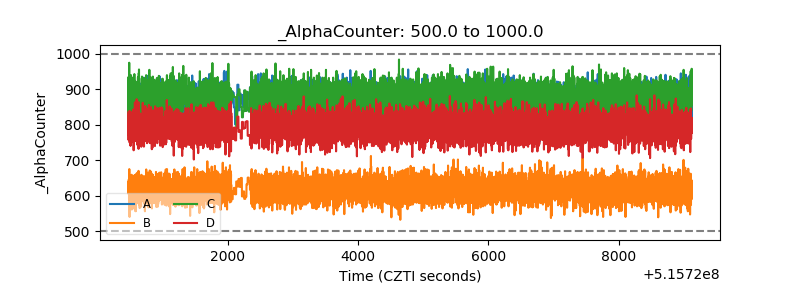 |
| _CPM_Rate | 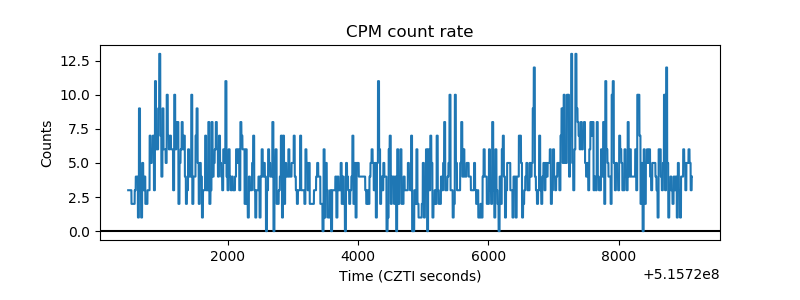 |
| CZT Counter | 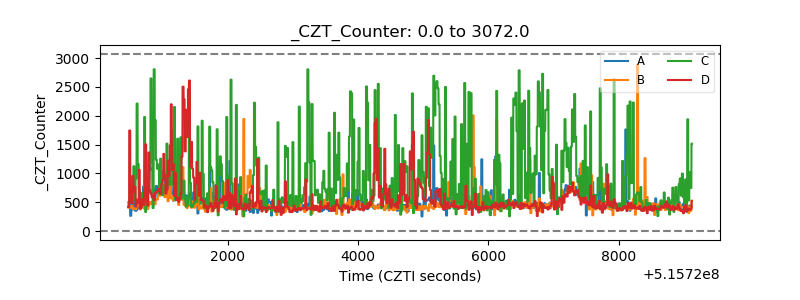 |
| +2.5 Volts monitor | 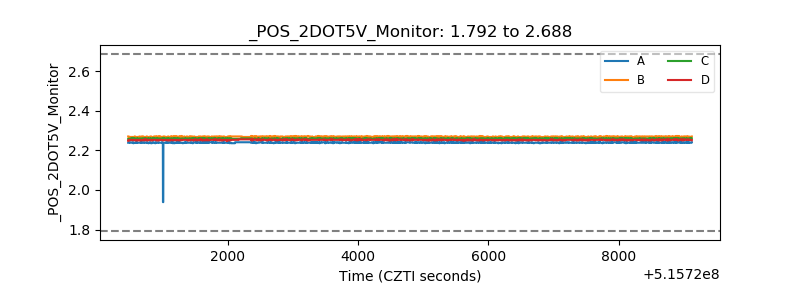 |
| +5 Volts monitor | 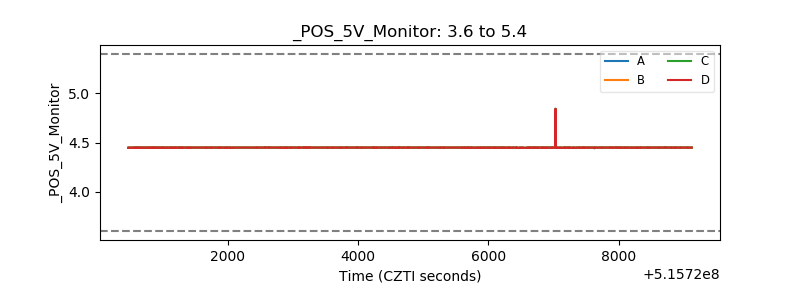 |
| _ROLL_ROT | 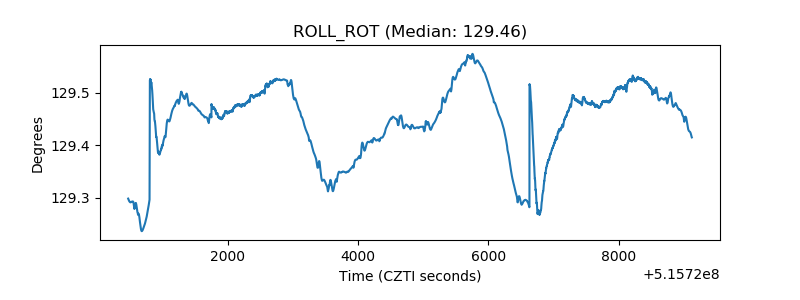 |
| _Roll_DEC | 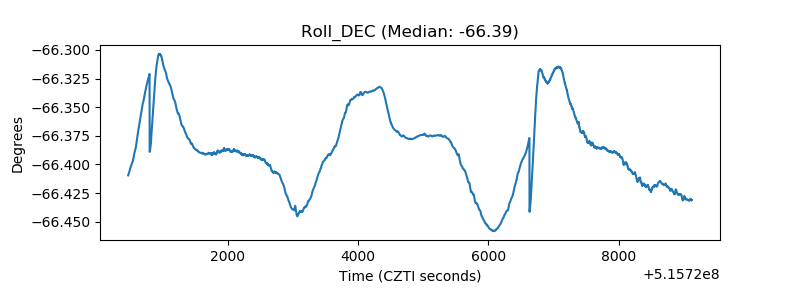 |
| _Roll_RA | 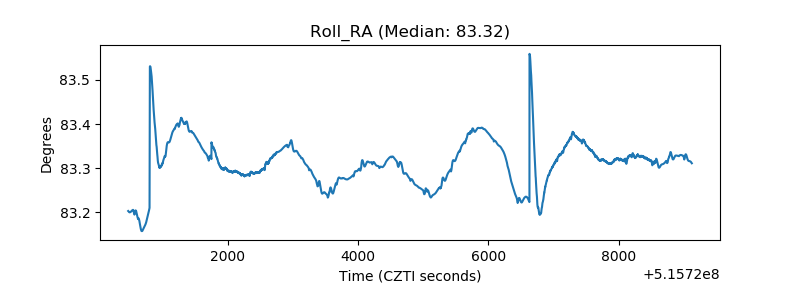 |
| Veto Counter | 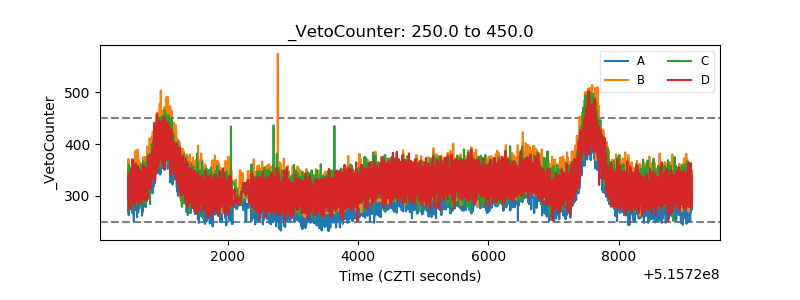 |