| Param | Original file | Final file |
|---|---|---|
| Filename | modeM0/AS1A14_102T01_9000006572_57373cztM0_level2.fits | modeM0/AS1A14_102T01_9000006572_57373cztM0_level2_quad_clean.evt |
| Size (bytes) | 1,199,018,880 | 214,087,680 |
| Size | 1.1 GB | 204.2 MB |
| Events in quadrant A | 8,744,502 | 1,391,409 |
| Events in quadrant B | 8,949,155 | 1,395,829 |
| Events in quadrant C | 15,520,561 | 1,228,421 |
| Events in quadrant D | 9,727,200 | 1,181,676 |
| Mode M0 | |||
|---|---|---|---|
| Quadrant | BADHDUFLAG | Total packets | Discarded packets |
| A | 0 | 39508 | 3 |
| B | 0 | 40252 | 3 |
| C | 0 | 58983 | 3 |
| D | 0 | 42201 | 3 |
| Mode M9 | |||
|---|---|---|---|
| Quadrant | BADHDUFLAG | Total packets | Discarded packets |
| A | 0 | 11 | 0 |
| B | 0 | 11 | 0 |
| C | 0 | 11 | 0 |
| D | 0 | 11 | 0 |
| Mode SS | |||
|---|---|---|---|
| Quadrant | BADHDUFLAG | Total packets | Discarded packets |
| A | 0 | 380 | 0 |
| B | 0 | 380 | 0 |
| C | 0 | 380 | 0 |
| D | 0 | 380 | 0 |
| Quadrant | Total seconds | Saturated seconds | Saturation percentage |
|---|---|---|---|
| A | 18618 | 327 | 1.756365% |
| B | 18619 | 518 | 2.782104% |
| C | 18619 | 1991 | 10.693378% |
| D | 18619 | 513 | 2.755250% |
Noise dominated data is calculated using 1-second bins in cleaned event files. If a bin has >2000 counts, and if more than 50% of those come from <1% of pixels, then it is considered to be noise-dominated and hence unusable.
| Quadrant | # 1 sec bins | Bins with >0 counts | Bins with >2000 counts | High rate bins dominated by noise | Noise dominated (total time) | Noise dominated (detector-on time) | Marked lightcurve |
|---|---|---|---|---|---|---|---|
| A | 20085 | 18900 | 22 | 22 | 0.11% | 0.12% | 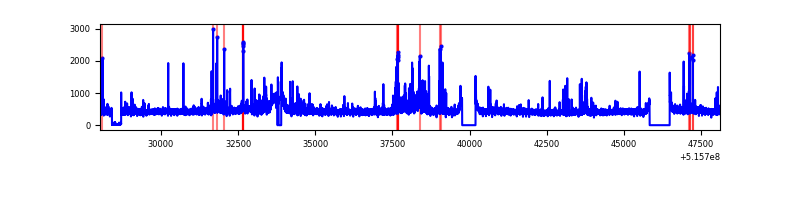 |
| B | 20086 | 18901 | 101 | 101 | 0.50% | 0.53% | 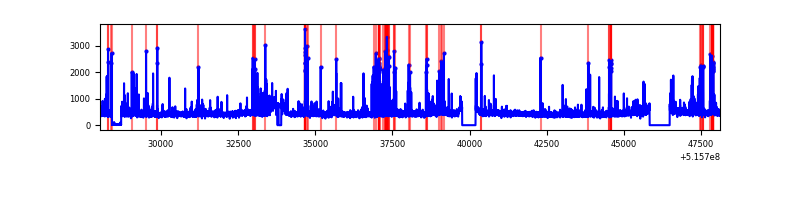 |
| C | 20086 | 18901 | 1417 | 1417 | 7.05% | 7.50% | 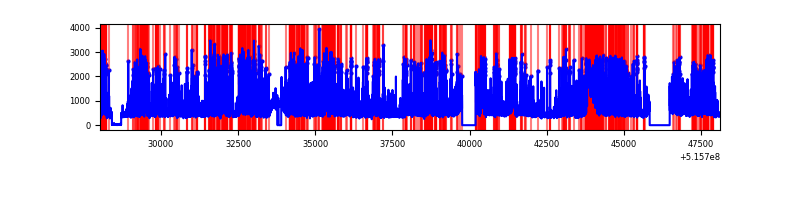 |
| D | 20086 | 18902 | 236 | 236 | 1.17% | 1.25% | 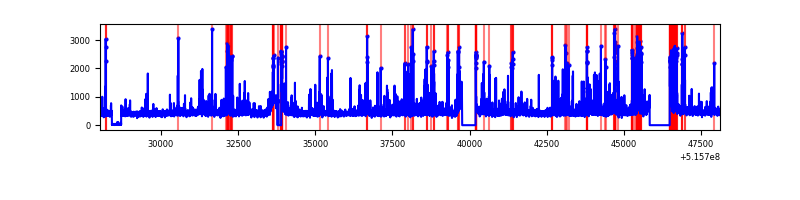 |
Top three noisy pixels from each quadrant. If the there are fewer than three noisy pixels in the level2.evt file, extra rows are filled as -1
| Pixel properties | Quadrant properties | ||||||
|---|---|---|---|---|---|---|---|
| Quadrant | DetID | PixID | Counts | Sigma | Mean | Median | Sigma |
| A | 10 | 251 | 304231 | 608.58 | 2021 | 1968 | 496.7 |
| A | 3 | 14 | 197932 | 394.56 | 2021 | 1968 | 496.7 |
| A | 3 | 61 | 139661 | 277.23 | 2021 | 1968 | 496.7 |
| B | 5 | 185 | 522182 | 1221.77 | 1991 | 1906 | 425.8 |
| B | 10 | 247 | 154469 | 358.26 | 1991 | 1906 | 425.8 |
| B | 7 | 252 | 151140 | 350.45 | 1991 | 1906 | 425.8 |
| C | 15 | 224 | 5542504 | 10984.97 | 1884 | 1866 | 504.4 |
| C | 12 | 2 | 962572 | 1904.71 | 1884 | 1866 | 504.4 |
| C | 12 | 252 | 667130 | 1318.96 | 1884 | 1866 | 504.4 |
| D | 15 | 142 | 320324 | 582.68 | 1951 | 1861 | 546.5 |
| D | 8 | 240 | 307590 | 559.38 | 1951 | 1861 | 546.5 |
| D | 7 | 96 | 266565 | 484.32 | 1951 | 1861 | 546.5 |
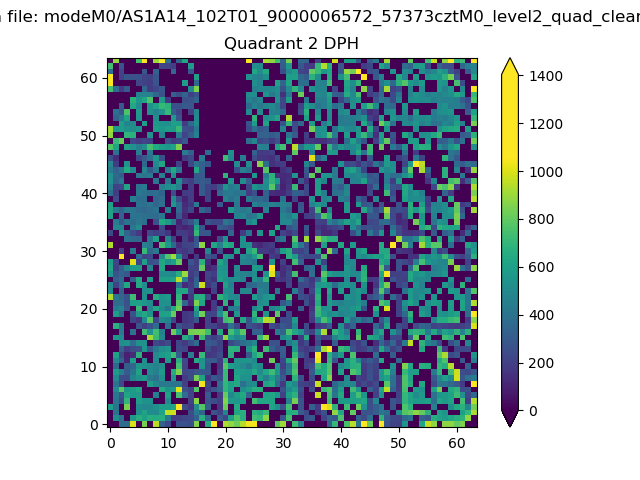
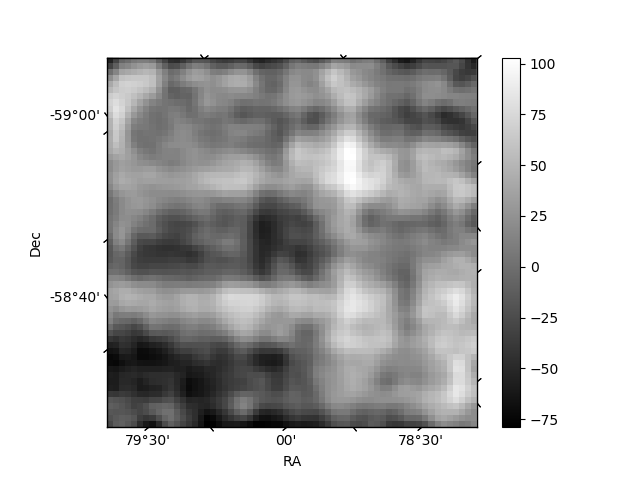
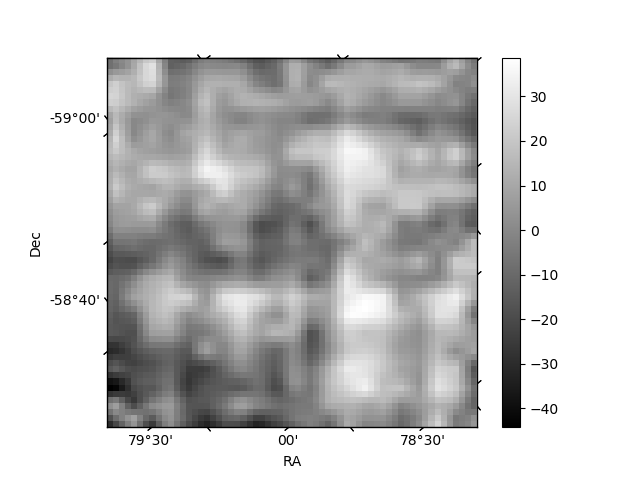
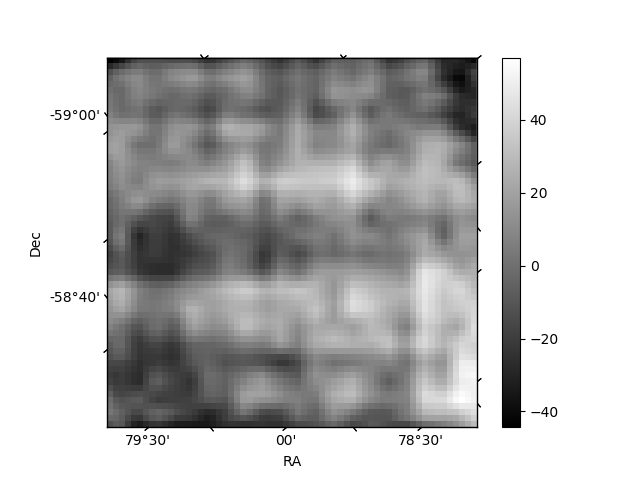
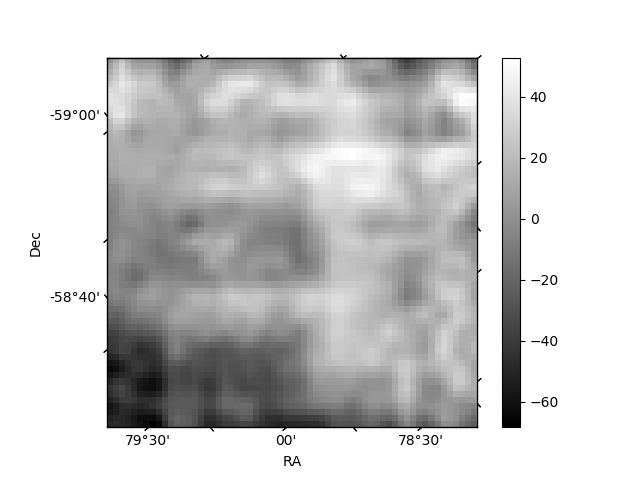
Histogram calculated using DETX and DETY for each event in the final _common_clean file
| Quadrant A | 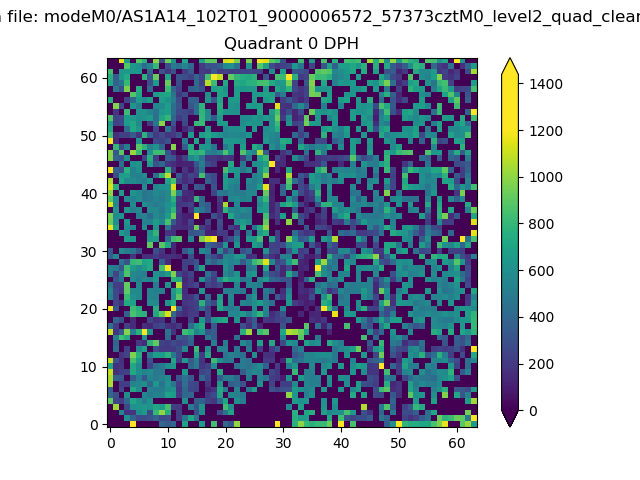 |
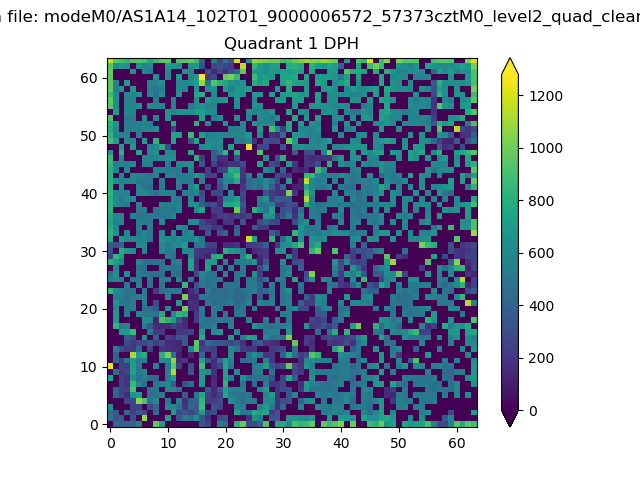 |
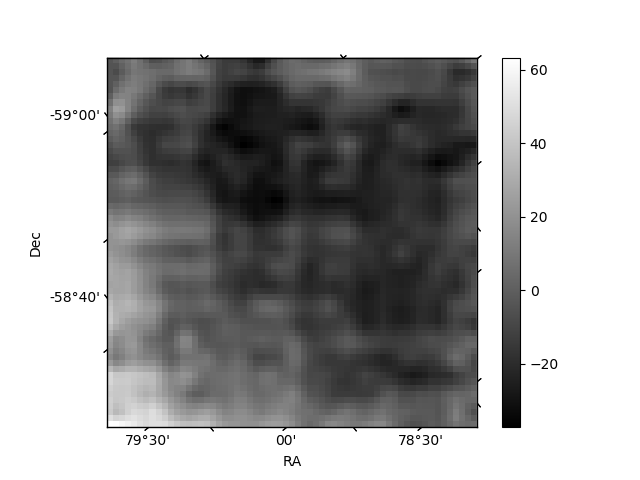
Quadrant B |
|---|---|---|---|
| Quadrant D | 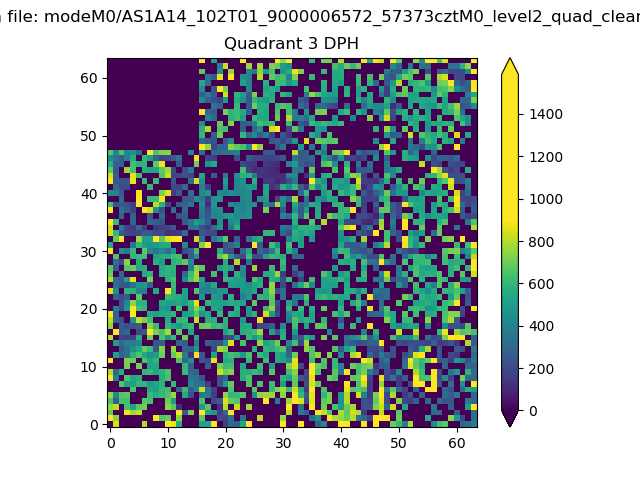 |
 |
Quadrant C |
| Plot type | Count rate plots | Images |
|---|---|---|
| Comparison with Poisson distribution Blue bars denote a histogram of data divided into 1 sec bins. Red curve is a Poisson curve with rate = median count rate of data. |
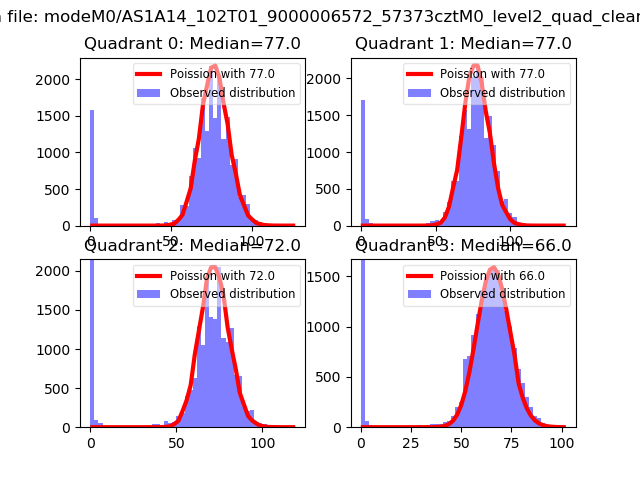 |
 |
| Quadrant-wise count rates Data is divided into 100 sec bins |
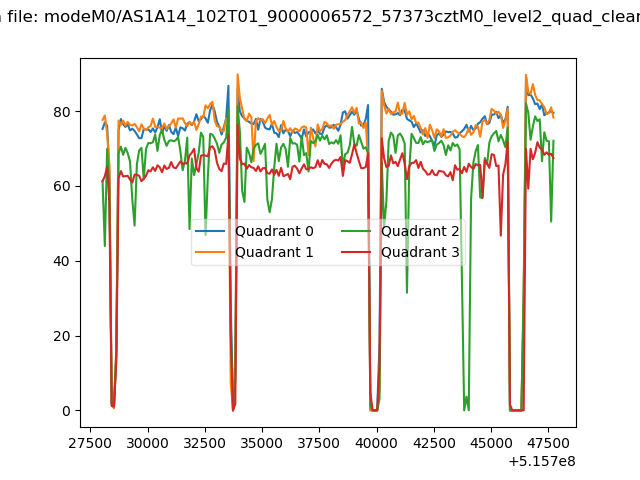 |
|
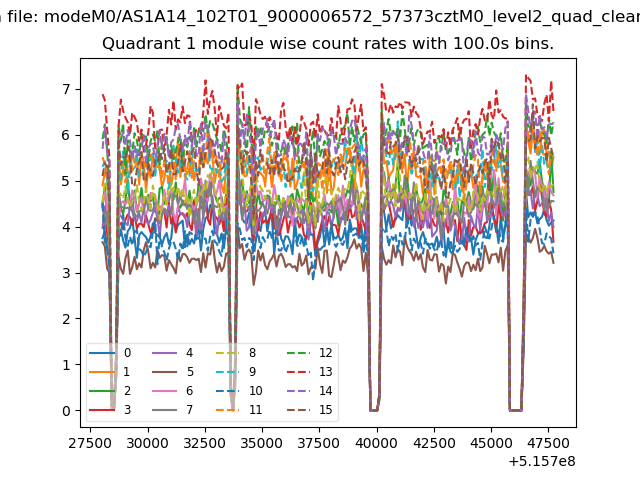
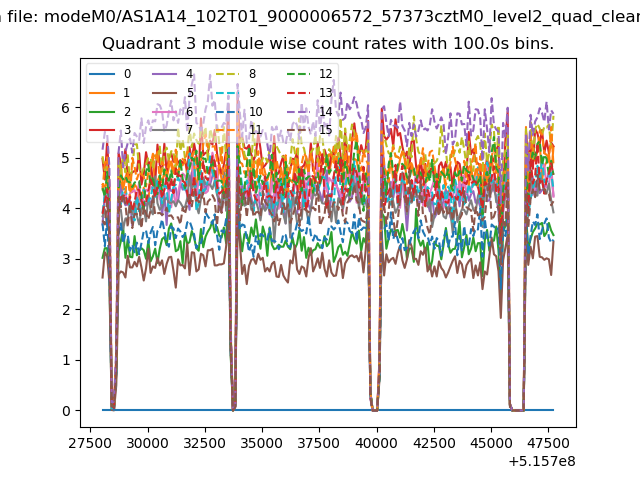
| Module-wise count rates for Quadrant A Data is divided into 100 sec bins |
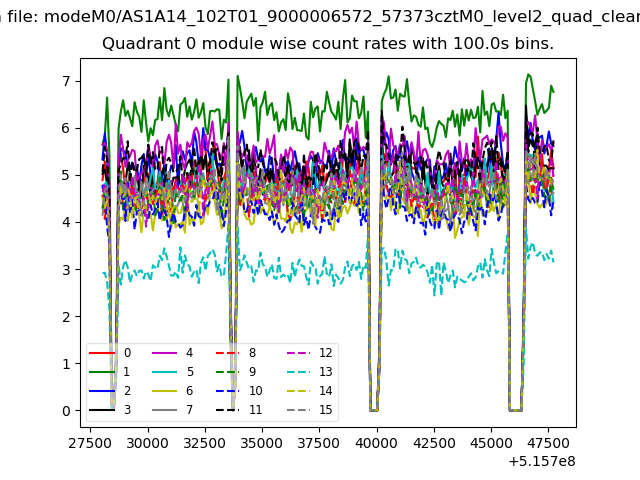 |
 |
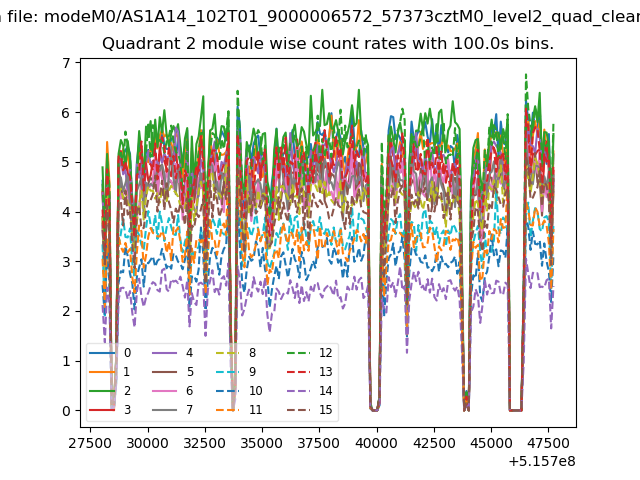
| Module-wise count rates for Quadrant B Data is divided into 100 sec bins |
 |
 |
| Module-wise count rates for Quadrant C Data is divided into 100 sec bins |
 |
 |
| Module-wise count rates for Quadrant D Data is divided into 100 sec bins |
 |
 |
| Parameter | Plot |
|---|---|
| CZT HV Monitor | 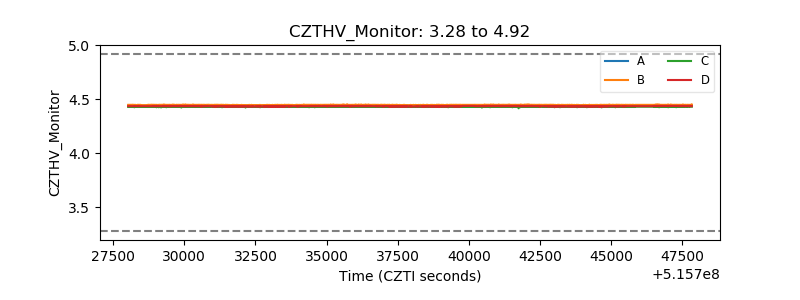 |
| D_VDD | 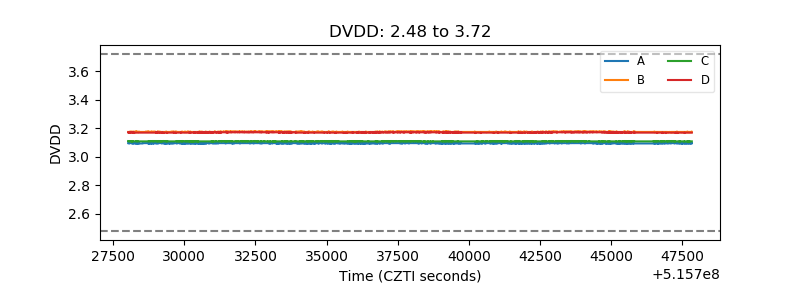 |
| Temperature 1 | 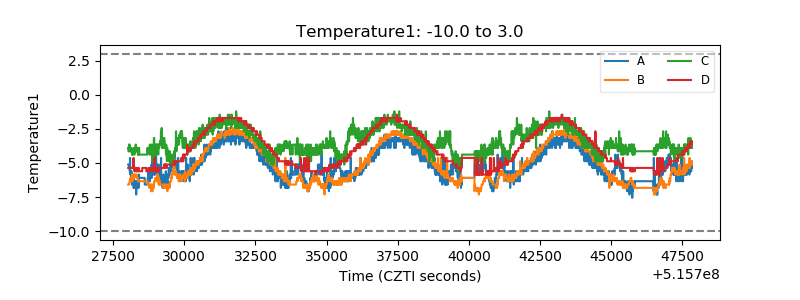 |
| Veto HV Monitor | 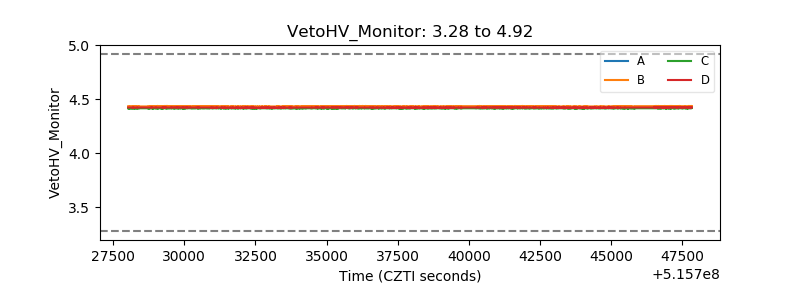 |
| Veto LLD | 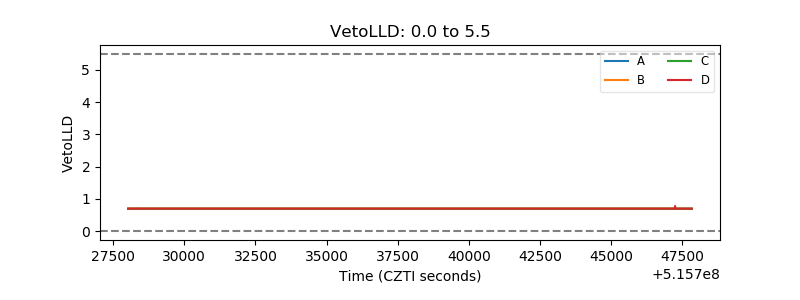 |
| Alpha Counter | 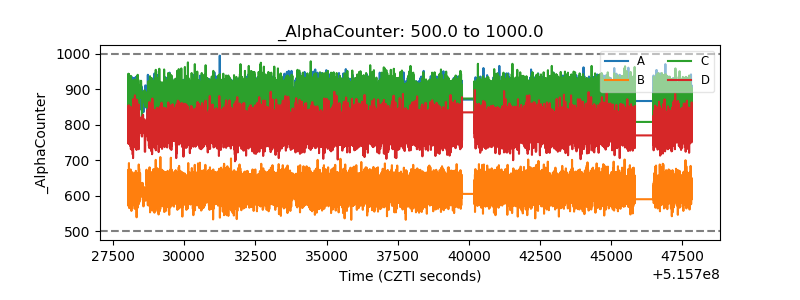 |
| _CPM_Rate | 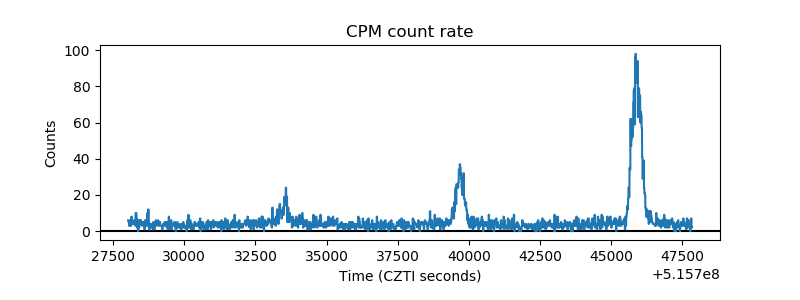 |
| CZT Counter | 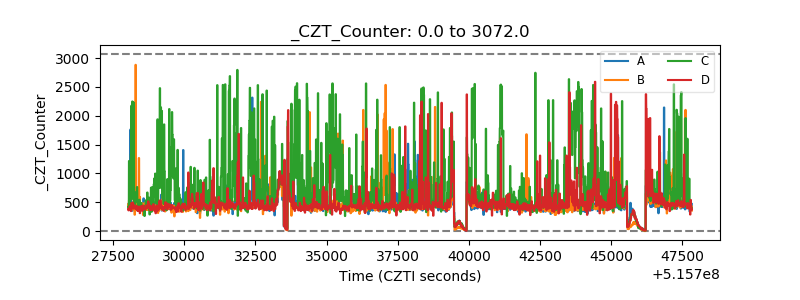 |
| +2.5 Volts monitor |  |
| +5 Volts monitor |  |
| _ROLL_ROT | 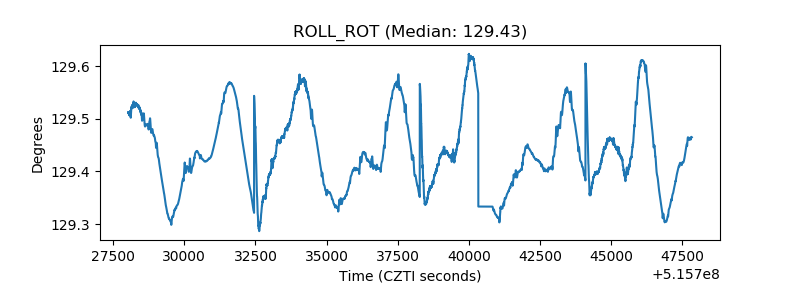 |
| _Roll_DEC | 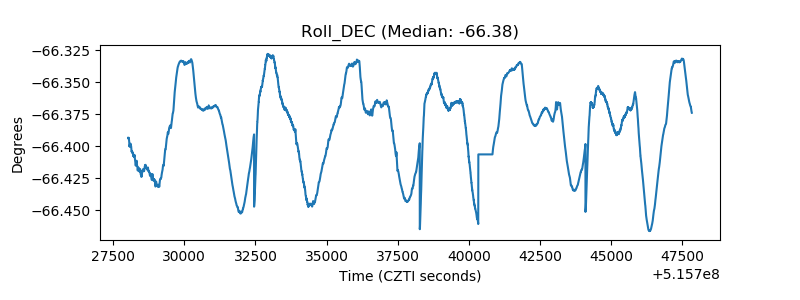 |
| _Roll_RA | 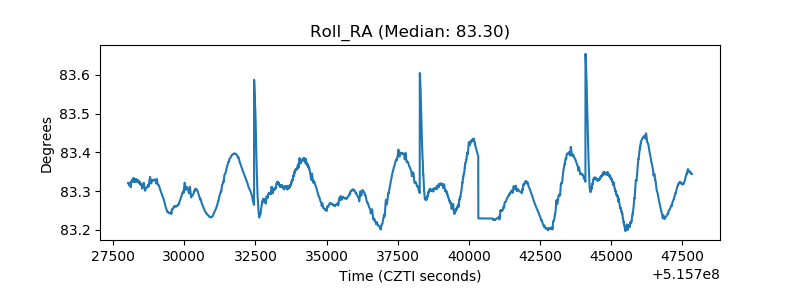 |
| Veto Counter | 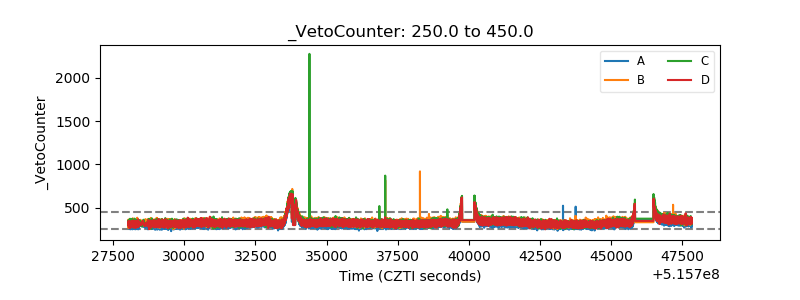 |