| Param | Original file | Final file |
|---|---|---|
| Filename | modeM0/AS1A14_102T01_9000006572_57374cztM0_level2.fits | modeM0/AS1A14_102T01_9000006572_57374cztM0_level2_quad_clean.evt |
| Size (bytes) | 456,808,320 | 97,914,240 |
| Size | 435.6 MB | 93.4 MB |
| Events in quadrant A | 3,062,960 | 645,662 |
| Events in quadrant B | 3,341,597 | 689,945 |
| Events in quadrant C | 6,199,901 | 576,094 |
| Events in quadrant D | 3,773,992 | 576,860 |
| Mode M0 | |||
|---|---|---|---|
| Quadrant | BADHDUFLAG | Total packets | Discarded packets |
| A | 0 | 14067 | 1 |
| B | 0 | 14762 | 1 |
| C | 0 | 23154 | 1 |
| D | 0 | 15835 | 1 |
| Mode M9 | |||
|---|---|---|---|
| Quadrant | BADHDUFLAG | Total packets | Discarded packets |
| A | 0 | 8 | 0 |
| B | 0 | 8 | 0 |
| C | 0 | 8 | 0 |
| D | 0 | 8 | 0 |
| Mode SS | |||
|---|---|---|---|
| Quadrant | BADHDUFLAG | Total packets | Discarded packets |
| A | 0 | 140 | 0 |
| B | 0 | 140 | 0 |
| C | 0 | 140 | 0 |
| D | 0 | 140 | 0 |
| Quadrant | Total seconds | Saturated seconds | Saturation percentage |
|---|---|---|---|
| A | 6827 | 83 | 1.215761% |
| B | 6828 | 144 | 2.108963% |
| C | 6828 | 693 | 10.149385% |
| D | 6828 | 183 | 2.680141% |
Noise dominated data is calculated using 1-second bins in cleaned event files. If a bin has >2000 counts, and if more than 50% of those come from <1% of pixels, then it is considered to be noise-dominated and hence unusable.
| Quadrant | # 1 sec bins | Bins with >0 counts | Bins with >2000 counts | High rate bins dominated by noise | Noise dominated (total time) | Noise dominated (detector-on time) | Marked lightcurve |
|---|---|---|---|---|---|---|---|
| A | 7632 | 6827 | 6 | 6 | 0.08% | 0.09% | 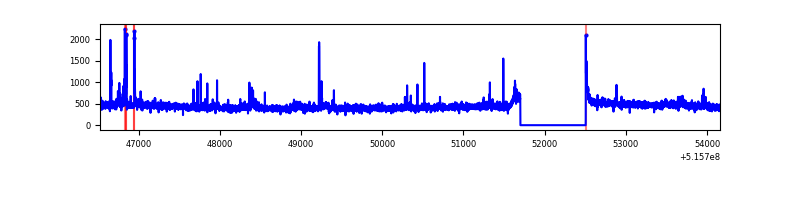 |
| B | 7633 | 6828 | 46 | 46 | 0.60% | 0.67% | 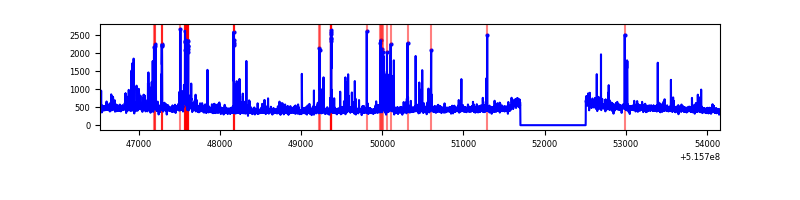 |
| C | 7633 | 6828 | 563 | 563 | 7.38% | 8.25% | 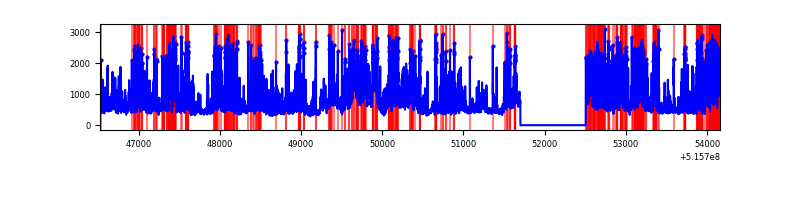 |
| D | 7633 | 6828 | 103 | 103 | 1.35% | 1.51% | 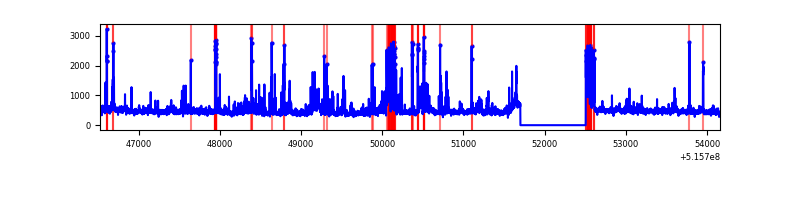 |
Top three noisy pixels from each quadrant. If the there are fewer than three noisy pixels in the level2.evt file, extra rows are filled as -1
| Pixel properties | Quadrant properties | ||||||
|---|---|---|---|---|---|---|---|
| Quadrant | DetID | PixID | Counts | Sigma | Mean | Median | Sigma |
| A | 3 | 61 | 81726 | 438.26 | 746 | 725 | 184.8 |
| A | 10 | 251 | 27808 | 146.53 | 746 | 725 | 184.8 |
| A | 13 | 248 | 26452 | 139.2 | 746 | 725 | 184.8 |
| B | 5 | 185 | 207933 | 1321.81 | 730 | 702 | 156.8 |
| B | 7 | 252 | 68942 | 435.27 | 730 | 702 | 156.8 |
| B | 10 | 247 | 54656 | 344.14 | 730 | 702 | 156.8 |
| C | 15 | 224 | 2565735 | 13546.55 | 699 | 692 | 189.4 |
| C | 8 | 7 | 476888 | 2514.89 | 699 | 692 | 189.4 |
| C | 14 | 254 | 117468 | 616.72 | 699 | 692 | 189.4 |
| D | 15 | 142 | 309881 | 1521.2 | 723 | 691 | 203.3 |
| D | 8 | 240 | 252377 | 1238.29 | 723 | 691 | 203.3 |
| D | 3 | 224 | 77884 | 379.79 | 723 | 691 | 203.3 |
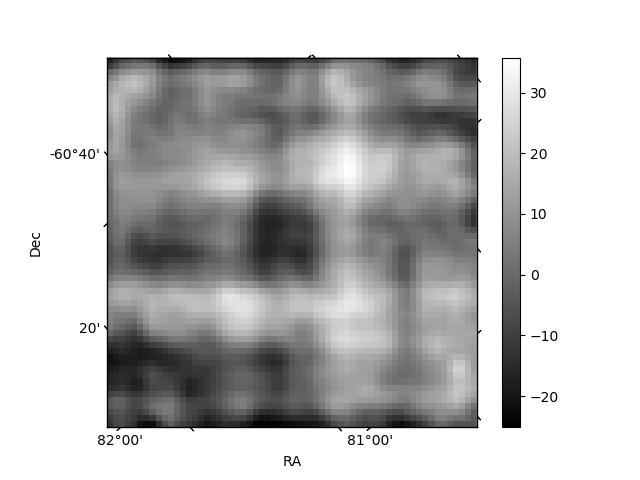
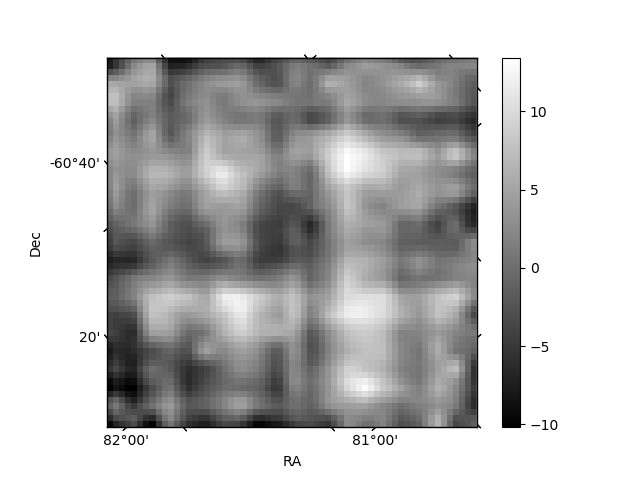
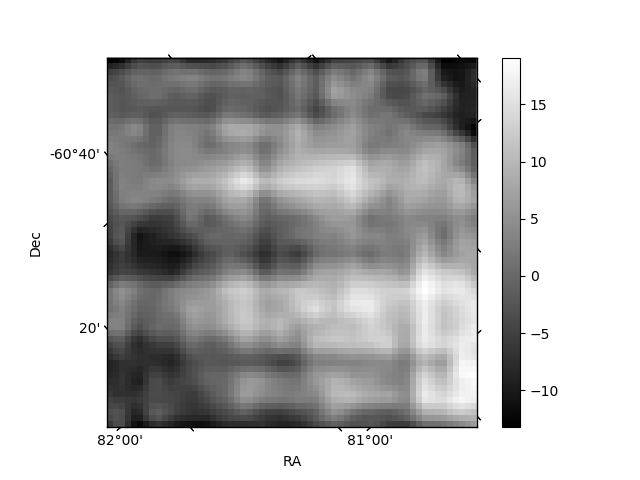
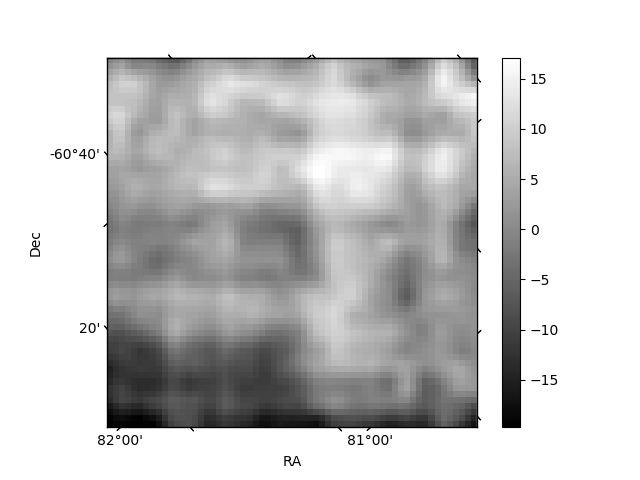
Histogram calculated using DETX and DETY for each event in the final _common_clean file
| Quadrant A | 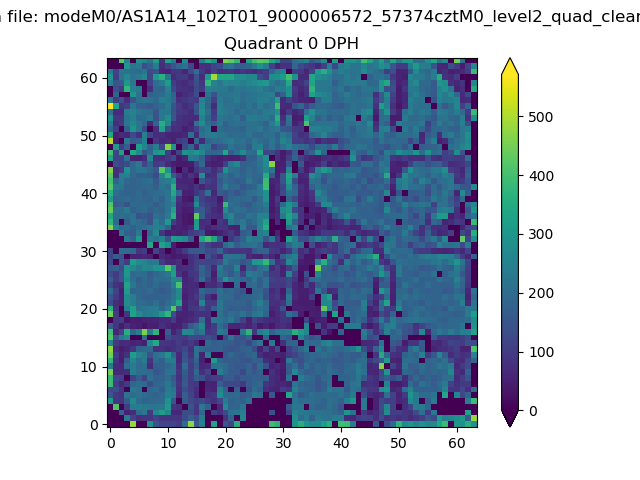 |
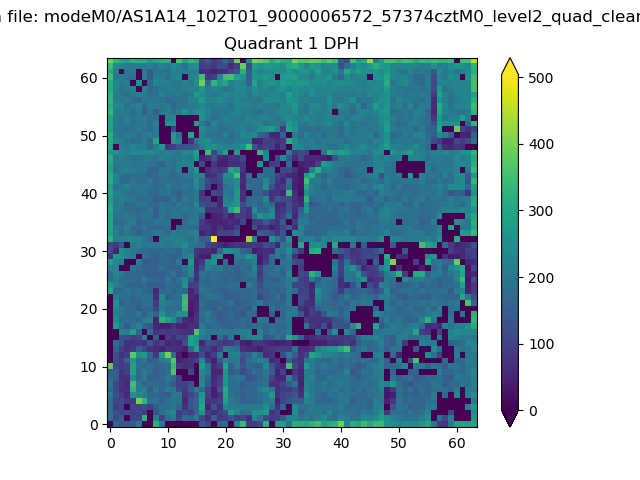 |
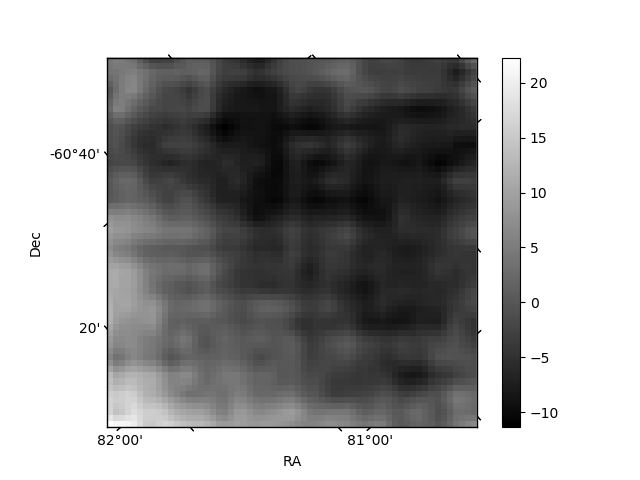
Quadrant B |
|---|---|---|---|
| Quadrant D | 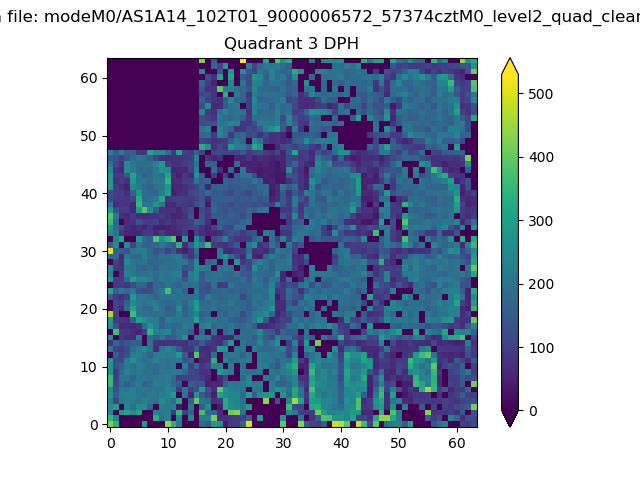 |
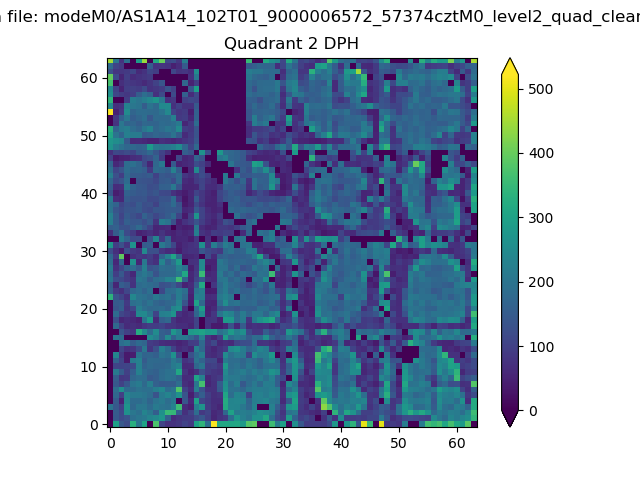 |
Quadrant C |
| Plot type | Count rate plots | Images |
|---|---|---|
| Comparison with Poisson distribution Blue bars denote a histogram of data divided into 1 sec bins. Red curve is a Poisson curve with rate = median count rate of data. |
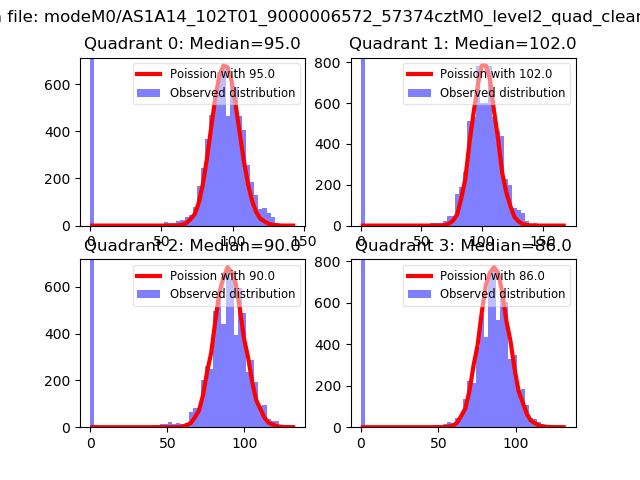 |
 |
| Quadrant-wise count rates Data is divided into 100 sec bins |
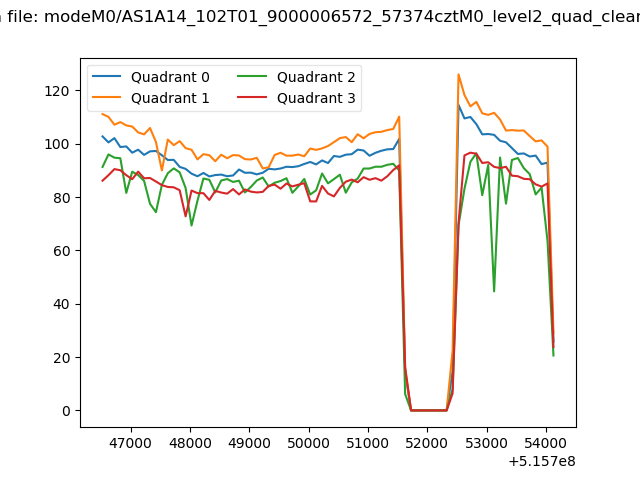 |
|
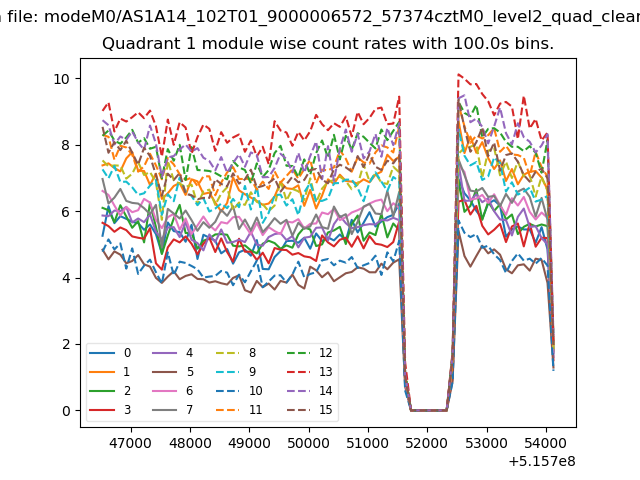
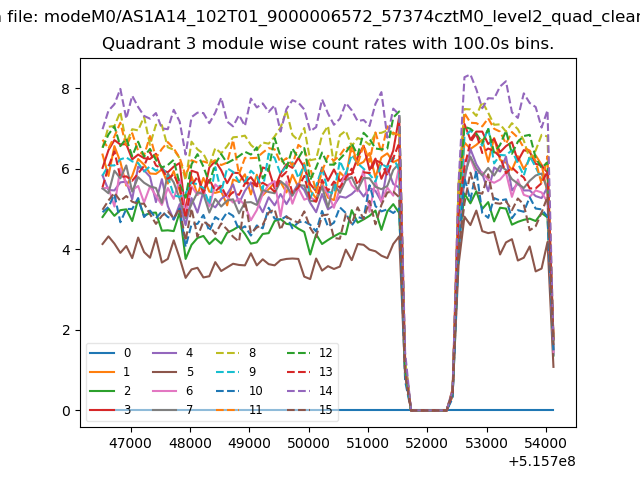
| Module-wise count rates for Quadrant A Data is divided into 100 sec bins |
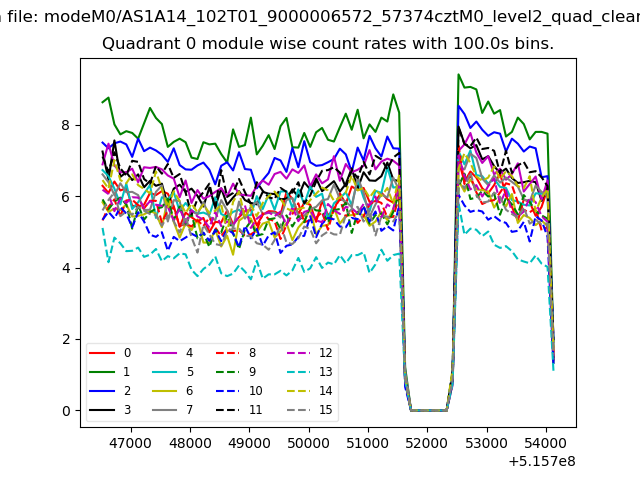 |
 |
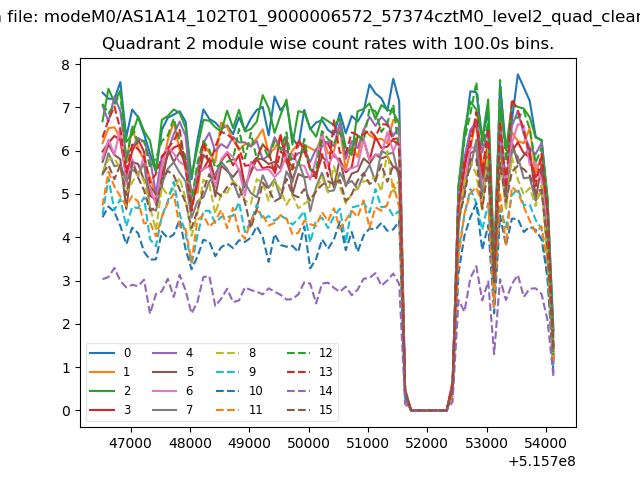
| Module-wise count rates for Quadrant B Data is divided into 100 sec bins |
 |
 |
| Module-wise count rates for Quadrant C Data is divided into 100 sec bins |
 |
 |
| Module-wise count rates for Quadrant D Data is divided into 100 sec bins |
 |
 |
| Parameter | Plot |
|---|---|
| CZT HV Monitor | 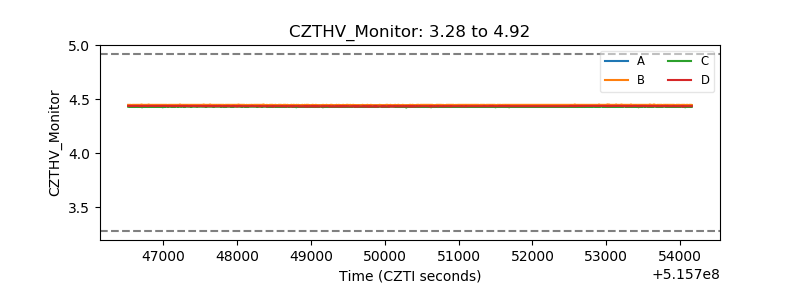 |
| D_VDD | 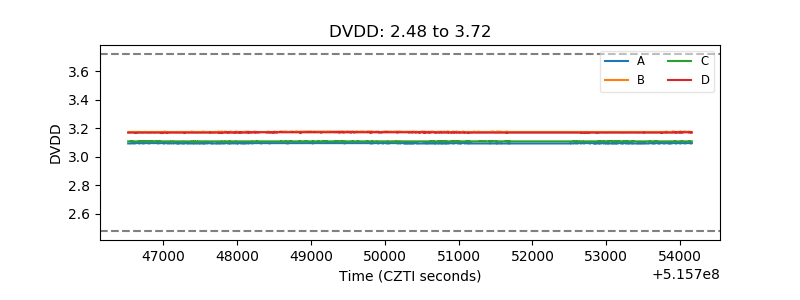 |
| Temperature 1 | 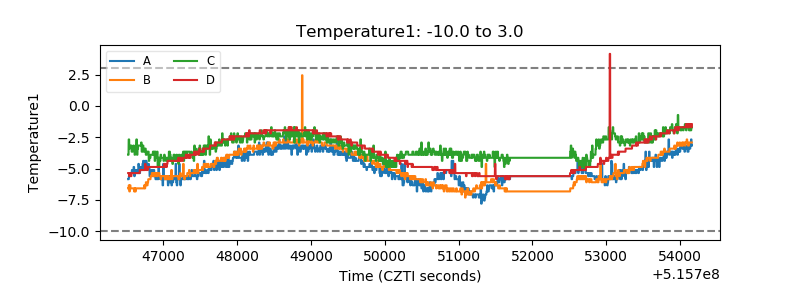 |
| Veto HV Monitor | 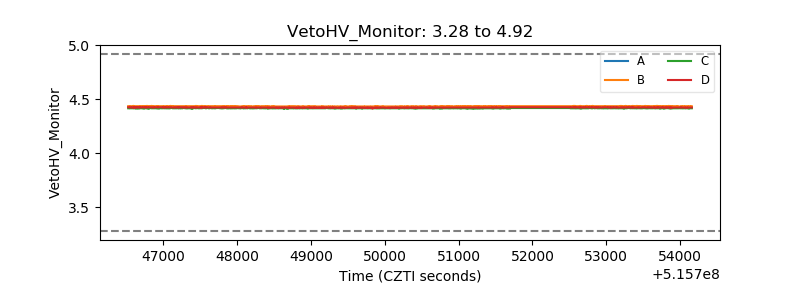 |
| Veto LLD | 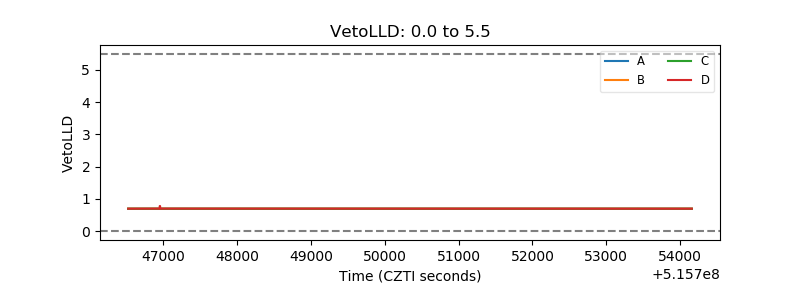 |
| Alpha Counter | 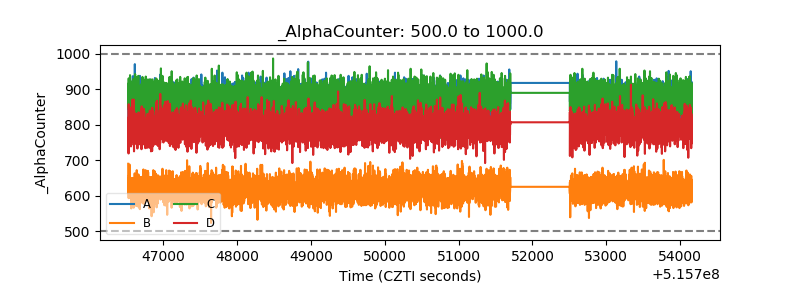 |
| _CPM_Rate | 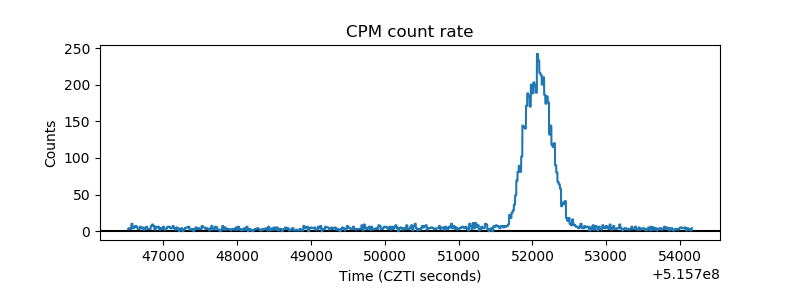 |
| CZT Counter | 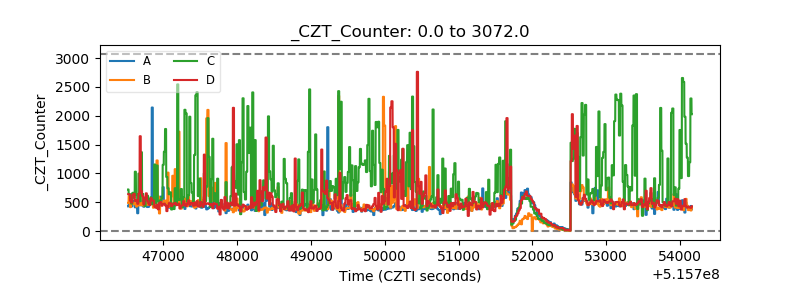 |
| +2.5 Volts monitor | 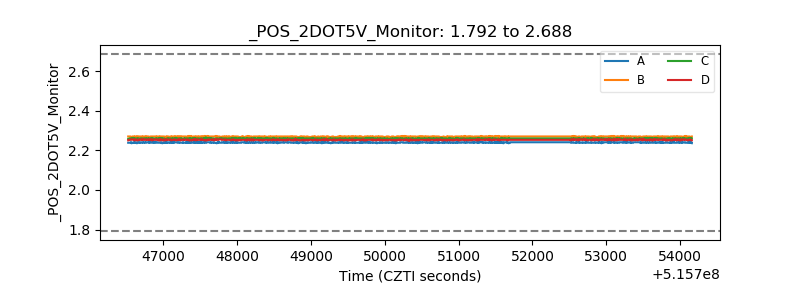 |
| +5 Volts monitor | 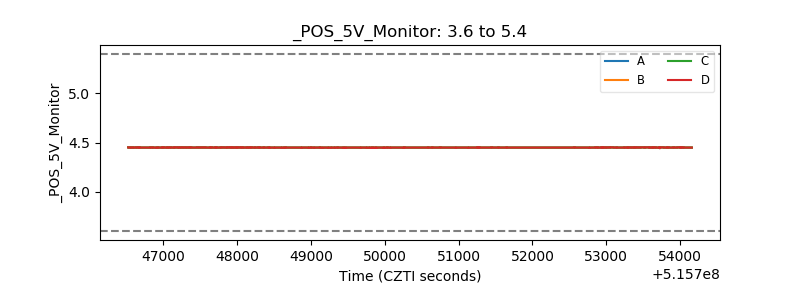 |
| _ROLL_ROT | 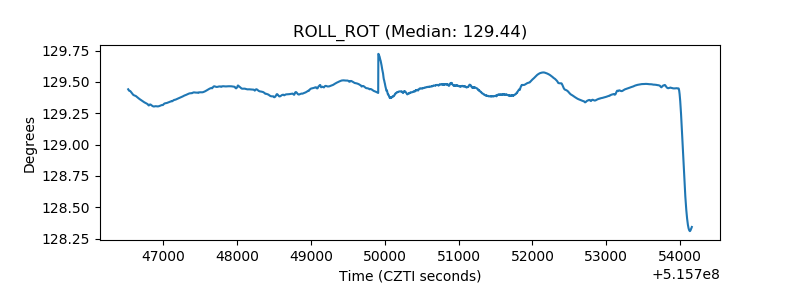 |
| _Roll_DEC | 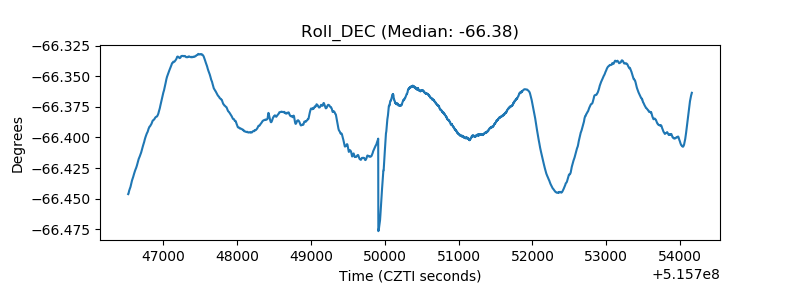 |
| _Roll_RA | 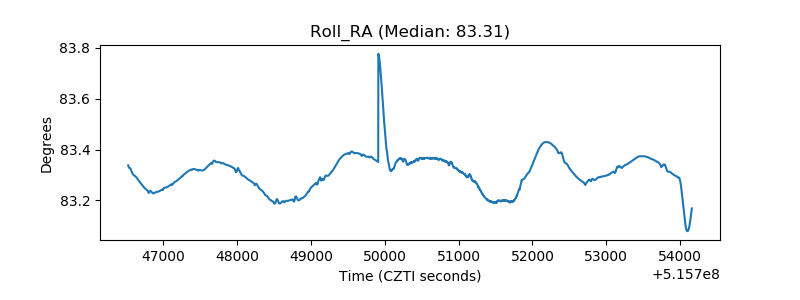 |
| Veto Counter | 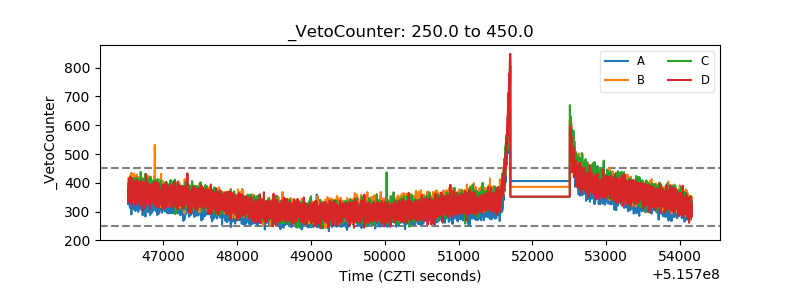 |