| Param | Original file | Final file |
|---|---|---|
| Filename | modeM0/AS1A14_102T01_9000006572_57376cztM0_level2.fits | modeM0/AS1A14_102T01_9000006572_57376cztM0_level2_quad_clean.evt |
| Size (bytes) | 481,752,000 | 97,997,760 |
| Size | 459.4 MB | 93.5 MB |
| Events in quadrant A | 3,095,995 | 657,383 |
| Events in quadrant B | 3,274,836 | 700,614 |
| Events in quadrant C | 7,480,175 | 552,681 |
| Events in quadrant D | 3,455,895 | 585,388 |
| Mode M0 | |||
|---|---|---|---|
| Quadrant | BADHDUFLAG | Total packets | Discarded packets |
| A | 0 | 14120 | 1 |
| B | 0 | 14575 | 1 |
| C | 0 | 26868 | 1 |
| D | 0 | 14979 | 1 |
| Mode M9 | |||
|---|---|---|---|
| Quadrant | BADHDUFLAG | Total packets | Discarded packets |
| A | 0 | 10 | 0 |
| B | 0 | 10 | 0 |
| C | 0 | 10 | 0 |
| D | 0 | 10 | 0 |
| Mode SS | |||
|---|---|---|---|
| Quadrant | BADHDUFLAG | Total packets | Discarded packets |
| A | 0 | 136 | 0 |
| B | 0 | 136 | 0 |
| C | 0 | 136 | 0 |
| D | 0 | 136 | 0 |
| Quadrant | Total seconds | Saturated seconds | Saturation percentage |
|---|---|---|---|
| A | 6766 | 64 | 0.945906% |
| B | 6766 | 107 | 1.581437% |
| C | 6766 | 1094 | 16.169081% |
| D | 6766 | 143 | 2.113509% |
Noise dominated data is calculated using 1-second bins in cleaned event files. If a bin has >2000 counts, and if more than 50% of those come from <1% of pixels, then it is considered to be noise-dominated and hence unusable.
| Quadrant | # 1 sec bins | Bins with >0 counts | Bins with >2000 counts | High rate bins dominated by noise | Noise dominated (total time) | Noise dominated (detector-on time) | Marked lightcurve |
|---|---|---|---|---|---|---|---|
| A | 7751 | 6766 | 22 | 22 | 0.28% | 0.33% | 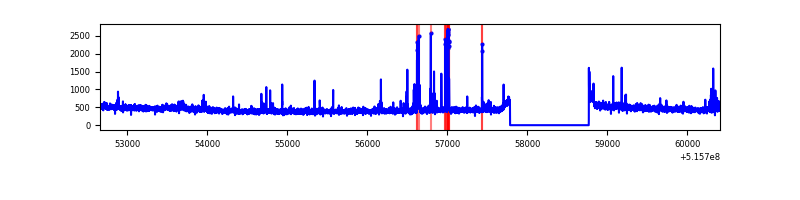 |
| B | 7751 | 6766 | 38 | 38 | 0.49% | 0.56% | 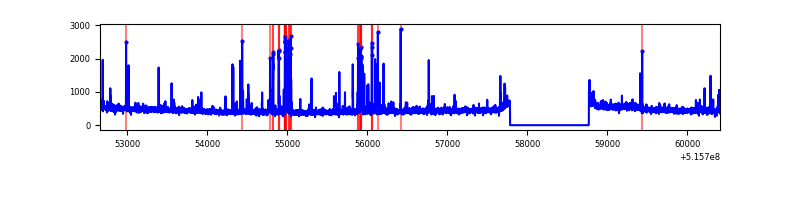 |
| C | 7751 | 6766 | 1050 | 1050 | 13.55% | 15.52% | 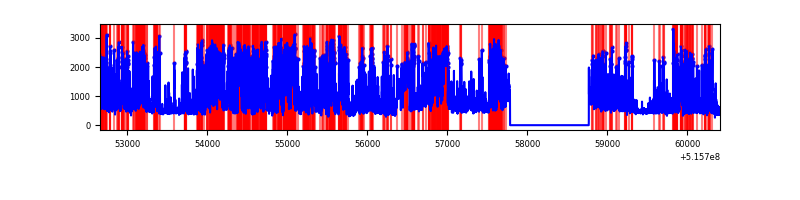 |
| D | 7751 | 6766 | 113 | 113 | 1.46% | 1.67% | 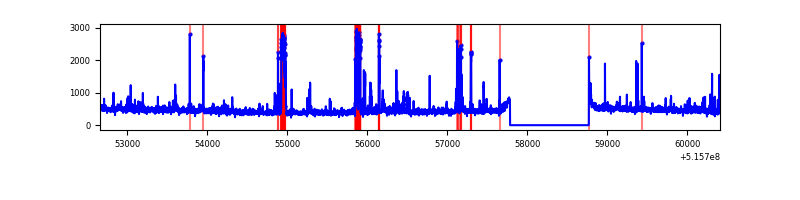 |
Top three noisy pixels from each quadrant. If the there are fewer than three noisy pixels in the level2.evt file, extra rows are filled as -1
| Pixel properties | Quadrant properties | ||||||
|---|---|---|---|---|---|---|---|
| Quadrant | DetID | PixID | Counts | Sigma | Mean | Median | Sigma |
| A | 3 | 61 | 112979 | 615.31 | 744 | 723 | 182.4 |
| A | 10 | 251 | 36022 | 193.49 | 744 | 723 | 182.4 |
| A | 13 | 248 | 33457 | 179.43 | 744 | 723 | 182.4 |
| B | 5 | 185 | 160868 | 1025.8 | 728 | 699 | 156.1 |
| B | 7 | 252 | 57629 | 364.61 | 728 | 699 | 156.1 |
| B | 0 | 63 | 38729 | 243.56 | 728 | 699 | 156.1 |
| C | 15 | 224 | 3382460 | 18436.32 | 674 | 666 | 183.4 |
| C | 8 | 7 | 688180 | 3748.08 | 674 | 666 | 183.4 |
| C | 9 | 38 | 287555 | 1564.01 | 674 | 666 | 183.4 |
| D | 2 | 120 | 183675 | 912.38 | 720 | 691 | 200.6 |
| D | 12 | 6 | 116424 | 577.06 | 720 | 691 | 200.6 |
| D | 2 | 249 | 96595 | 478.19 | 720 | 691 | 200.6 |
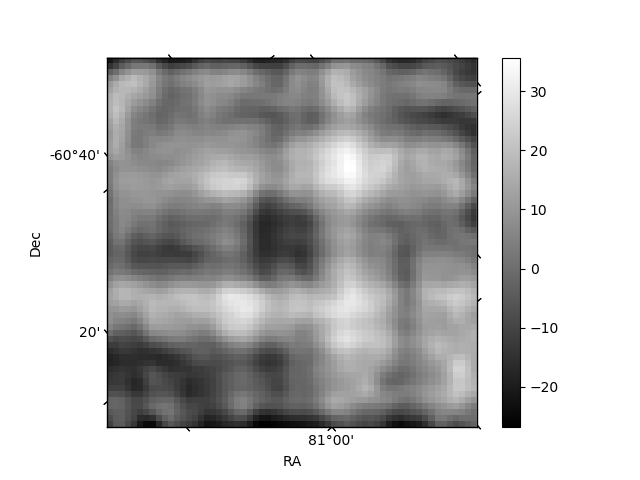
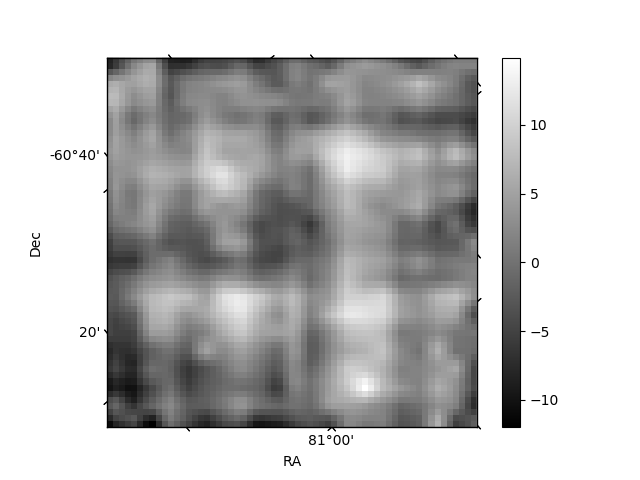
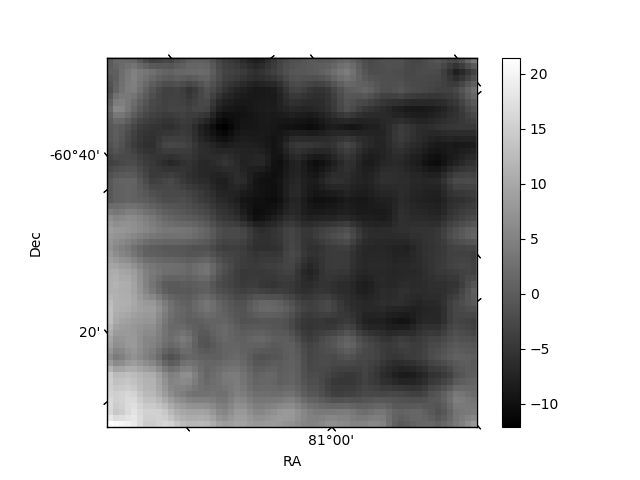
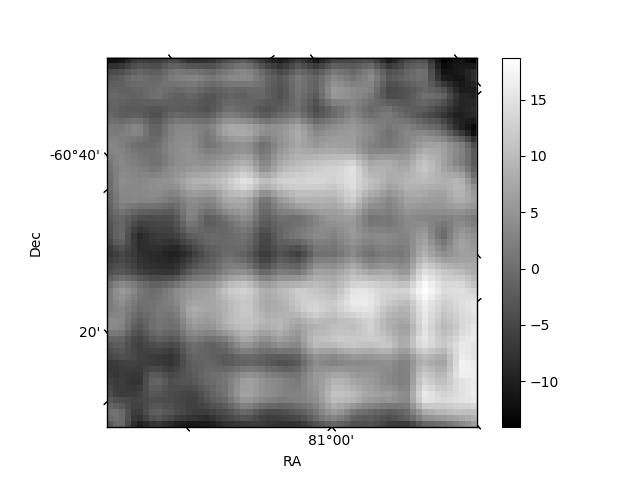
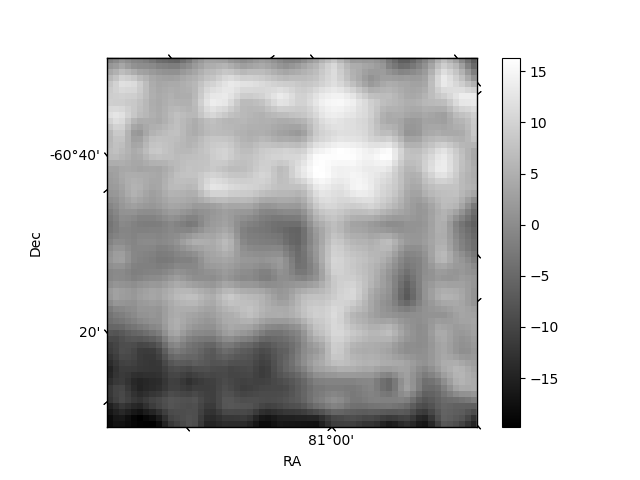
Histogram calculated using DETX and DETY for each event in the final _common_clean file
| Quadrant A | 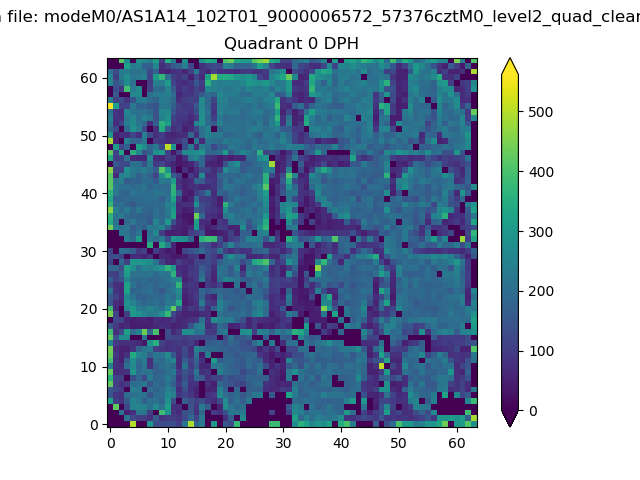 |
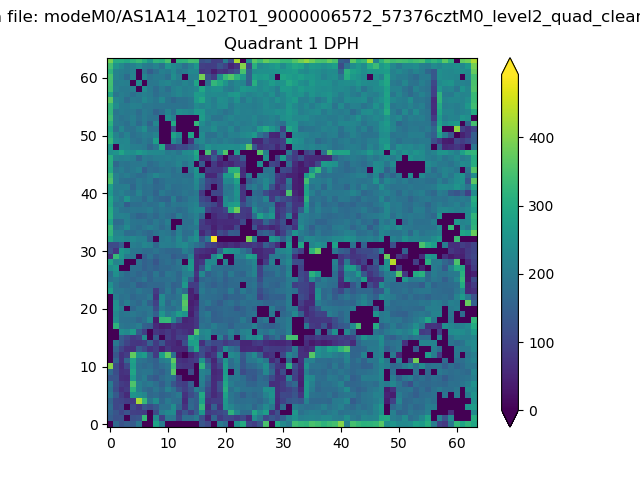 |
Quadrant B |
|---|---|---|---|
| Quadrant D | 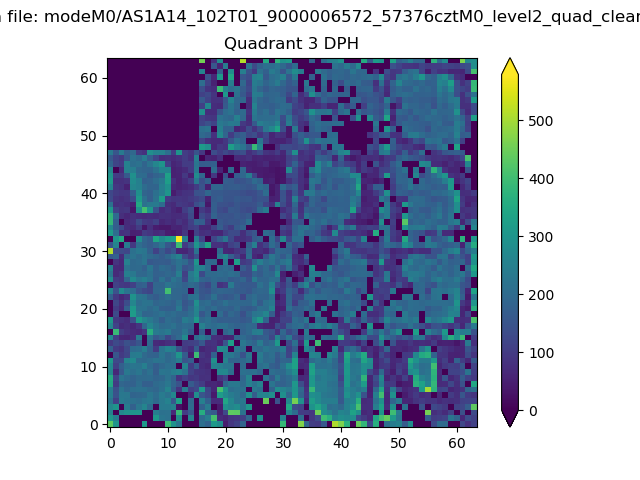 |
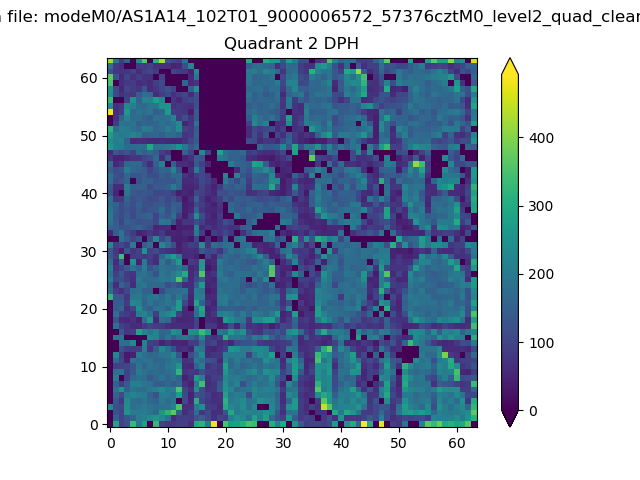 |
Quadrant C |
| Plot type | Count rate plots | Images |
|---|---|---|
| Comparison with Poisson distribution Blue bars denote a histogram of data divided into 1 sec bins. Red curve is a Poisson curve with rate = median count rate of data. |
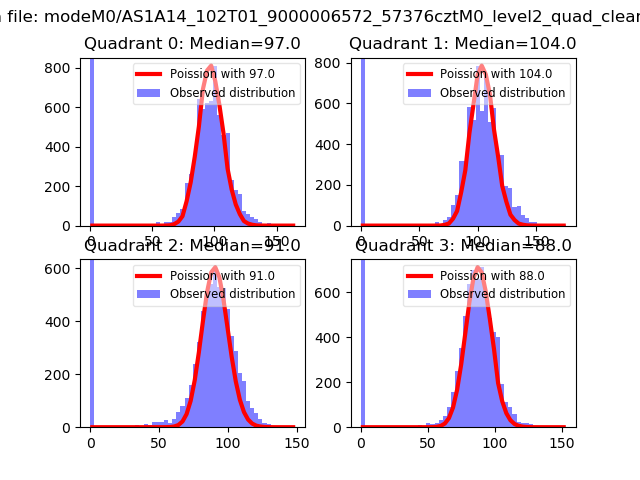 |
 |
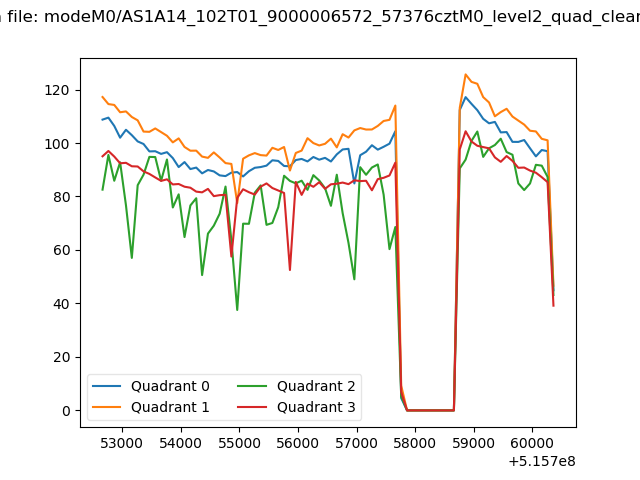
| Quadrant-wise count rates Data is divided into 100 sec bins |
 |
|
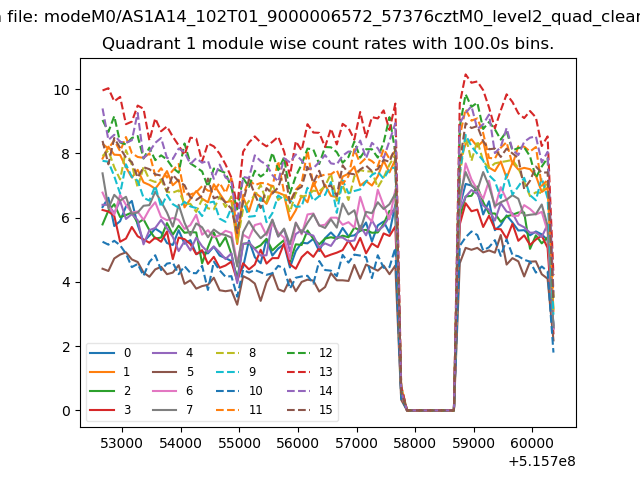
| Module-wise count rates for Quadrant A Data is divided into 100 sec bins |
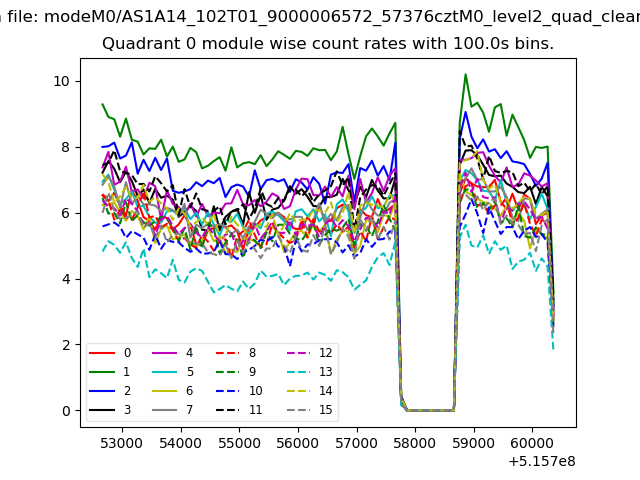 |
 |
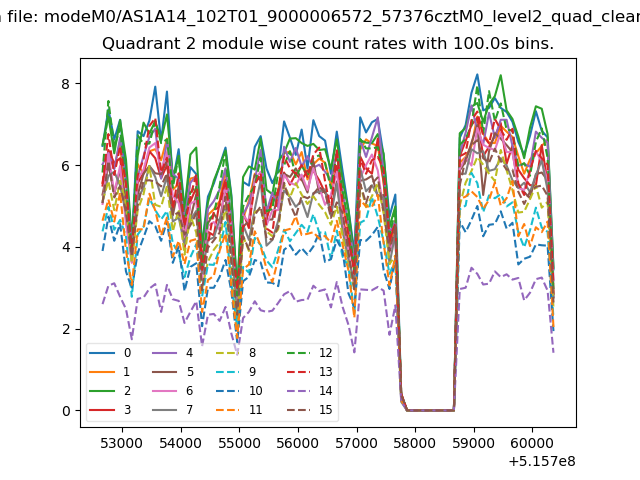
| Module-wise count rates for Quadrant B Data is divided into 100 sec bins |
 |
 |
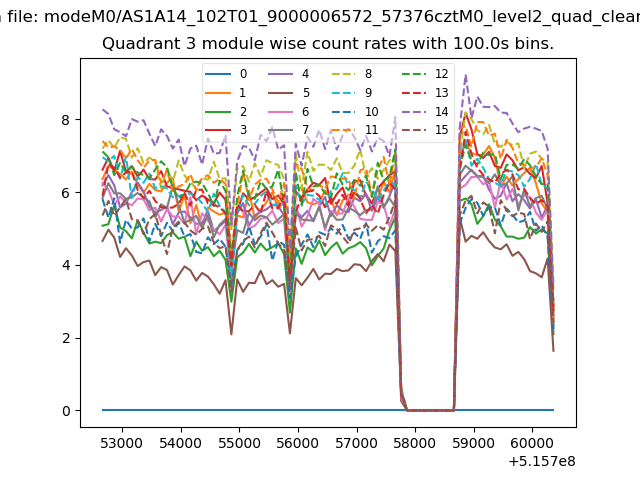
| Module-wise count rates for Quadrant C Data is divided into 100 sec bins |
 |
 |
| Module-wise count rates for Quadrant D Data is divided into 100 sec bins |
 |
 |
| Parameter | Plot |
|---|---|
| CZT HV Monitor |  |
| D_VDD | 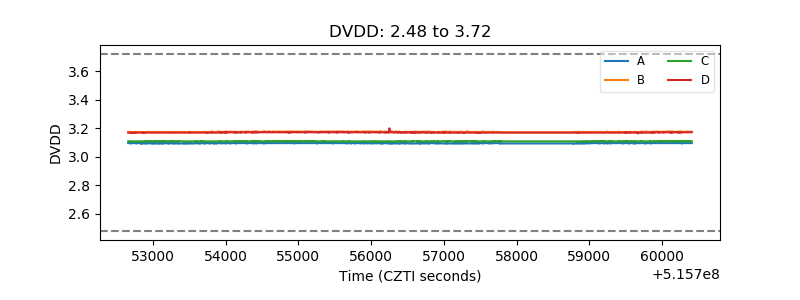 |
| Temperature 1 | 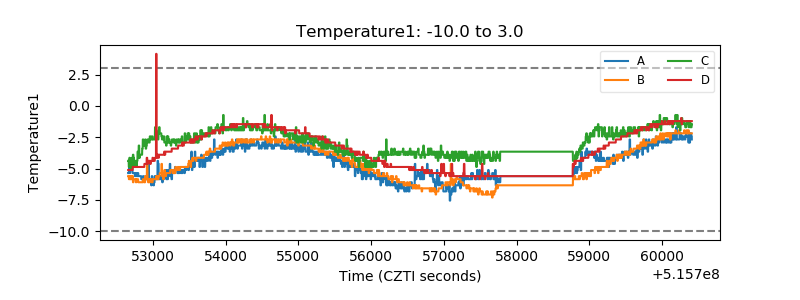 |
| Veto HV Monitor | 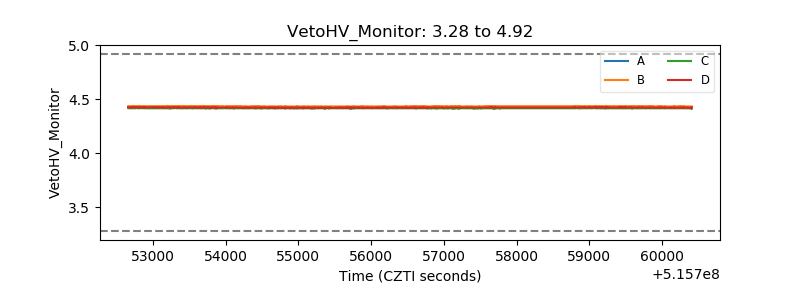 |
| Veto LLD | 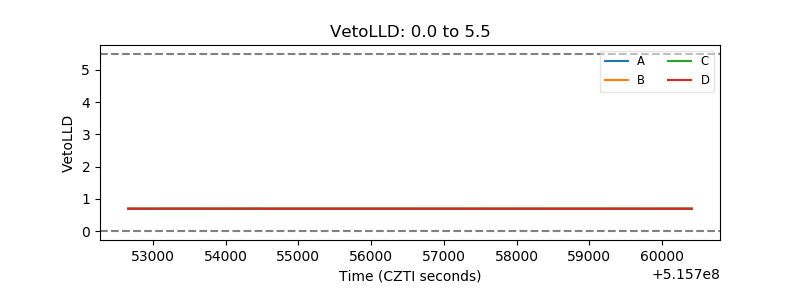 |
| Alpha Counter | 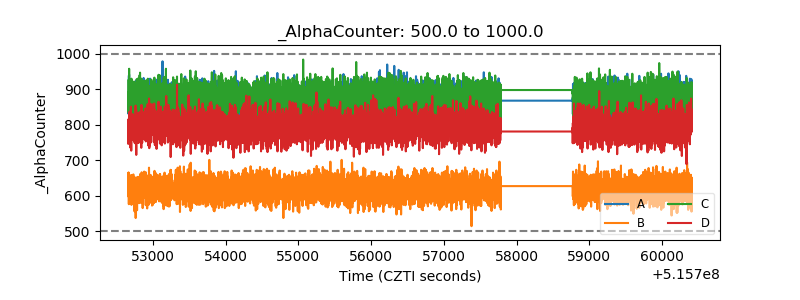 |
| _CPM_Rate | 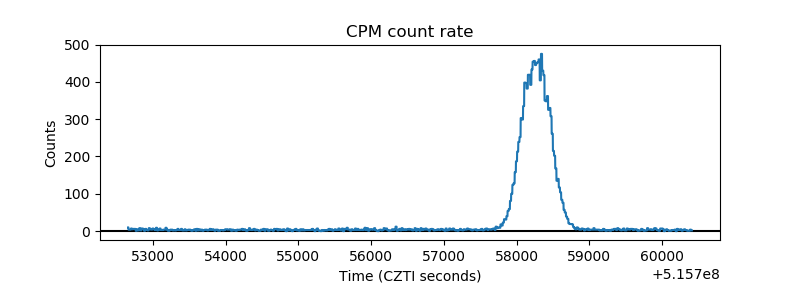 |
| CZT Counter | 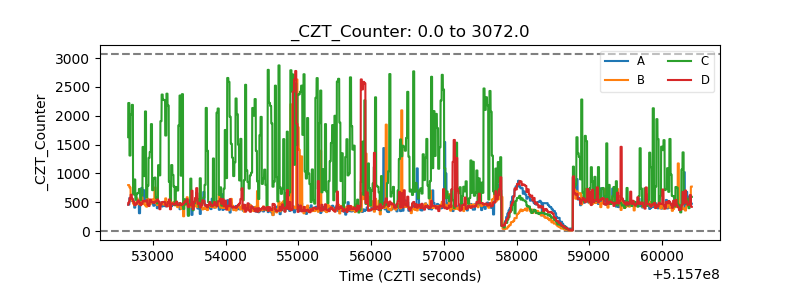 |
| +2.5 Volts monitor |  |
| +5 Volts monitor |  |
| _ROLL_ROT | 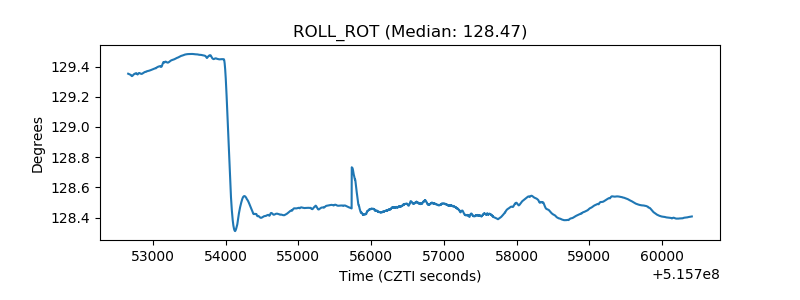 |
| _Roll_DEC | 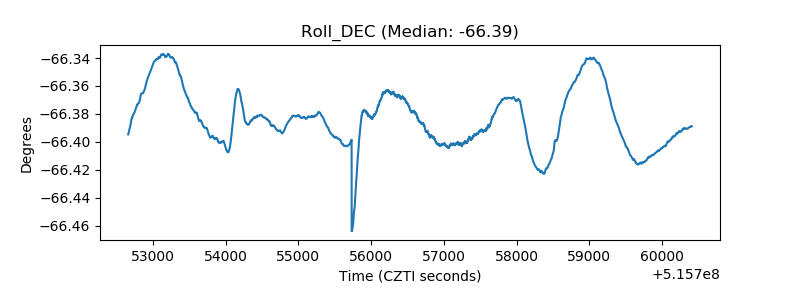 |
| _Roll_RA | 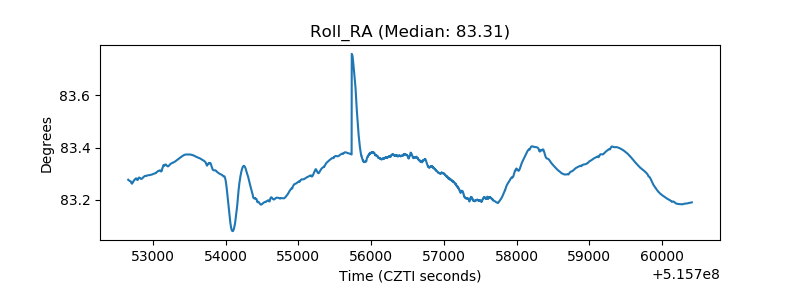 |
| Veto Counter | 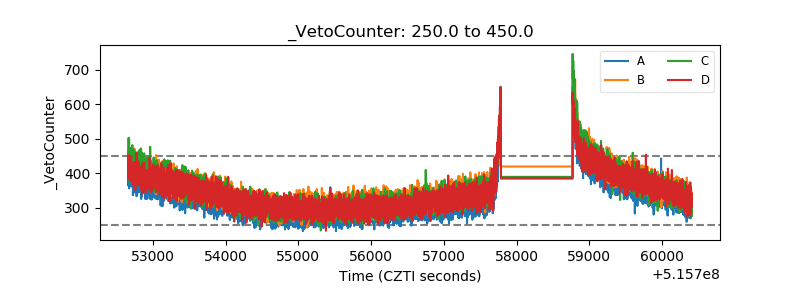 |