| Param | Original file | Final file |
|---|---|---|
| Filename | modeM0/AS1A14_102T01_9000006572_57377cztM0_level2.fits | modeM0/AS1A14_102T01_9000006572_57377cztM0_level2_quad_clean.evt |
| Size (bytes) | 401,538,240 | 87,249,600 |
| Size | 382.9 MB | 83.2 MB |
| Events in quadrant A | 2,841,418 | 581,975 |
| Events in quadrant B | 2,825,615 | 622,500 |
| Events in quadrant C | 5,400,427 | 510,251 |
| Events in quadrant D | 3,334,797 | 513,264 |
| Mode M0 | |||
|---|---|---|---|
| Quadrant | BADHDUFLAG | Total packets | Discarded packets |
| A | 0 | 12771 | 1 |
| B | 0 | 12785 | 1 |
| C | 0 | 20181 | 2 |
| D | 0 | 14188 | 1 |
| Mode M9 | |||
|---|---|---|---|
| Quadrant | BADHDUFLAG | Total packets | Discarded packets |
| A | 0 | 11 | 0 |
| B | 0 | 11 | 0 |
| C | 0 | 11 | 0 |
| D | 0 | 11 | 0 |
| Mode SS | |||
|---|---|---|---|
| Quadrant | BADHDUFLAG | Total packets | Discarded packets |
| A | 0 | 120 | 0 |
| B | 0 | 120 | 0 |
| C | 0 | 120 | 0 |
| D | 0 | 120 | 0 |
| Quadrant | Total seconds | Saturated seconds | Saturation percentage |
|---|---|---|---|
| A | 5926 | 89 | 1.501856% |
| B | 5927 | 79 | 1.332883% |
| C | 5926 | 624 | 10.529868% |
| D | 5926 | 220 | 3.712454% |
Noise dominated data is calculated using 1-second bins in cleaned event files. If a bin has >2000 counts, and if more than 50% of those come from <1% of pixels, then it is considered to be noise-dominated and hence unusable.
| Quadrant | # 1 sec bins | Bins with >0 counts | Bins with >2000 counts | High rate bins dominated by noise | Noise dominated (total time) | Noise dominated (detector-on time) | Marked lightcurve |
|---|---|---|---|---|---|---|---|
| A | 7011 | 5926 | 32 | 32 | 0.46% | 0.54% | 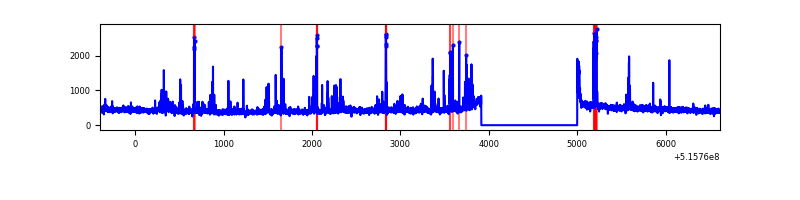 |
| B | 7012 | 5927 | 18 | 18 | 0.26% | 0.30% | 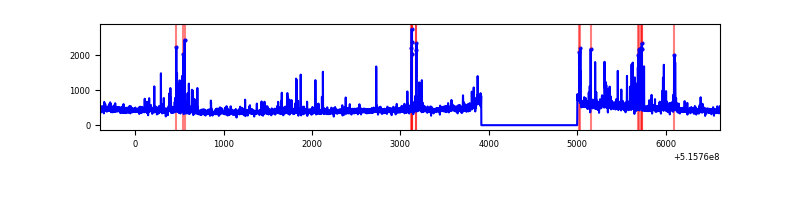 |
| C | 7011 | 5926 | 591 | 591 | 8.43% | 9.97% | 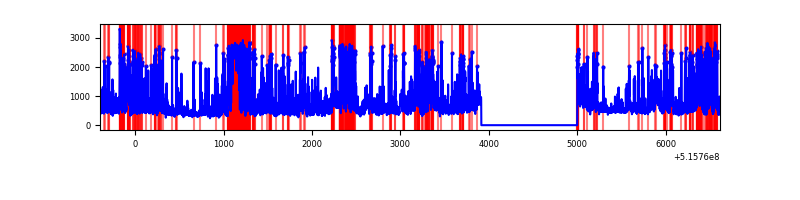 |
| D | 7010 | 5925 | 200 | 200 | 2.85% | 3.38% | 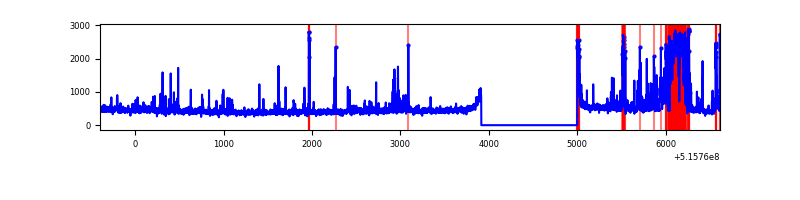 |
Top three noisy pixels from each quadrant. If the there are fewer than three noisy pixels in the level2.evt file, extra rows are filled as -1
| Pixel properties | Quadrant properties | ||||||
|---|---|---|---|---|---|---|---|
| Quadrant | DetID | PixID | Counts | Sigma | Mean | Median | Sigma |
| A | 3 | 61 | 167955 | 1036.67 | 649 | 633 | 161.4 |
| A | 3 | 14 | 50813 | 310.9 | 649 | 633 | 161.4 |
| A | 10 | 251 | 49147 | 300.58 | 649 | 633 | 161.4 |
| B | 5 | 185 | 90726 | 659.52 | 634 | 611 | 136.6 |
| B | 10 | 247 | 81830 | 594.42 | 634 | 611 | 136.6 |
| B | 10 | 16 | 28875 | 206.86 | 634 | 611 | 136.6 |
| C | 15 | 224 | 2639485 | 16190.59 | 592 | 587 | 163.0 |
| C | 8 | 7 | 241305 | 1476.89 | 592 | 587 | 163.0 |
| C | 14 | 254 | 48715 | 295.28 | 592 | 587 | 163.0 |
| D | 8 | 240 | 371208 | 2108.54 | 618 | 590 | 175.8 |
| D | 15 | 142 | 125196 | 708.92 | 618 | 590 | 175.8 |
| D | 8 | 160 | 96033 | 543.0 | 618 | 590 | 175.8 |
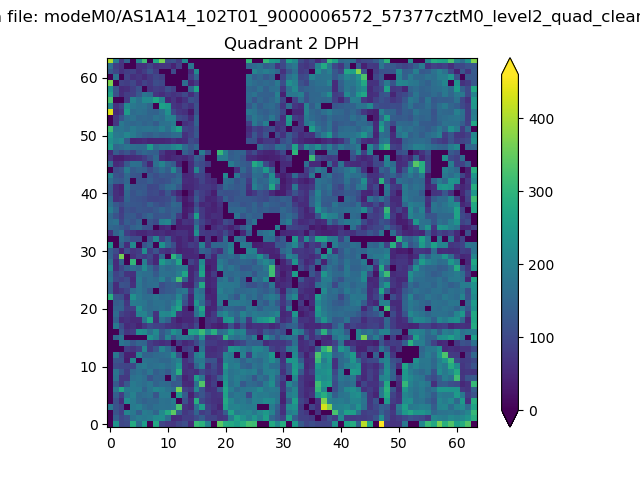
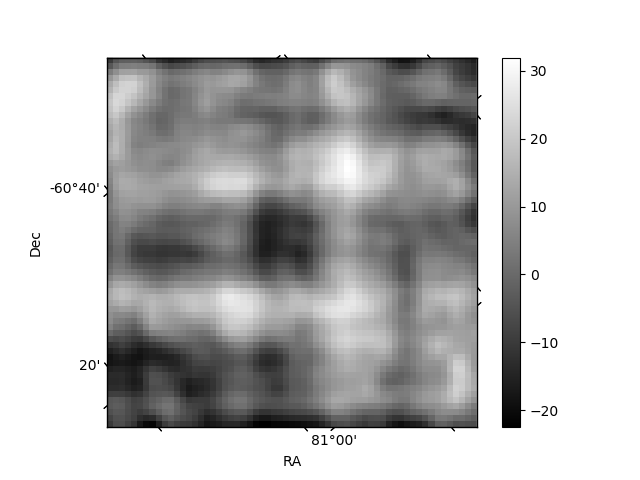
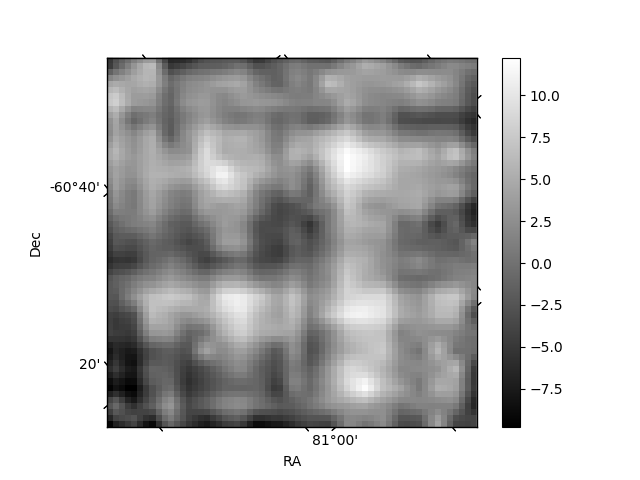
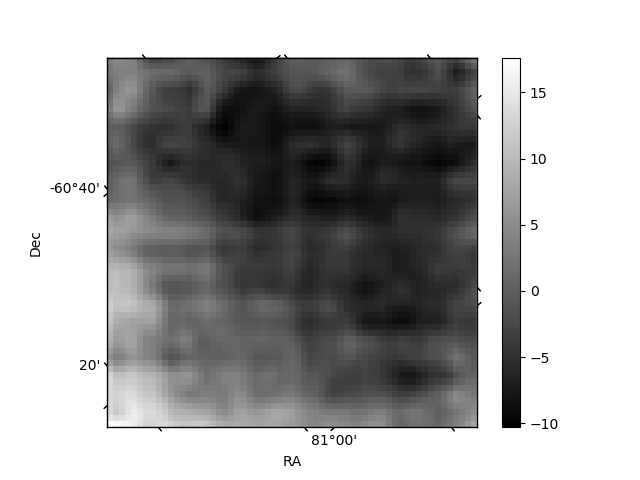
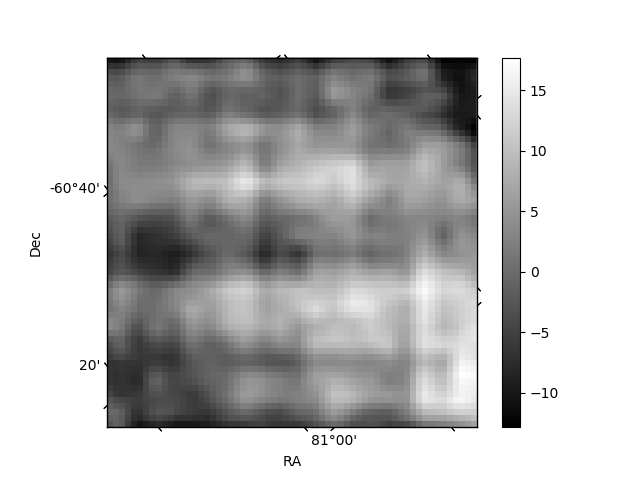
Histogram calculated using DETX and DETY for each event in the final _common_clean file
| Quadrant A | 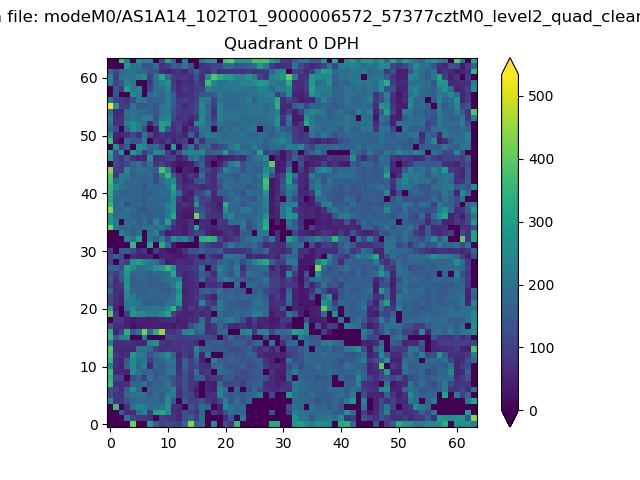 |
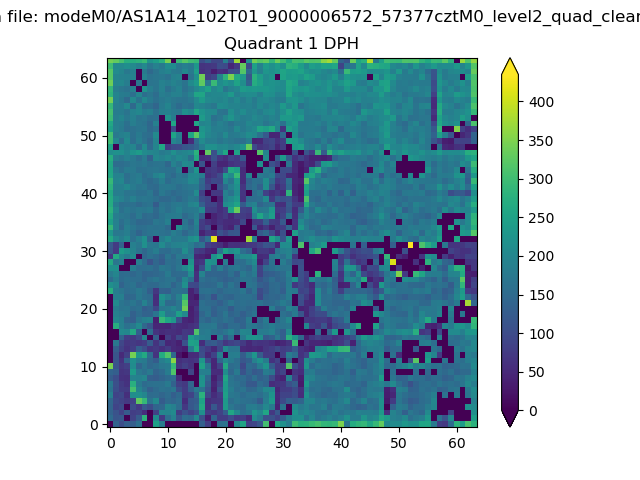 |
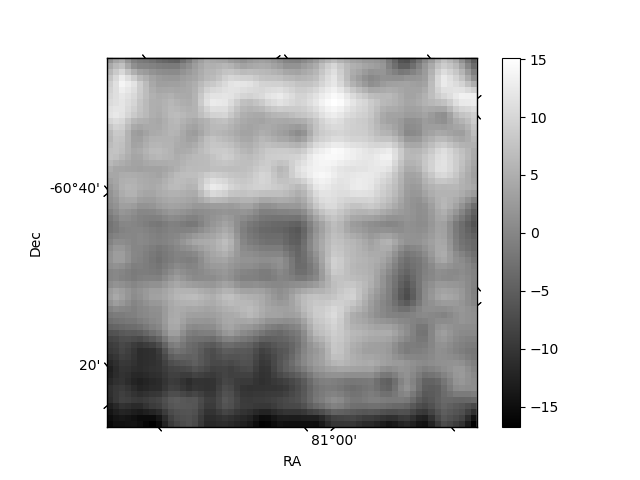
Quadrant B |
|---|---|---|---|
| Quadrant D | 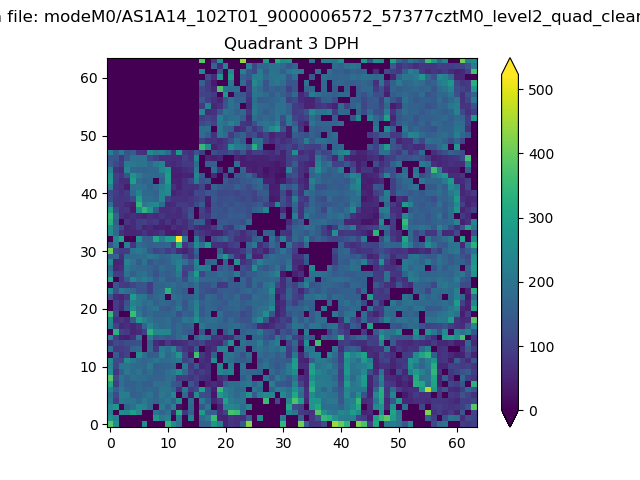 |
 |
Quadrant C |
| Plot type | Count rate plots | Images |
|---|---|---|
| Comparison with Poisson distribution Blue bars denote a histogram of data divided into 1 sec bins. Red curve is a Poisson curve with rate = median count rate of data. |
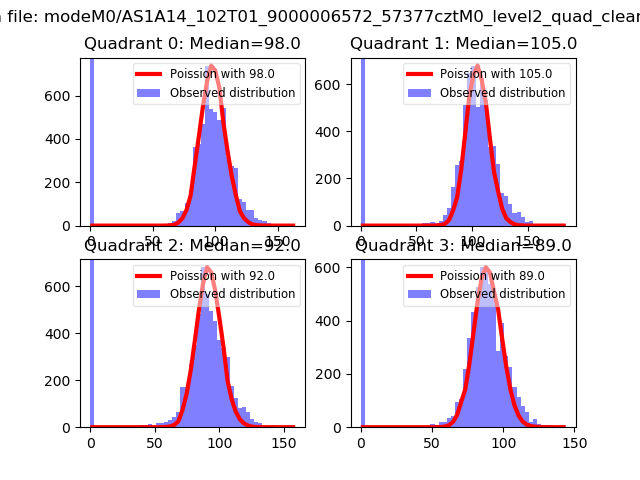 |
 |
| Quadrant-wise count rates Data is divided into 100 sec bins |
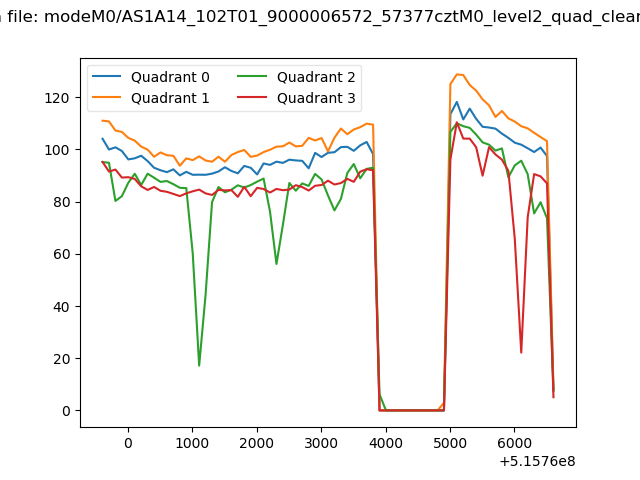 |
|
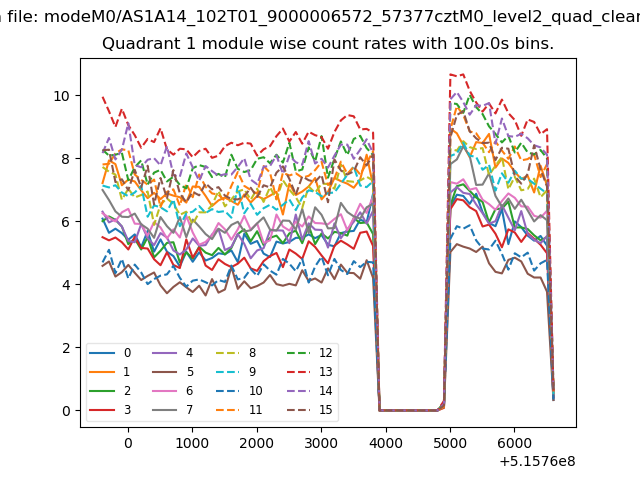
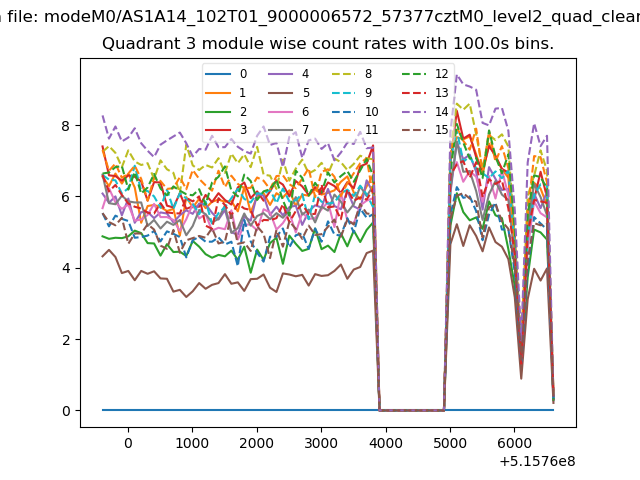
| Module-wise count rates for Quadrant A Data is divided into 100 sec bins |
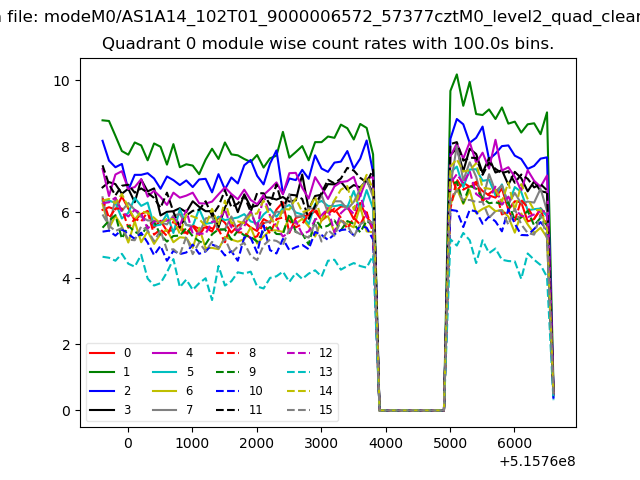 |
 |
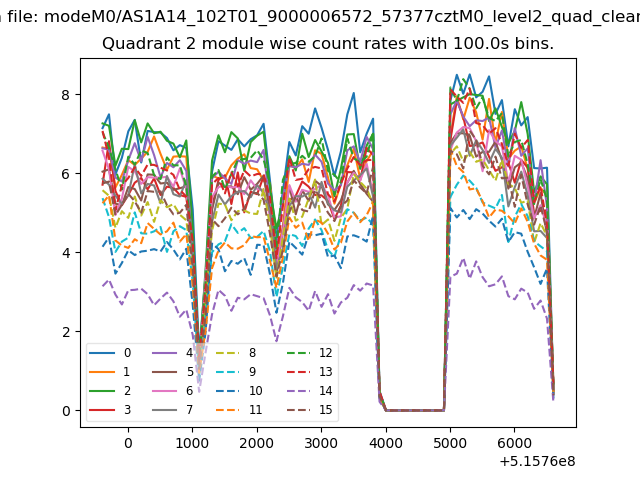
| Module-wise count rates for Quadrant B Data is divided into 100 sec bins |
 |
 |
| Module-wise count rates for Quadrant C Data is divided into 100 sec bins |
 |
 |
| Module-wise count rates for Quadrant D Data is divided into 100 sec bins |
 |
 |
| Parameter | Plot |
|---|---|
| CZT HV Monitor | 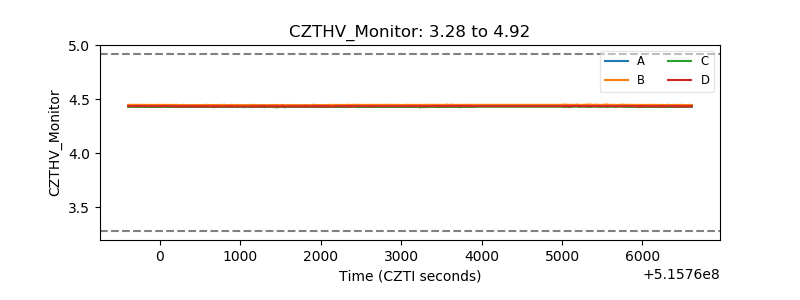 |
| D_VDD | 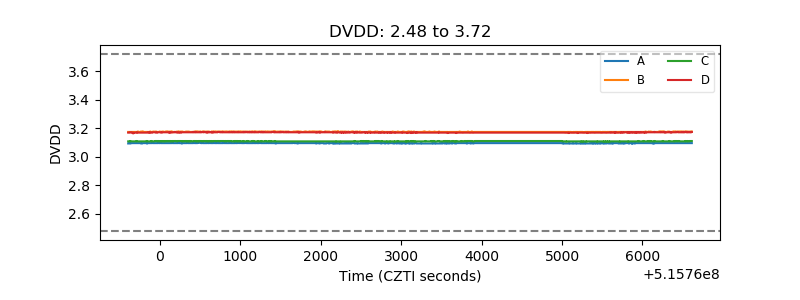 |
| Temperature 1 | 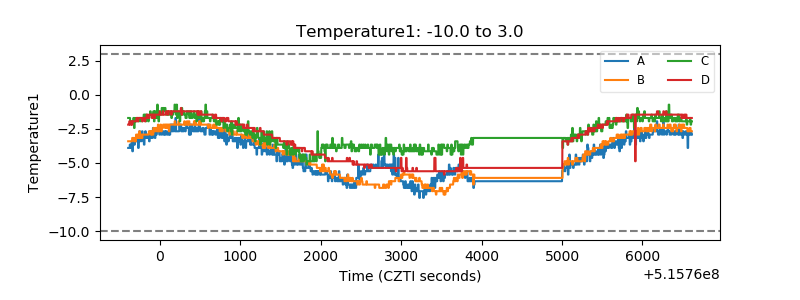 |
| Veto HV Monitor | 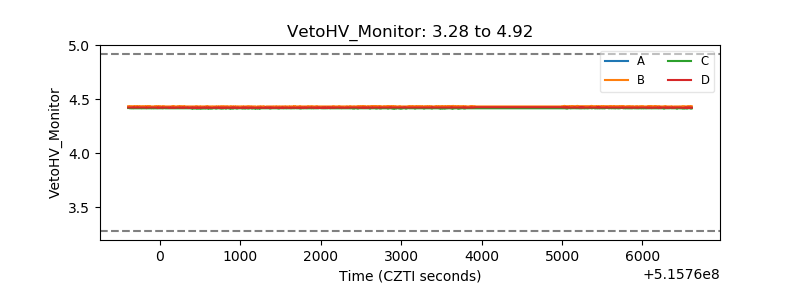 |
| Veto LLD | 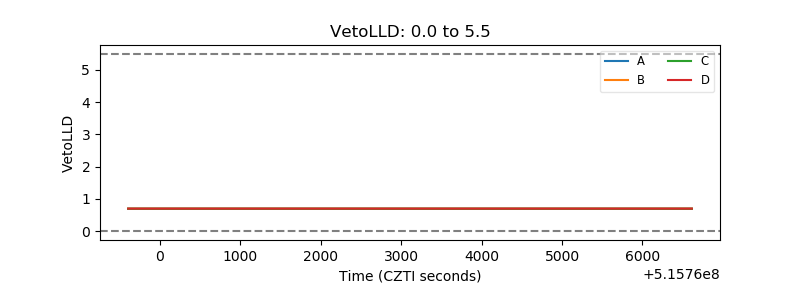 |
| Alpha Counter | 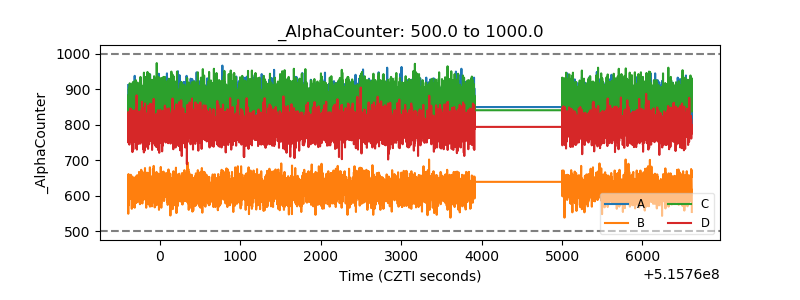 |
| _CPM_Rate | 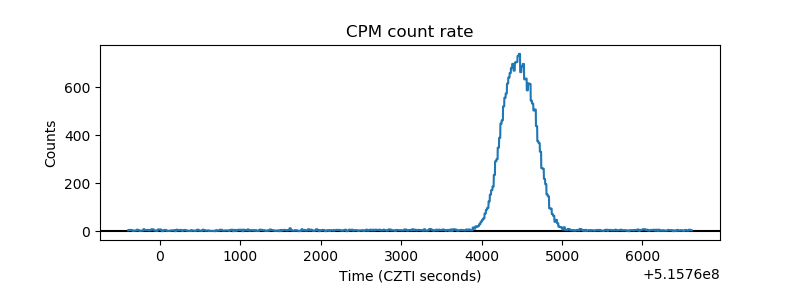 |
| CZT Counter | 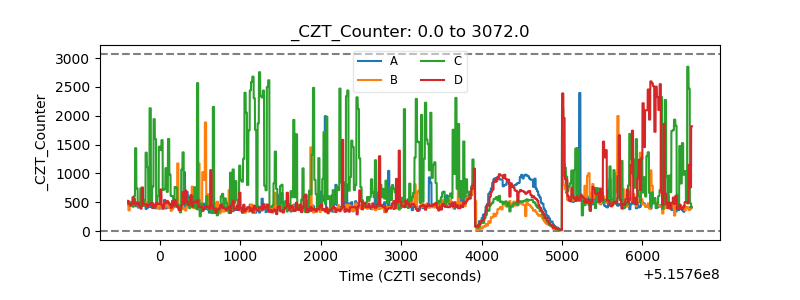 |
| +2.5 Volts monitor | 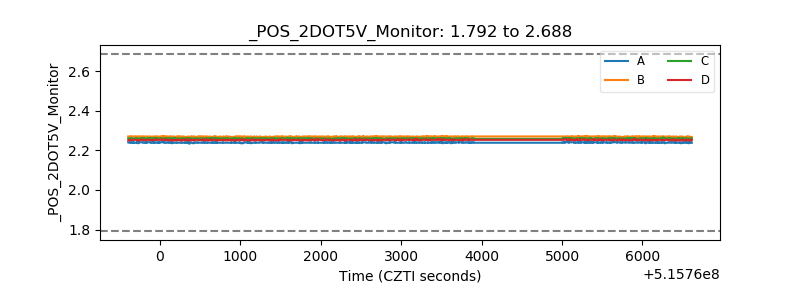 |
| +5 Volts monitor |  |
| _ROLL_ROT | 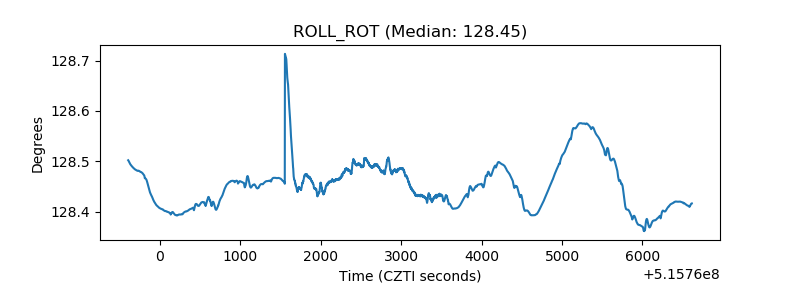 |
| _Roll_DEC | 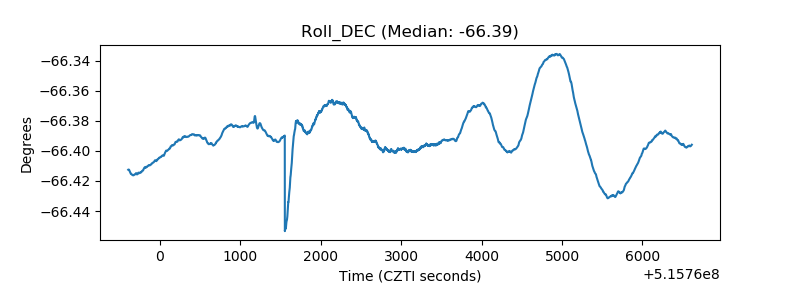 |
| _Roll_RA | 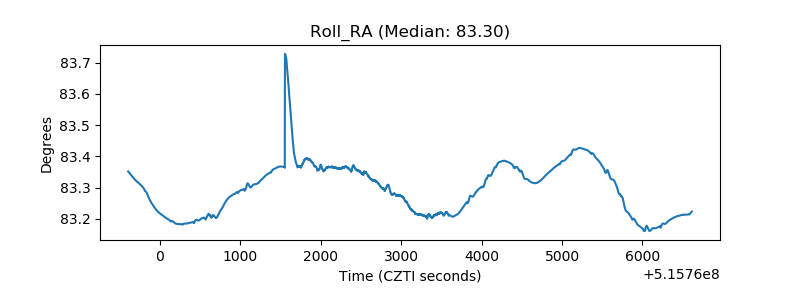 |
| Veto Counter | 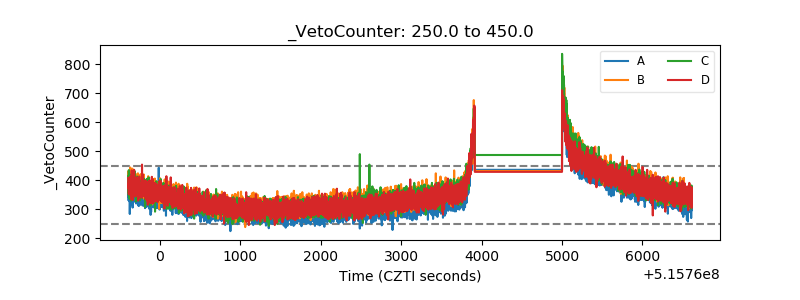 |