| Param | Original file | Final file |
|---|---|---|
| Filename | modeM0/AS1A14_102T01_9000006572_57378cztM0_level2.fits | modeM0/AS1A14_102T01_9000006572_57378cztM0_level2_quad_clean.evt |
| Size (bytes) | 386,305,920 | 87,255,360 |
| Size | 368.4 MB | 83.2 MB |
| Events in quadrant A | 2,561,383 | 586,331 |
| Events in quadrant B | 2,881,694 | 619,833 |
| Events in quadrant C | 5,156,114 | 516,429 |
| Events in quadrant D | 3,246,817 | 512,480 |
| Mode M0 | |||
|---|---|---|---|
| Quadrant | BADHDUFLAG | Total packets | Discarded packets |
| A | 0 | 11934 | 1 |
| B | 0 | 12760 | 1 |
| C | 0 | 19408 | 1 |
| D | 0 | 13840 | 1 |
| Mode M9 | |||
|---|---|---|---|
| Quadrant | BADHDUFLAG | Total packets | Discarded packets |
| A | 0 | 12 | 0 |
| B | 0 | 12 | 0 |
| C | 0 | 12 | 0 |
| D | 0 | 12 | 0 |
| Mode SS | |||
|---|---|---|---|
| Quadrant | BADHDUFLAG | Total packets | Discarded packets |
| A | 0 | 118 | 0 |
| B | 0 | 118 | 0 |
| C | 0 | 118 | 0 |
| D | 0 | 118 | 0 |
| Quadrant | Total seconds | Saturated seconds | Saturation percentage |
|---|---|---|---|
| A | 5829 | 63 | 1.080803% |
| B | 5830 | 107 | 1.835334% |
| C | 5830 | 527 | 9.039451% |
| D | 5830 | 200 | 3.430532% |
Noise dominated data is calculated using 1-second bins in cleaned event files. If a bin has >2000 counts, and if more than 50% of those come from <1% of pixels, then it is considered to be noise-dominated and hence unusable.
| Quadrant | # 1 sec bins | Bins with >0 counts | Bins with >2000 counts | High rate bins dominated by noise | Noise dominated (total time) | Noise dominated (detector-on time) | Marked lightcurve |
|---|---|---|---|---|---|---|---|
| A | 6973 | 5828 | 1 | 1 | 0.01% | 0.02% | 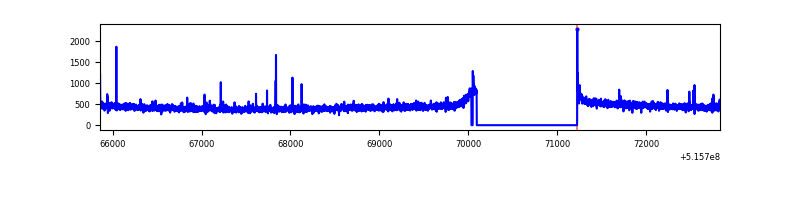 |
| B | 6974 | 5829 | 20 | 20 | 0.29% | 0.34% | 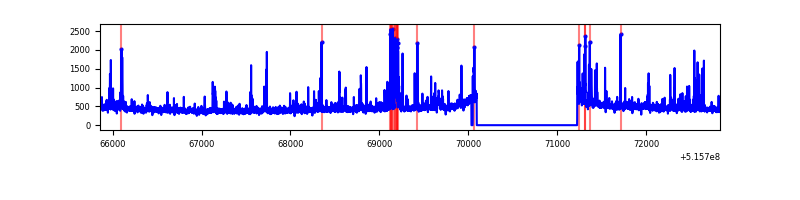 |
| C | 6974 | 5829 | 462 | 462 | 6.62% | 7.93% | 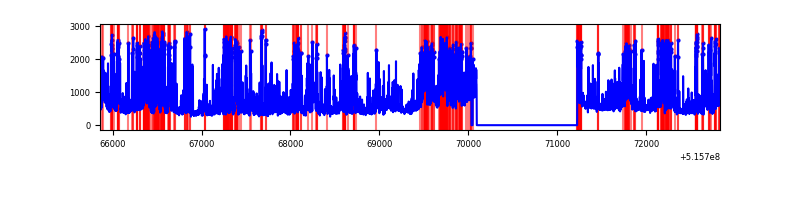 |
| D | 6974 | 5829 | 171 | 171 | 2.45% | 2.93% | 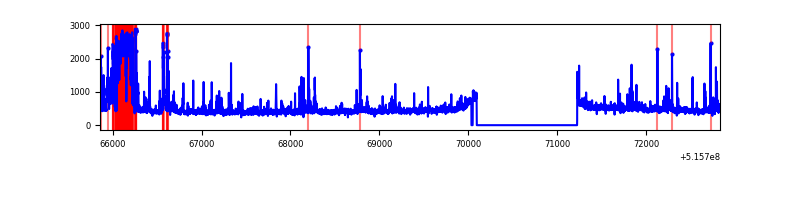 |
Top three noisy pixels from each quadrant. If the there are fewer than three noisy pixels in the level2.evt file, extra rows are filled as -1
| Pixel properties | Quadrant properties | ||||||
|---|---|---|---|---|---|---|---|
| Quadrant | DetID | PixID | Counts | Sigma | Mean | Median | Sigma |
| A | 3 | 14 | 14596 | 87.45 | 646 | 628 | 159.7 |
| A | 13 | 248 | 11971 | 71.01 | 646 | 628 | 159.7 |
| A | 3 | 61 | 9106 | 53.08 | 646 | 628 | 159.7 |
| B | 5 | 185 | 175599 | 1286.0 | 630 | 606 | 136.1 |
| B | 0 | 153 | 40538 | 293.45 | 630 | 606 | 136.1 |
| B | 4 | 201 | 23970 | 171.7 | 630 | 606 | 136.1 |
| C | 15 | 224 | 2237592 | 13824.48 | 589 | 583 | 161.8 |
| C | 8 | 7 | 195058 | 1201.84 | 589 | 583 | 161.8 |
| C | 12 | 249 | 85604 | 525.42 | 589 | 583 | 161.8 |
| D | 8 | 240 | 384568 | 2209.02 | 613 | 585 | 173.8 |
| D | 15 | 142 | 96541 | 552.03 | 613 | 585 | 173.8 |
| D | 3 | 12 | 65473 | 373.29 | 613 | 585 | 173.8 |
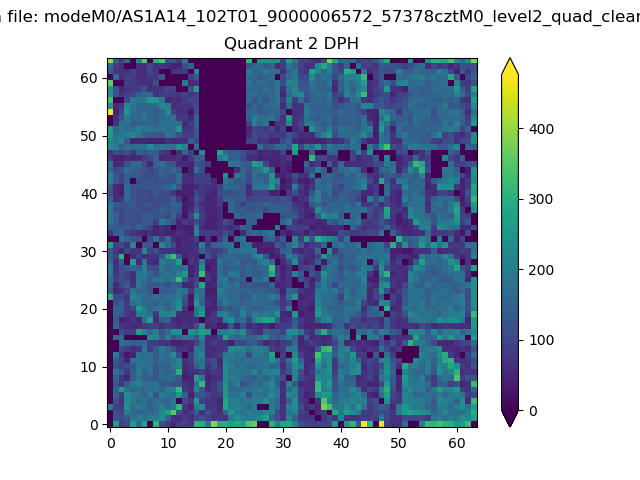
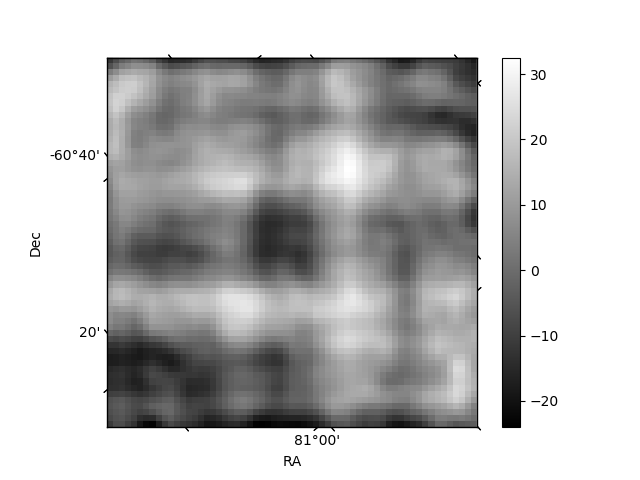
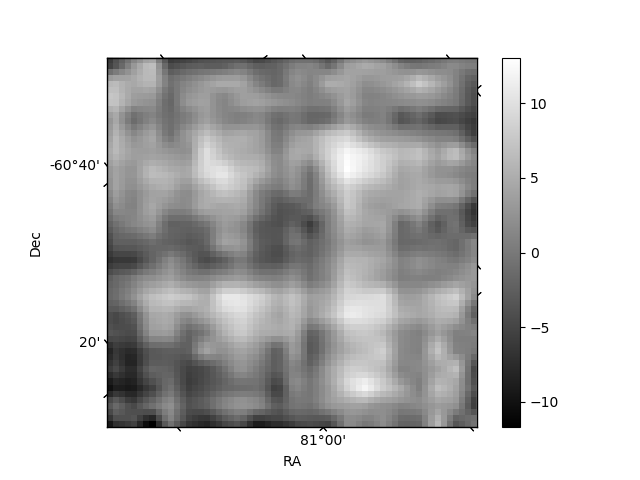
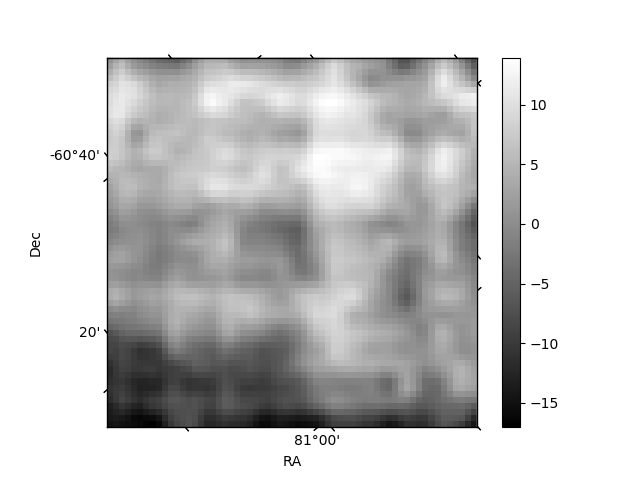
Histogram calculated using DETX and DETY for each event in the final _common_clean file
| Quadrant A | 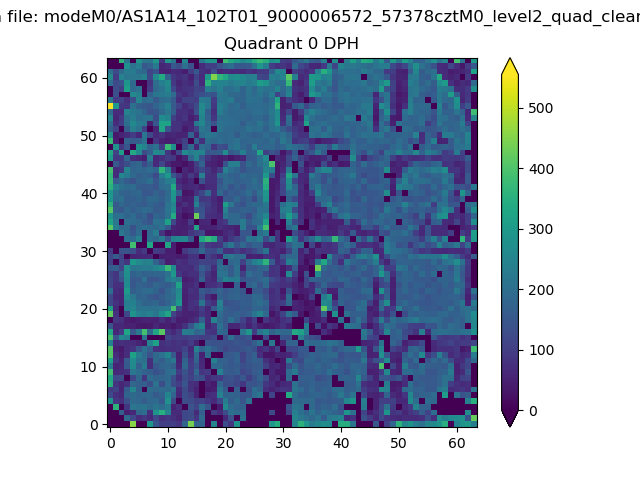 |
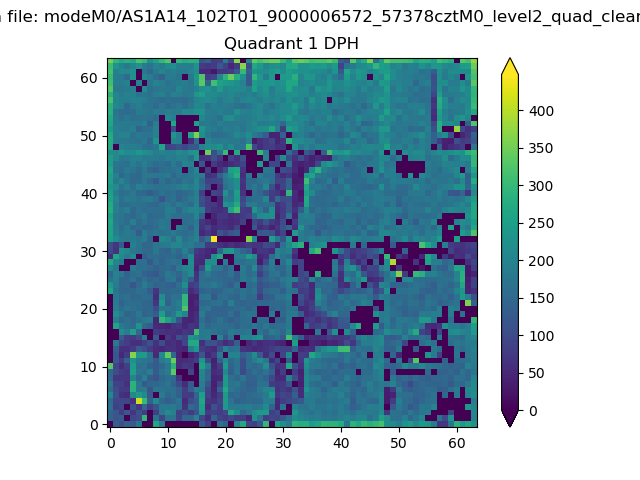 |
Quadrant B |
|---|---|---|---|
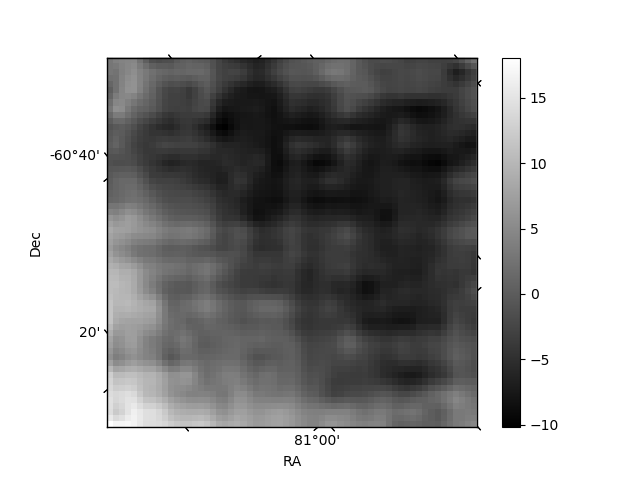
| Quadrant D | 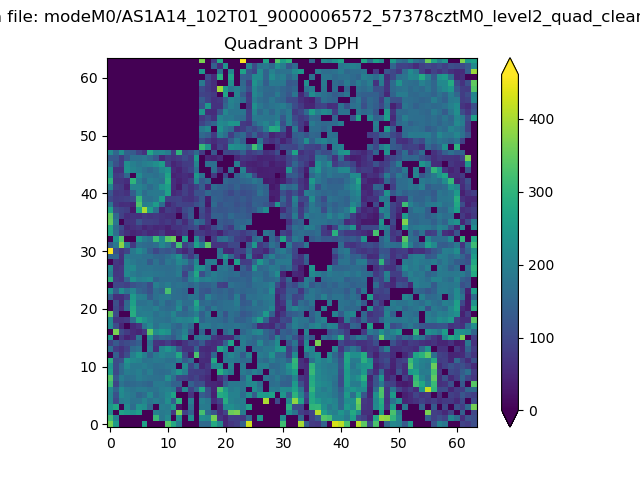 |
 |
Quadrant C |
| Plot type | Count rate plots | Images |
|---|---|---|
| Comparison with Poisson distribution Blue bars denote a histogram of data divided into 1 sec bins. Red curve is a Poisson curve with rate = median count rate of data. |
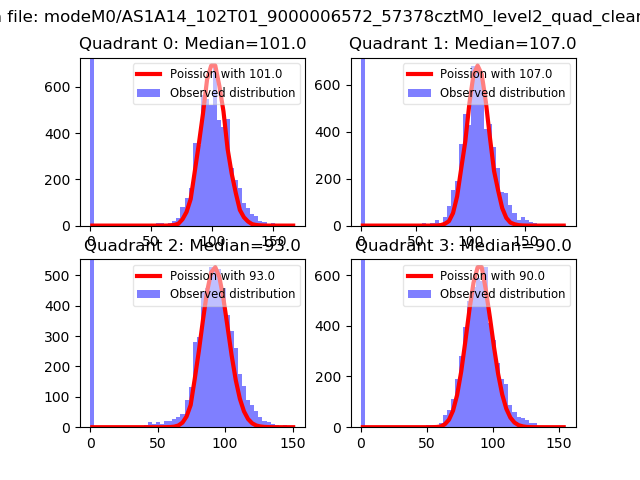 |
 |
| Quadrant-wise count rates Data is divided into 100 sec bins |
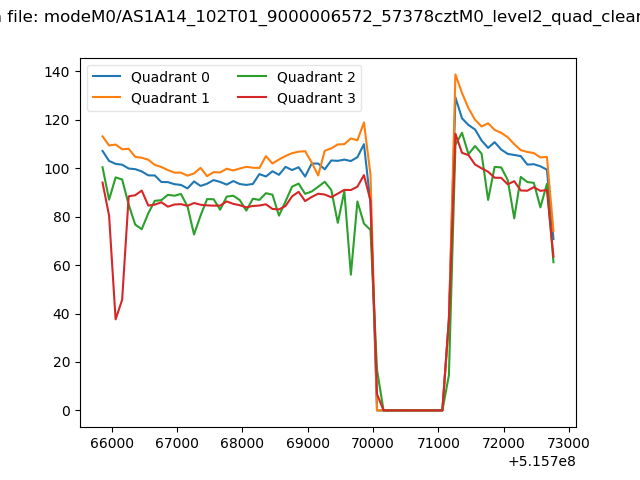 |
|
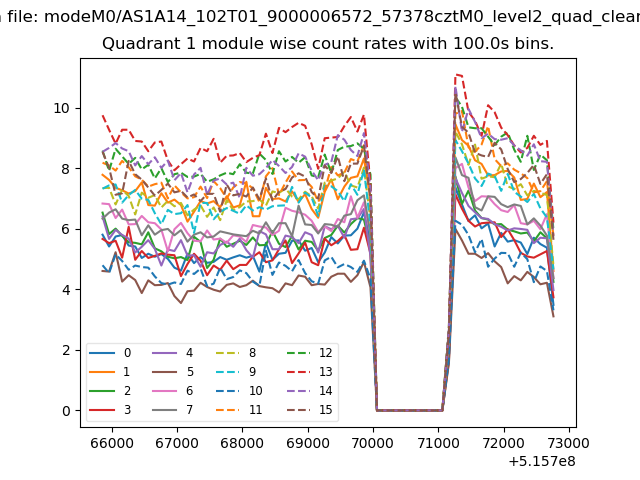
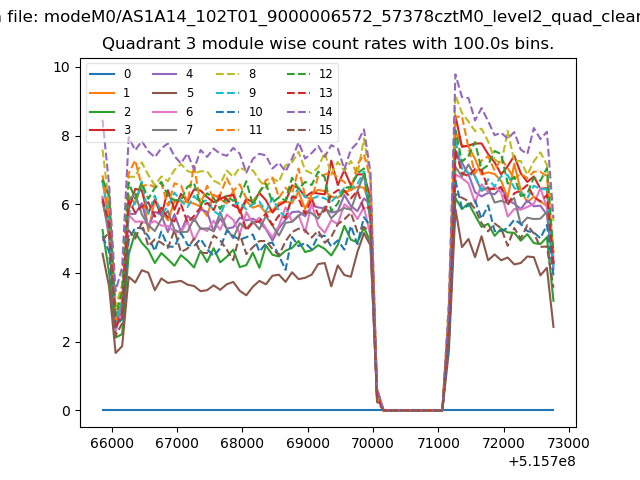
| Module-wise count rates for Quadrant A Data is divided into 100 sec bins |
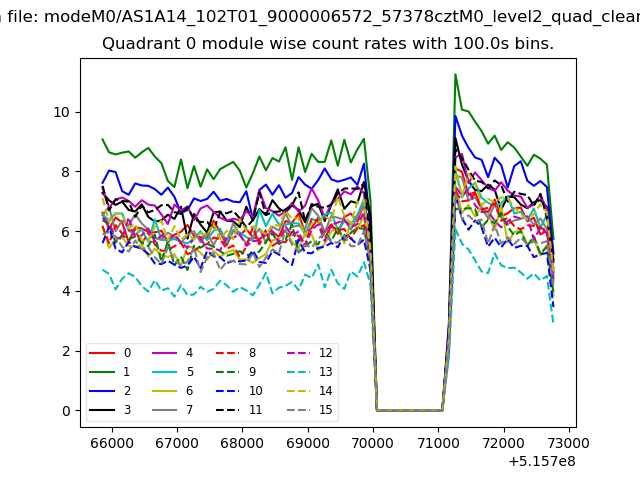 |
 |
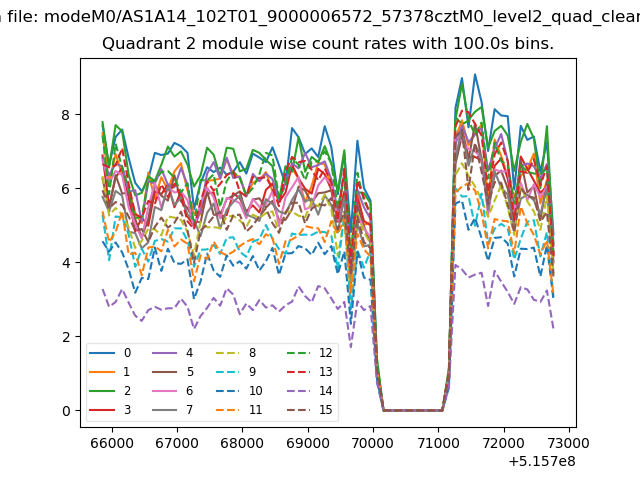
| Module-wise count rates for Quadrant B Data is divided into 100 sec bins |
 |
 |
| Module-wise count rates for Quadrant C Data is divided into 100 sec bins |
 |
 |
| Module-wise count rates for Quadrant D Data is divided into 100 sec bins |
 |
 |
| Parameter | Plot |
|---|---|
| CZT HV Monitor | 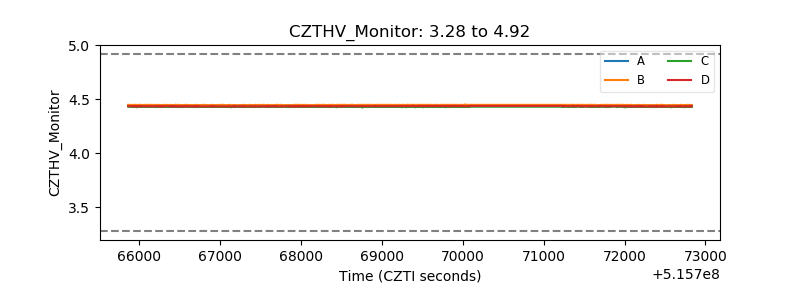 |
| D_VDD | 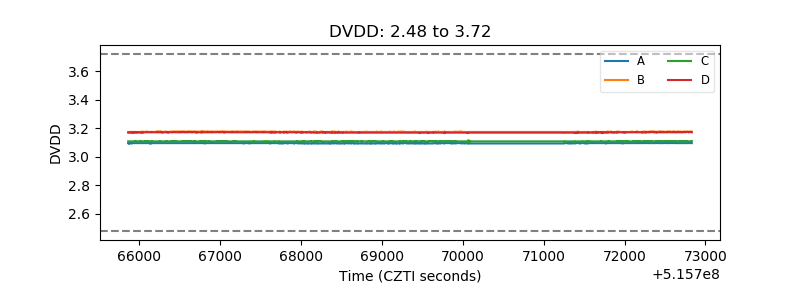 |
| Temperature 1 | 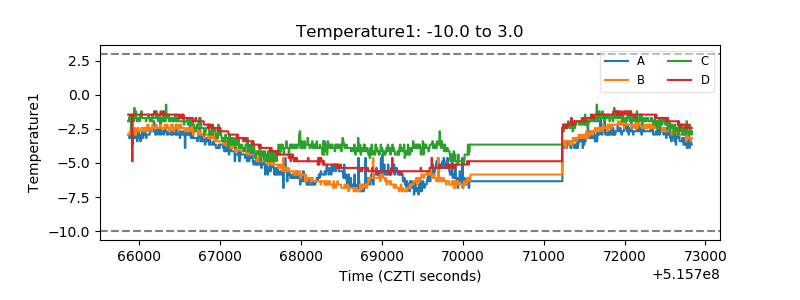 |
| Veto HV Monitor | 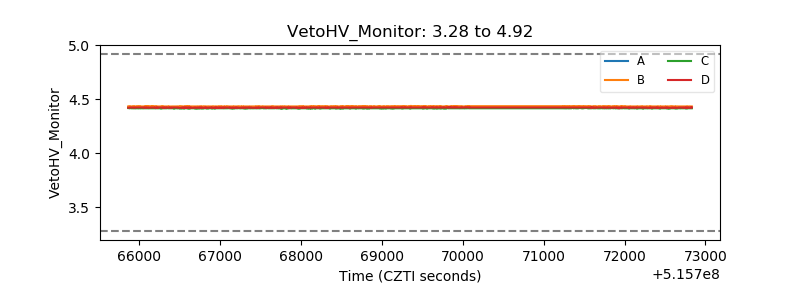 |
| Veto LLD | 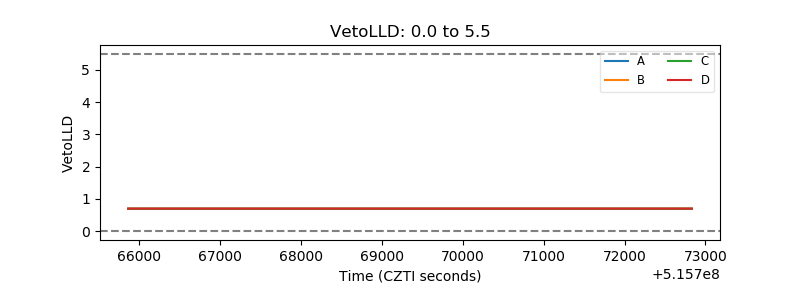 |
| Alpha Counter | 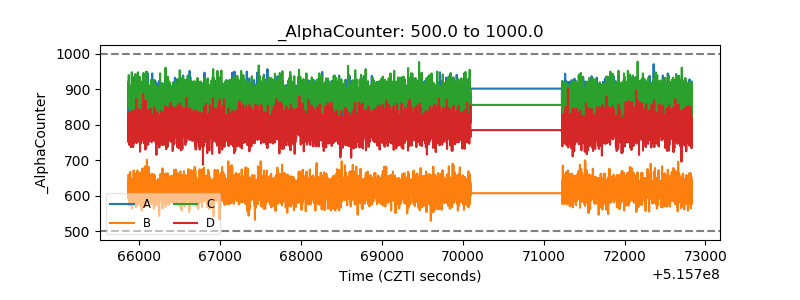 |
| _CPM_Rate | 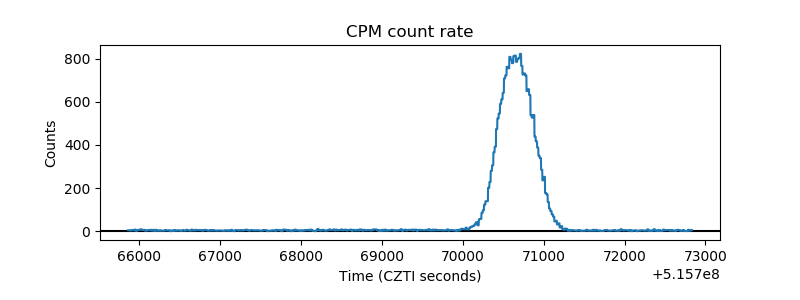 |
| CZT Counter | 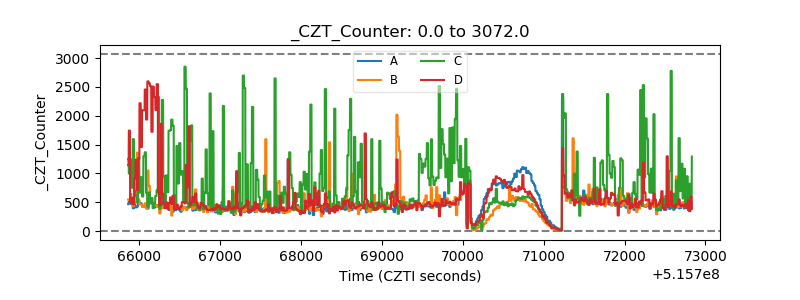 |
| +2.5 Volts monitor | 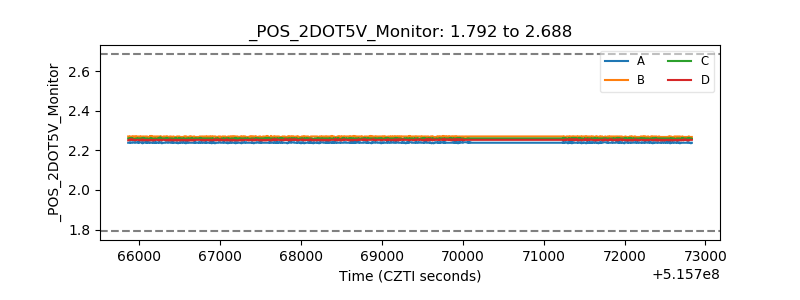 |
| +5 Volts monitor | 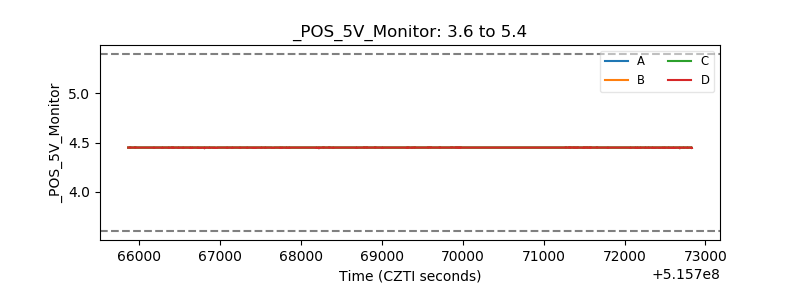 |
| _ROLL_ROT | 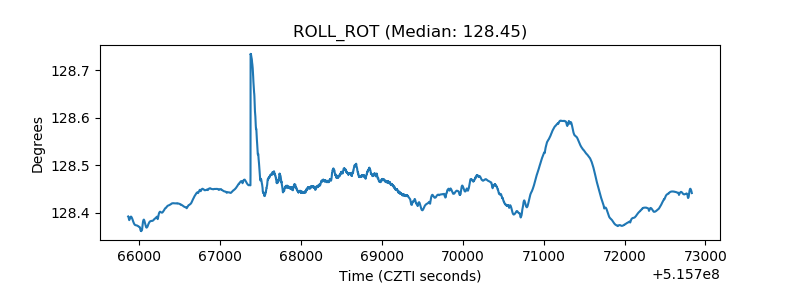 |
| _Roll_DEC | 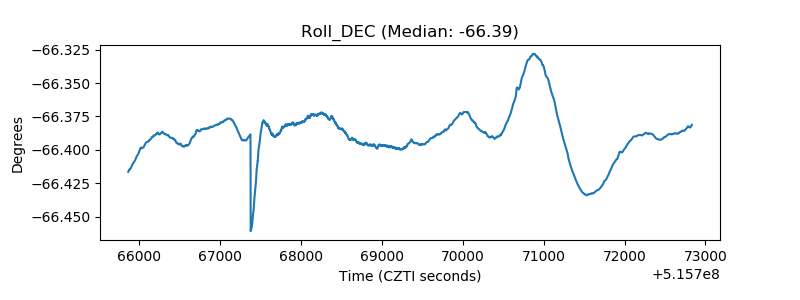 |
| _Roll_RA | 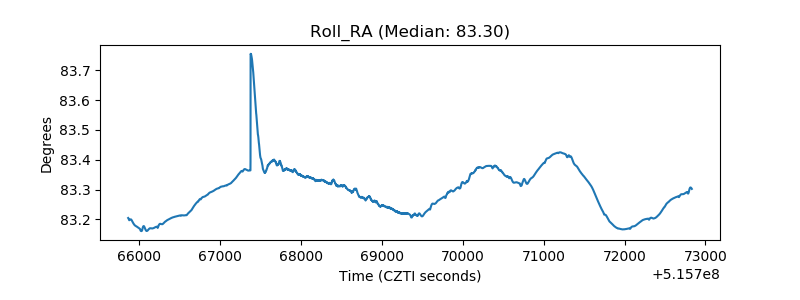 |
| Veto Counter | 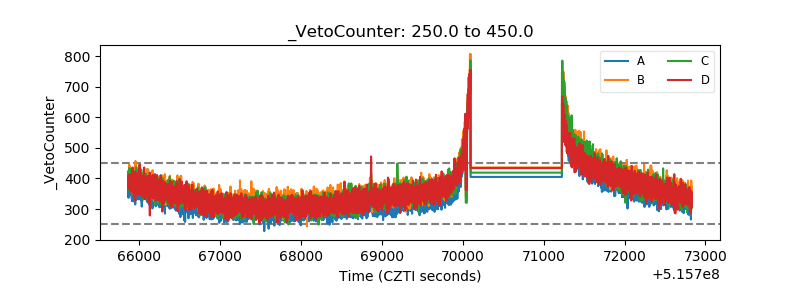 |