| Param | Original file | Final file |
|---|---|---|
| Filename | modeM0/AS1A14_102T01_9000006572_57379cztM0_level2.fits | modeM0/AS1A14_102T01_9000006572_57379cztM0_level2_quad_clean.evt |
| Size (bytes) | 422,876,160 | 98,265,600 |
| Size | 403.3 MB | 93.7 MB |
| Events in quadrant A | 2,964,421 | 661,535 |
| Events in quadrant B | 3,247,520 | 696,221 |
| Events in quadrant C | 5,754,954 | 578,118 |
| Events in quadrant D | 3,183,587 | 588,306 |
| Mode M0 | |||
|---|---|---|---|
| Quadrant | BADHDUFLAG | Total packets | Discarded packets |
| A | 0 | 13457 | 1 |
| B | 0 | 14193 | 1 |
| C | 0 | 21629 | 1 |
| D | 0 | 14058 | 1 |
| Mode M9 | |||
|---|---|---|---|
| Quadrant | BADHDUFLAG | Total packets | Discarded packets |
| A | 0 | 12 | 0 |
| B | 0 | 12 | 0 |
| C | 0 | 12 | 0 |
| D | 0 | 12 | 0 |
| Mode SS | |||
|---|---|---|---|
| Quadrant | BADHDUFLAG | Total packets | Discarded packets |
| A | 0 | 132 | 0 |
| B | 0 | 132 | 0 |
| C | 0 | 132 | 0 |
| D | 0 | 132 | 0 |
| Quadrant | Total seconds | Saturated seconds | Saturation percentage |
|---|---|---|---|
| A | 6465 | 55 | 0.850735% |
| B | 6466 | 120 | 1.855861% |
| C | 6466 | 635 | 9.820600% |
| D | 6466 | 53 | 0.819672% |
Noise dominated data is calculated using 1-second bins in cleaned event files. If a bin has >2000 counts, and if more than 50% of those come from <1% of pixels, then it is considered to be noise-dominated and hence unusable.
| Quadrant | # 1 sec bins | Bins with >0 counts | Bins with >2000 counts | High rate bins dominated by noise | Noise dominated (total time) | Noise dominated (detector-on time) | Marked lightcurve |
|---|---|---|---|---|---|---|---|
| A | 7645 | 6466 | 4 | 4 | 0.05% | 0.06% | 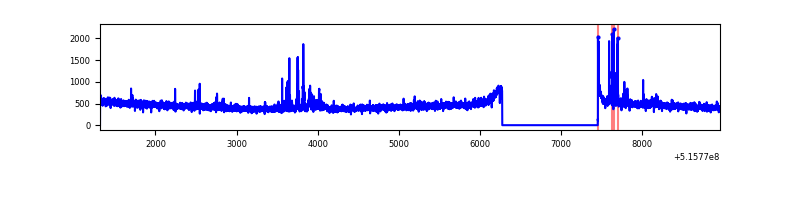 |
| B | 7646 | 6467 | 31 | 31 | 0.41% | 0.48% | 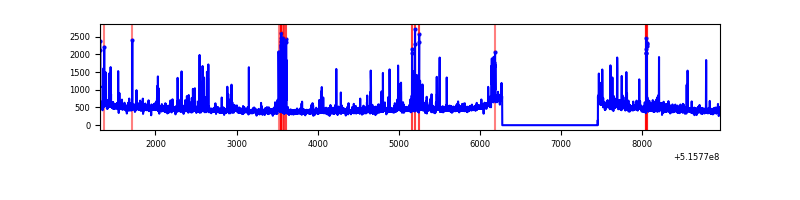 |
| C | 7645 | 6466 | 553 | 553 | 7.23% | 8.55% | 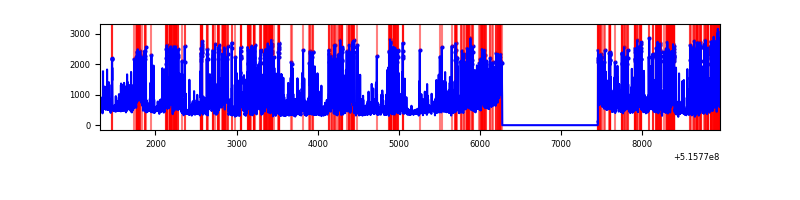 |
| D | 7645 | 6466 | 34 | 34 | 0.44% | 0.53% | 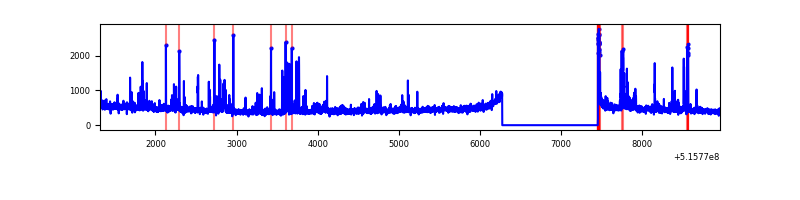 |
Top three noisy pixels from each quadrant. If the there are fewer than three noisy pixels in the level2.evt file, extra rows are filled as -1
| Pixel properties | Quadrant properties | ||||||
|---|---|---|---|---|---|---|---|
| Quadrant | DetID | PixID | Counts | Sigma | Mean | Median | Sigma |
| A | 3 | 14 | 80575 | 445.96 | 725 | 706 | 179.1 |
| A | 13 | 248 | 57043 | 314.57 | 725 | 706 | 179.1 |
| A | 13 | 254 | 9694 | 50.19 | 725 | 706 | 179.1 |
| B | 5 | 185 | 130635 | 855.26 | 708 | 681 | 151.9 |
| B | 7 | 252 | 76413 | 498.41 | 708 | 681 | 151.9 |
| B | 4 | 201 | 48757 | 316.4 | 708 | 681 | 151.9 |
| C | 15 | 224 | 2691018 | 14827.38 | 659 | 653 | 181.4 |
| C | 12 | 249 | 125596 | 688.6 | 659 | 653 | 181.4 |
| C | 14 | 254 | 115400 | 632.4 | 659 | 653 | 181.4 |
| D | 8 | 240 | 98708 | 503.12 | 691 | 659 | 194.9 |
| D | 3 | 12 | 91368 | 465.46 | 691 | 659 | 194.9 |
| D | 2 | 249 | 73930 | 375.98 | 691 | 659 | 194.9 |
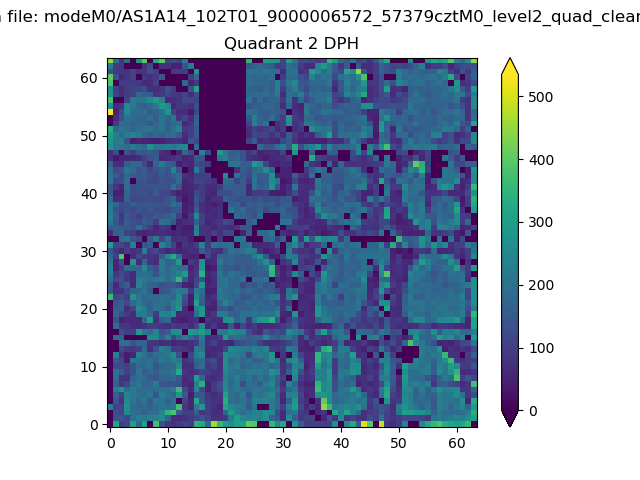
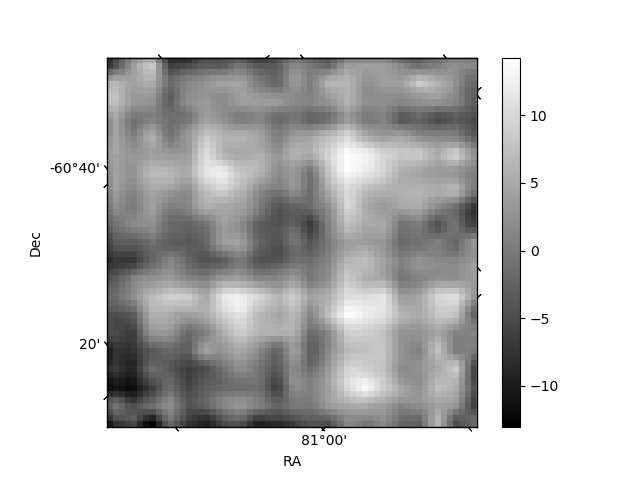
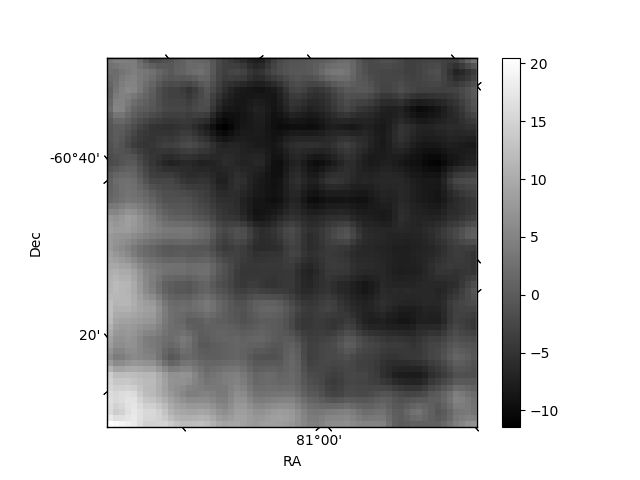
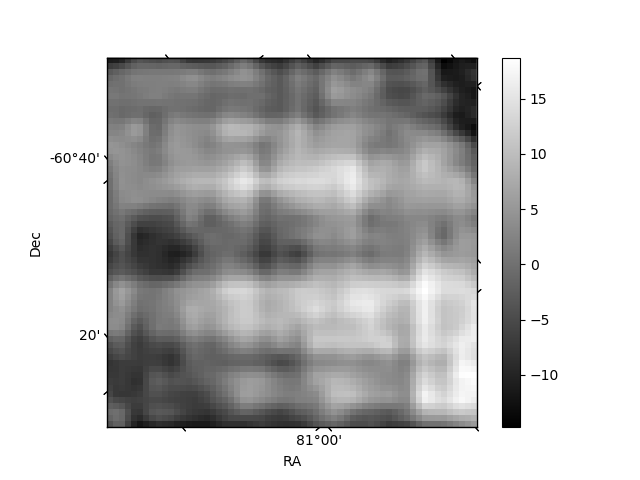
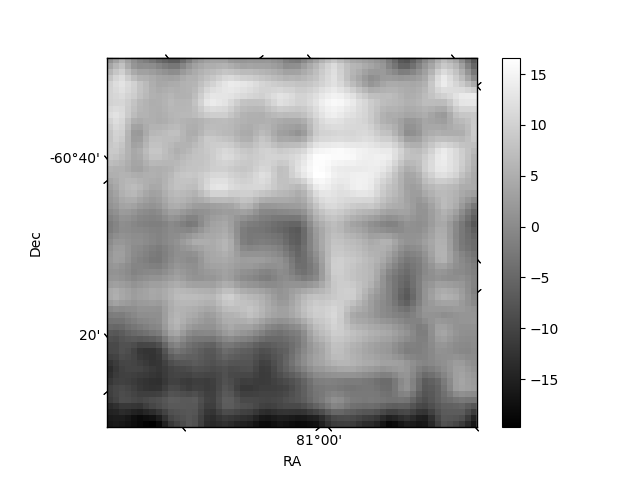
Histogram calculated using DETX and DETY for each event in the final _common_clean file
| Quadrant A | 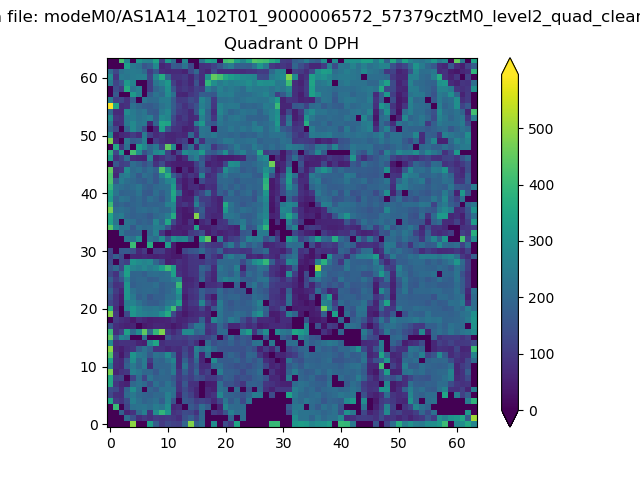 |
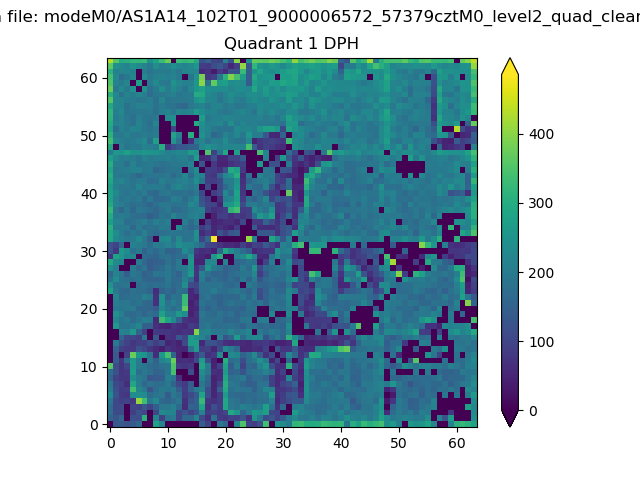 |
Quadrant B |
|---|---|---|---|
| Quadrant D | 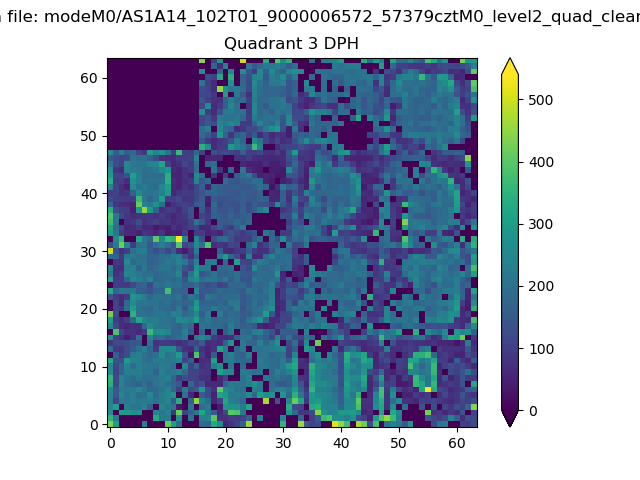 |
 |
Quadrant C |
| Plot type | Count rate plots | Images |
|---|---|---|
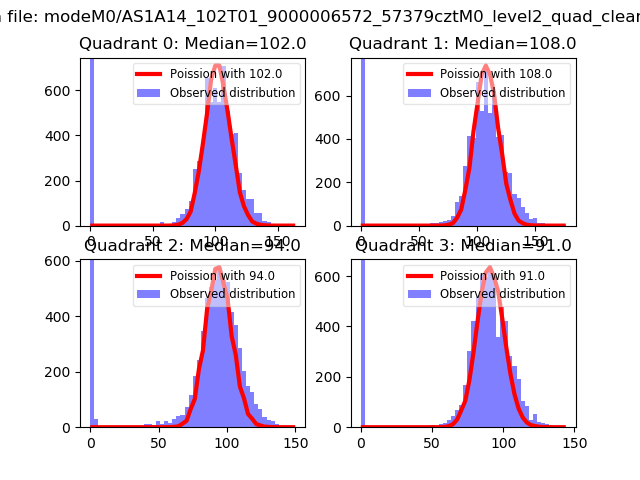
| Comparison with Poisson distribution Blue bars denote a histogram of data divided into 1 sec bins. Red curve is a Poisson curve with rate = median count rate of data. |
 |
 |
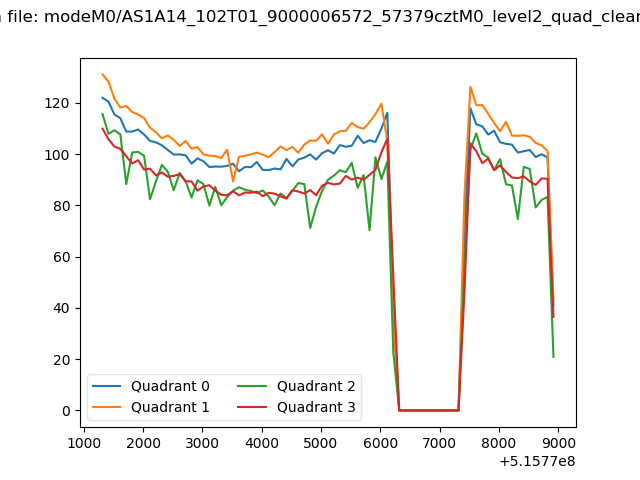
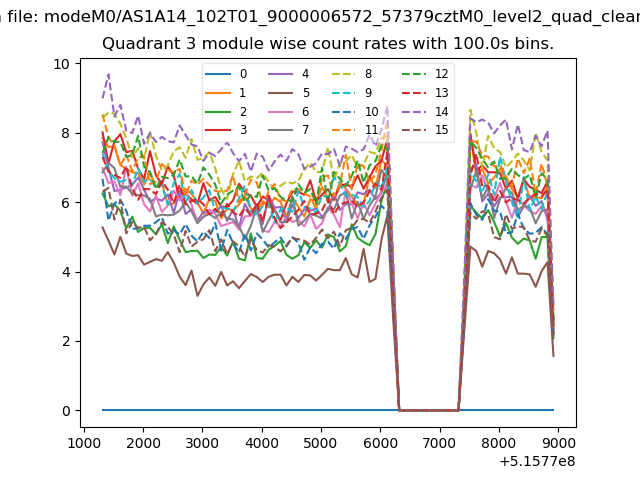
| Quadrant-wise count rates Data is divided into 100 sec bins |
 |
|
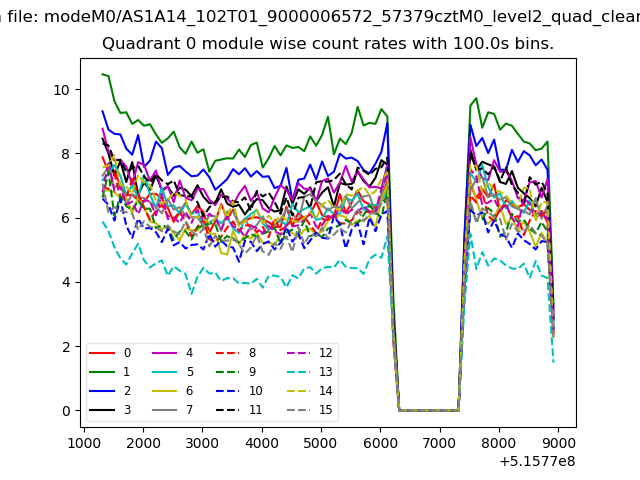
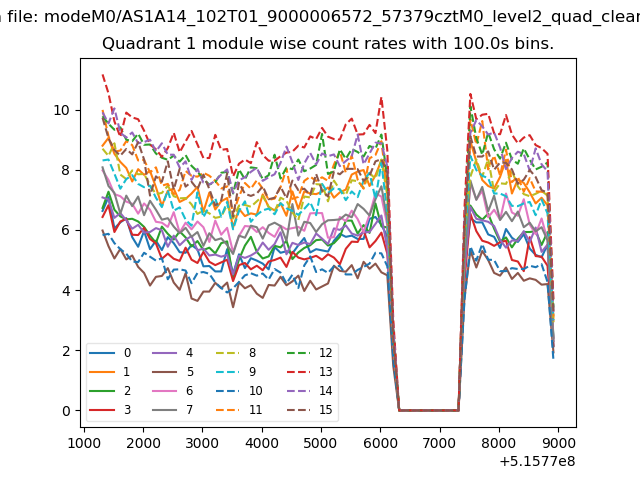
| Module-wise count rates for Quadrant A Data is divided into 100 sec bins |
 |
 |
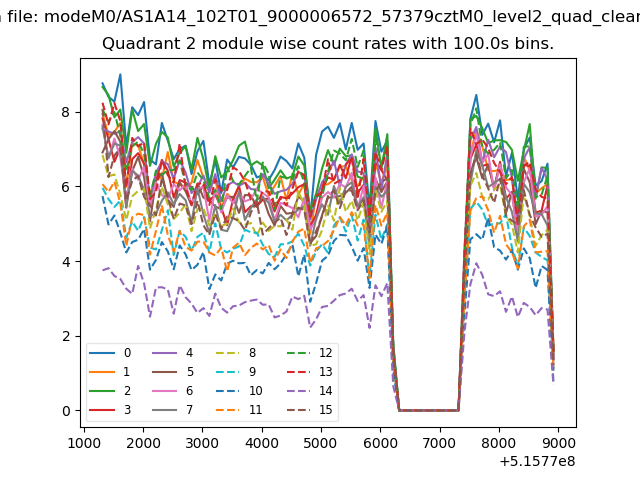
| Module-wise count rates for Quadrant B Data is divided into 100 sec bins |
 |
 |
| Module-wise count rates for Quadrant C Data is divided into 100 sec bins |
 |
 |
| Module-wise count rates for Quadrant D Data is divided into 100 sec bins |
 |
 |
| Parameter | Plot |
|---|---|
| CZT HV Monitor | 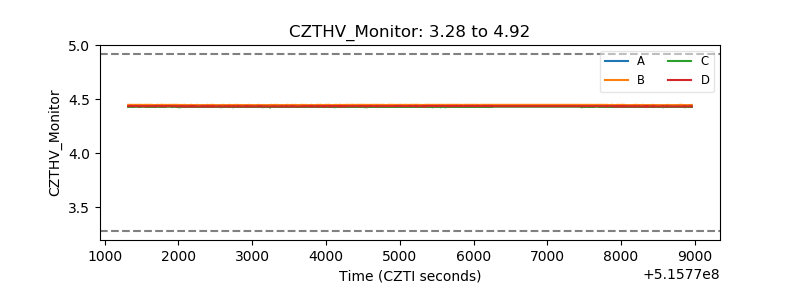 |
| D_VDD | 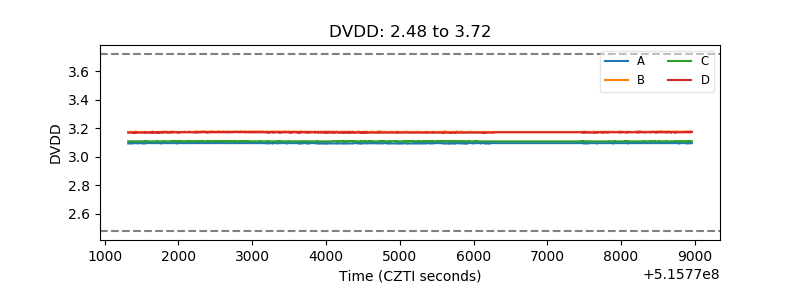 |
| Temperature 1 | 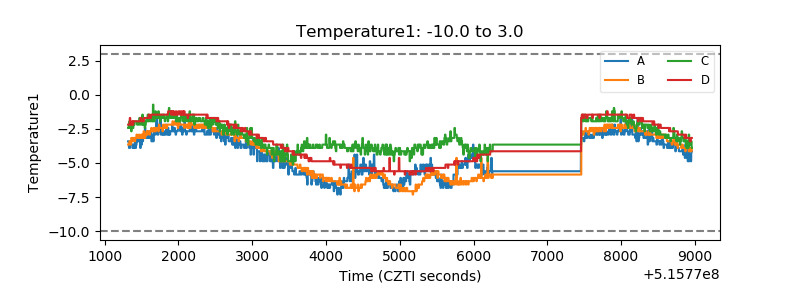 |
| Veto HV Monitor | 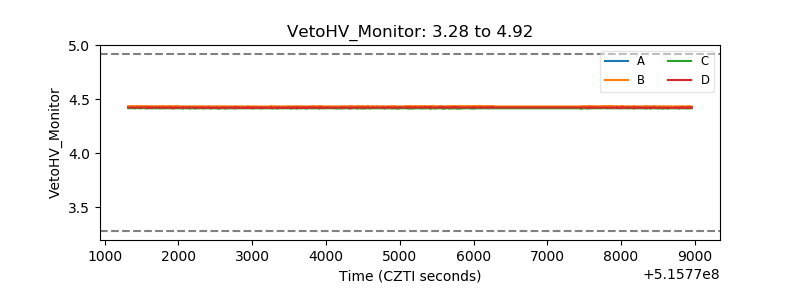 |
| Veto LLD | 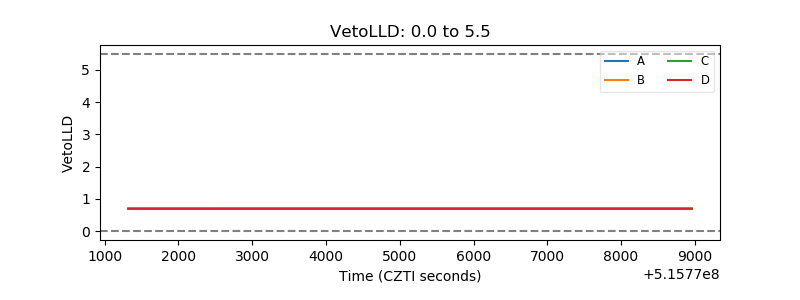 |
| Alpha Counter | 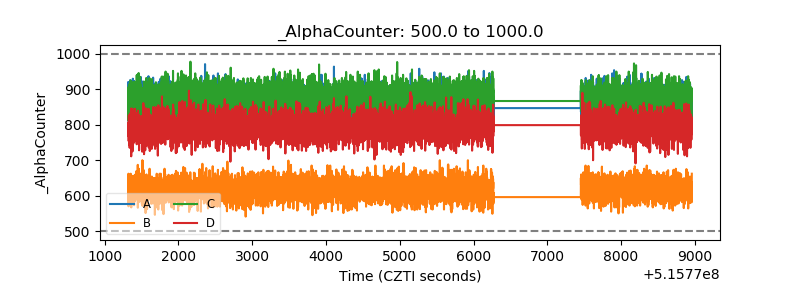 |
| _CPM_Rate | 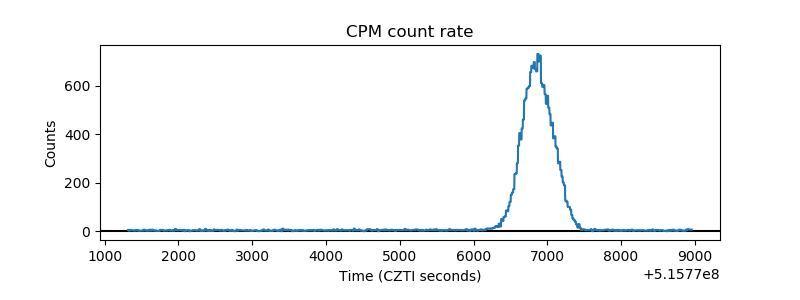 |
| CZT Counter | 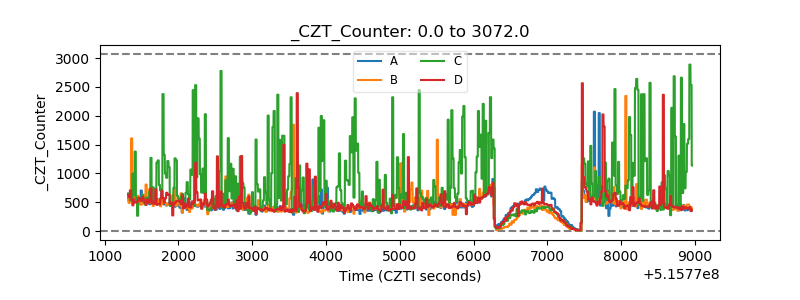 |
| +2.5 Volts monitor |  |
| +5 Volts monitor | 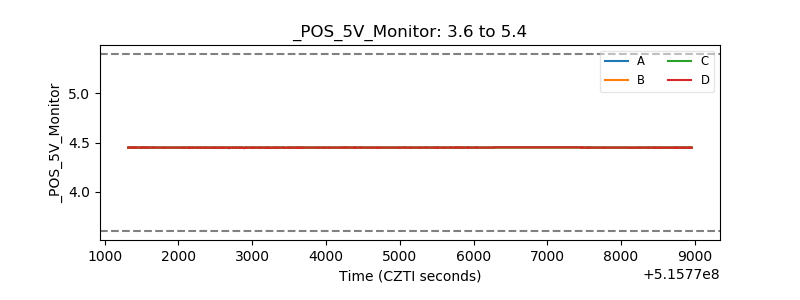 |
| _ROLL_ROT | 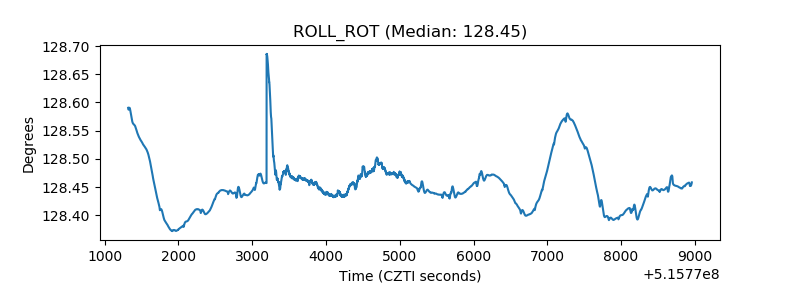 |
| _Roll_DEC | 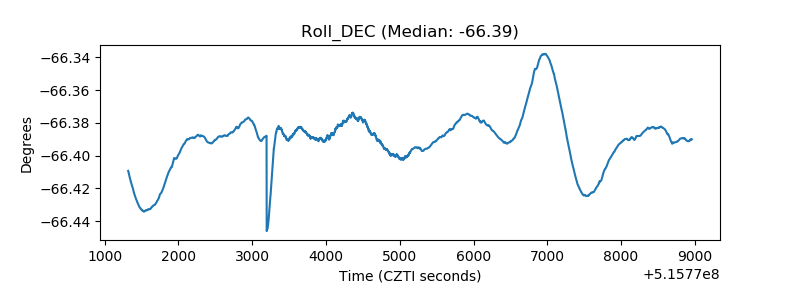 |
| _Roll_RA | 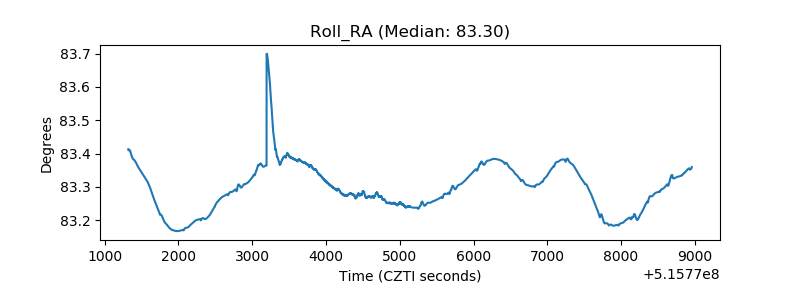 |
| Veto Counter | 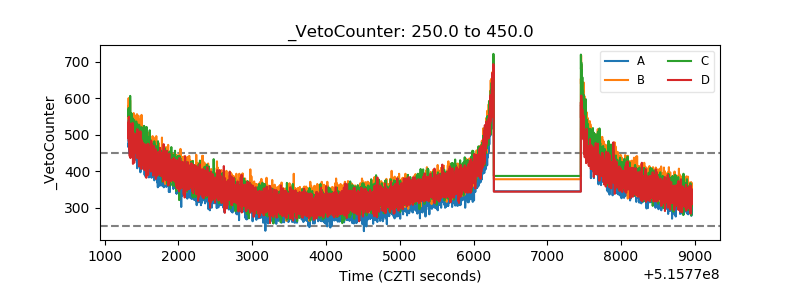 |