| Param | Original file | Final file |
|---|---|---|
| Filename | modeM0/AS1A14_102T01_9000006572_57382cztM0_level2.fits | modeM0/AS1A14_102T01_9000006572_57382cztM0_level2_quad_clean.evt |
| Size (bytes) | 448,977,600 | 87,842,880 |
| Size | 428.2 MB | 83.8 MB |
| Events in quadrant A | 3,152,754 | 569,633 |
| Events in quadrant B | 3,383,578 | 603,323 |
| Events in quadrant C | 6,216,318 | 507,601 |
| Events in quadrant D | 3,331,553 | 499,307 |
| Mode M0 | |||
|---|---|---|---|
| Quadrant | BADHDUFLAG | Total packets | Discarded packets |
| A | 0 | 14621 | 1 |
| B | 0 | 14901 | 1 |
| C | 0 | 23318 | 1 |
| D | 0 | 15122 | 1 |
| Mode M9 | |||
|---|---|---|---|
| Quadrant | BADHDUFLAG | Total packets | Discarded packets |
| A | 0 | 6 | 0 |
| B | 0 | 6 | 0 |
| C | 0 | 6 | 0 |
| D | 0 | 6 | 0 |
| Mode SS | |||
|---|---|---|---|
| Quadrant | BADHDUFLAG | Total packets | Discarded packets |
| A | 0 | 138 | 0 |
| B | 0 | 138 | 0 |
| C | 0 | 138 | 0 |
| D | 0 | 138 | 0 |
| Quadrant | Total seconds | Saturated seconds | Saturation percentage |
|---|---|---|---|
| A | 6887 | 23 | 0.333963% |
| B | 6888 | 65 | 0.943670% |
| C | 6888 | 631 | 9.160859% |
| D | 6888 | 59 | 0.856562% |
Noise dominated data is calculated using 1-second bins in cleaned event files. If a bin has >2000 counts, and if more than 50% of those come from <1% of pixels, then it is considered to be noise-dominated and hence unusable.
| Quadrant | # 1 sec bins | Bins with >0 counts | Bins with >2000 counts | High rate bins dominated by noise | Noise dominated (total time) | Noise dominated (detector-on time) | Marked lightcurve |
|---|---|---|---|---|---|---|---|
| A | 7758 | 7160 | 6 | 6 | 0.08% | 0.08% | 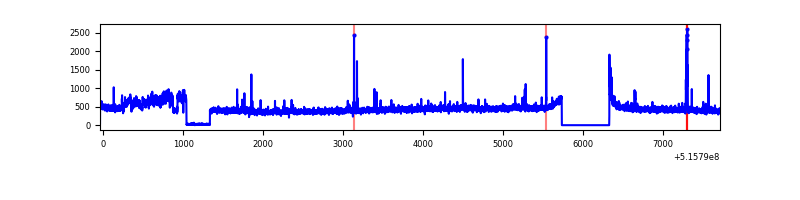 |
| B | 7759 | 7161 | 19 | 19 | 0.24% | 0.27% | 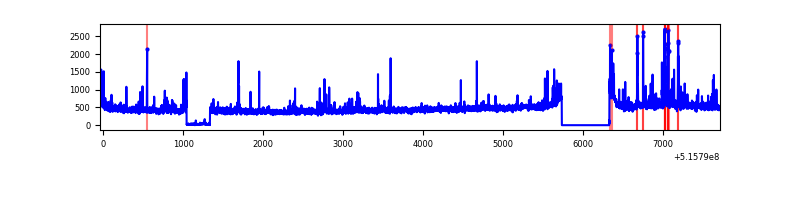 |
| C | 7759 | 7161 | 603 | 603 | 7.77% | 8.42% | 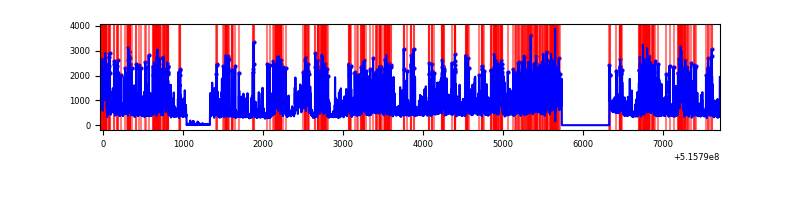 |
| D | 7759 | 7161 | 46 | 46 | 0.59% | 0.64% | 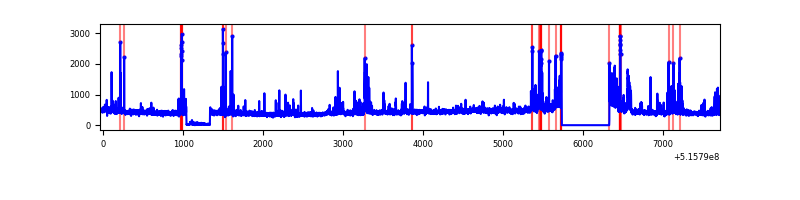 |
Top three noisy pixels from each quadrant. If the there are fewer than three noisy pixels in the level2.evt file, extra rows are filled as -1
| Pixel properties | Quadrant properties | ||||||
|---|---|---|---|---|---|---|---|
| Quadrant | DetID | PixID | Counts | Sigma | Mean | Median | Sigma |
| A | 10 | 248 | 180905 | 993.55 | 734 | 716 | 181.4 |
| A | 3 | 14 | 57644 | 313.9 | 734 | 716 | 181.4 |
| A | 0 | 8 | 26465 | 141.98 | 734 | 716 | 181.4 |
| B | 0 | 216 | 188386 | 1222.05 | 724 | 697 | 153.6 |
| B | 7 | 252 | 92870 | 600.14 | 724 | 697 | 153.6 |
| B | 5 | 185 | 58271 | 374.87 | 724 | 697 | 153.6 |
| C | 15 | 224 | 2865710 | 15426.49 | 680 | 673 | 185.7 |
| C | 14 | 254 | 480571 | 2583.96 | 680 | 673 | 185.7 |
| C | 12 | 250 | 75187 | 401.21 | 680 | 673 | 185.7 |
| D | 2 | 249 | 130382 | 659.6 | 699 | 669 | 196.7 |
| D | 2 | 31 | 102351 | 517.06 | 699 | 669 | 196.7 |
| D | 3 | 12 | 83807 | 422.76 | 699 | 669 | 196.7 |
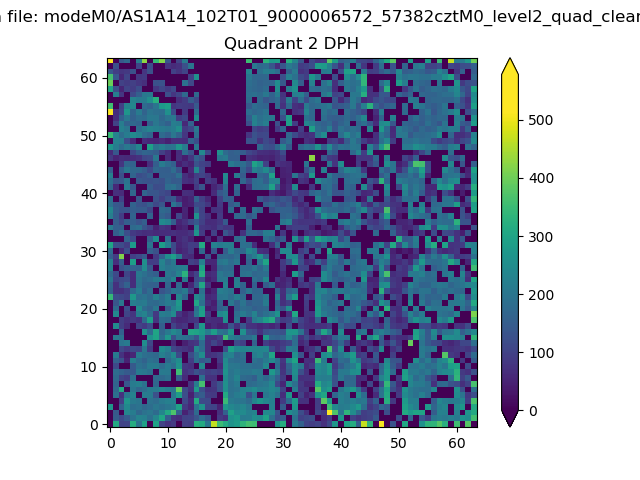
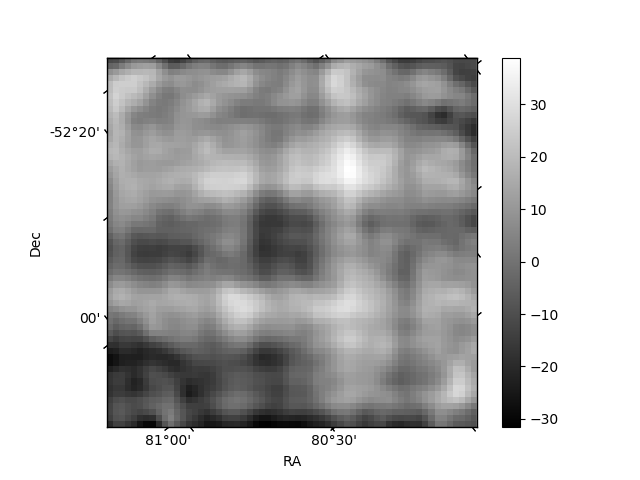
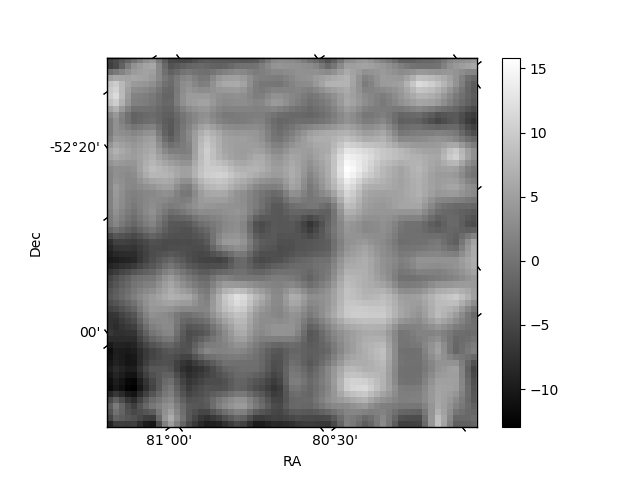
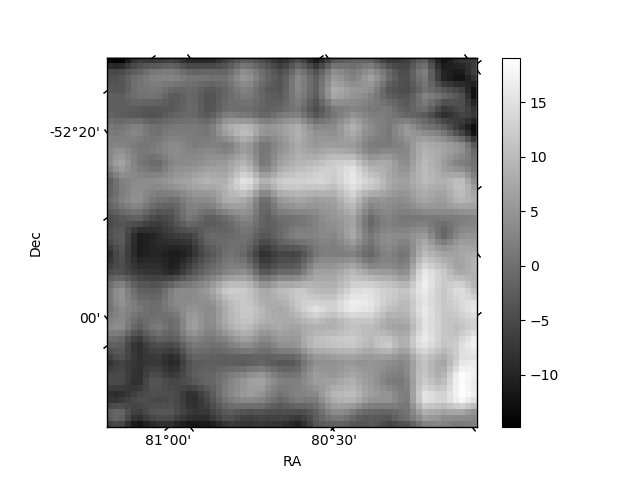
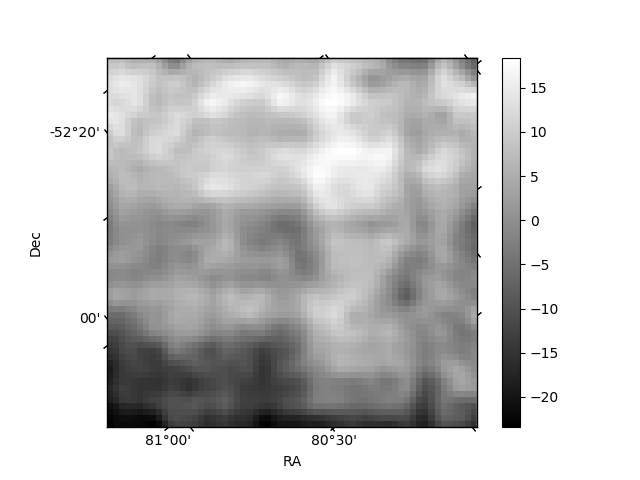
Histogram calculated using DETX and DETY for each event in the final _common_clean file
| Quadrant A | 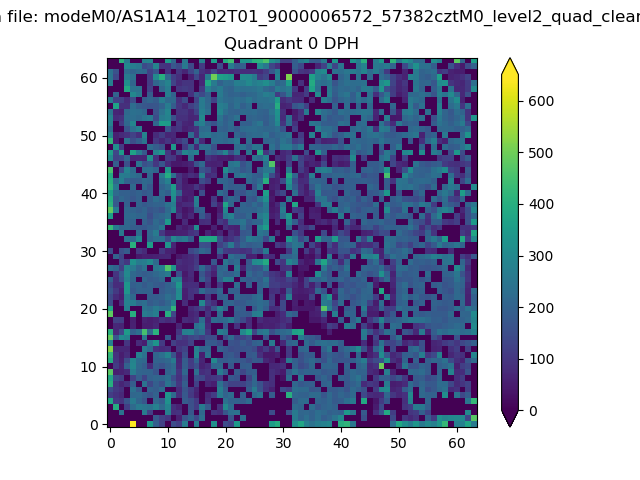 |
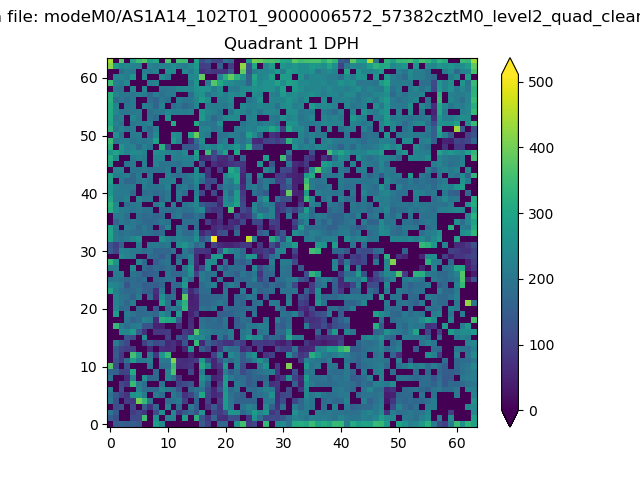 |
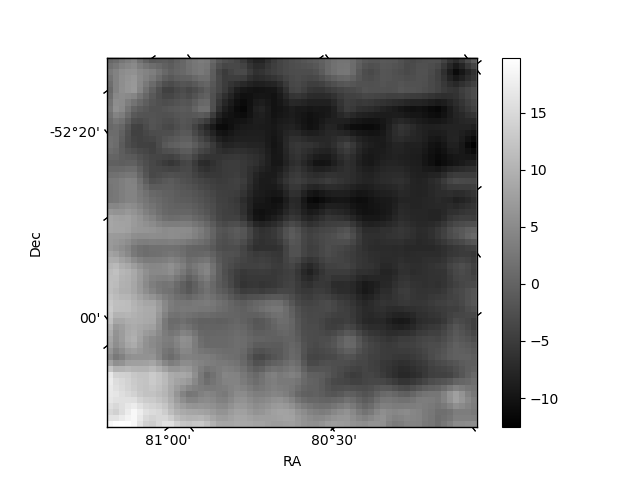
Quadrant B |
|---|---|---|---|
| Quadrant D | 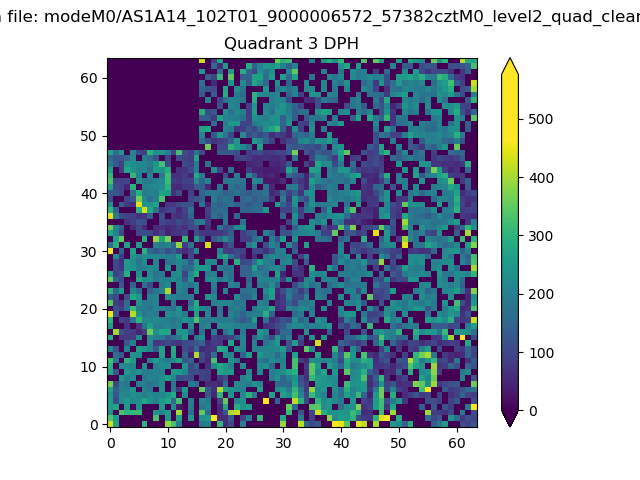 |
 |
Quadrant C |
| Plot type | Count rate plots | Images |
|---|---|---|
| Comparison with Poisson distribution Blue bars denote a histogram of data divided into 1 sec bins. Red curve is a Poisson curve with rate = median count rate of data. |
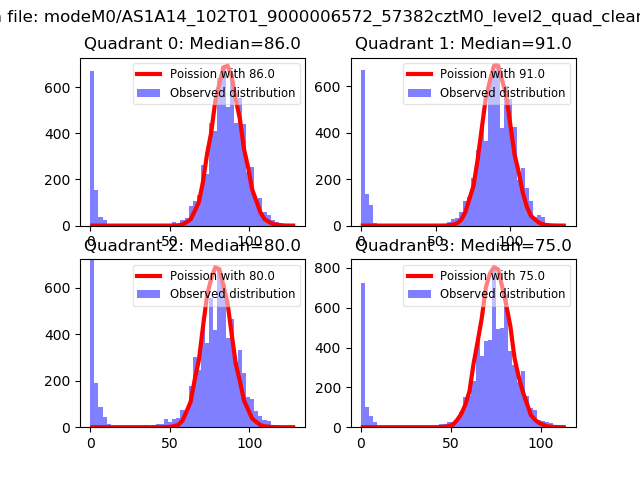 |
 |
| Quadrant-wise count rates Data is divided into 100 sec bins |
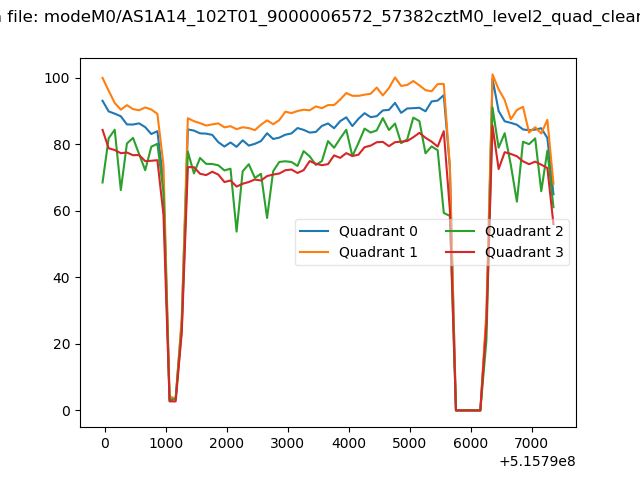 |
|
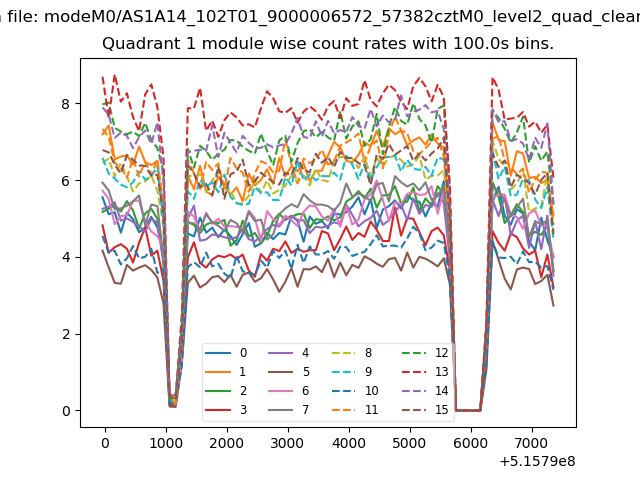
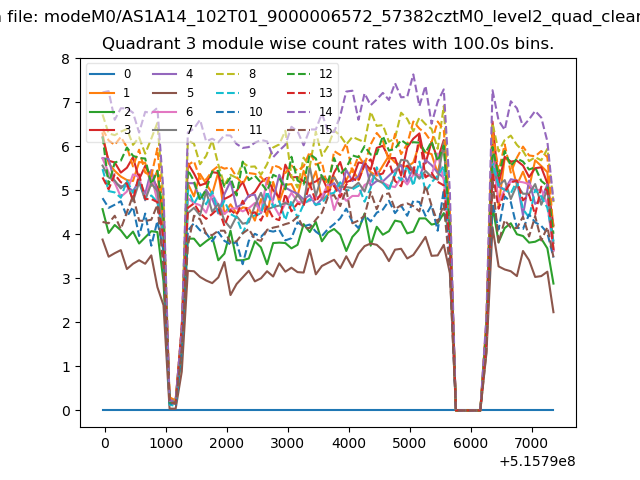
| Module-wise count rates for Quadrant A Data is divided into 100 sec bins |
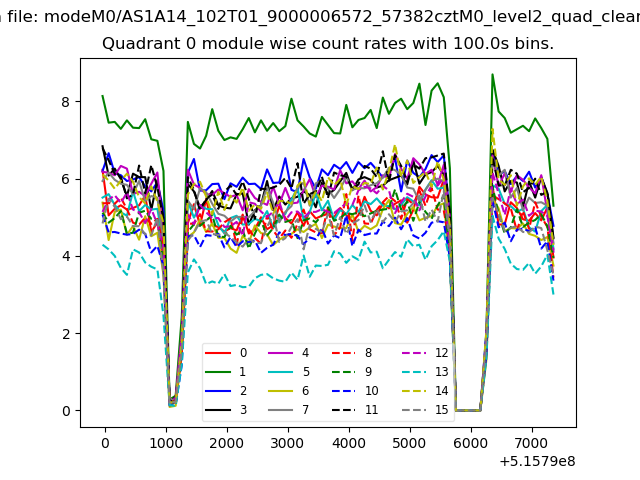 |
 |
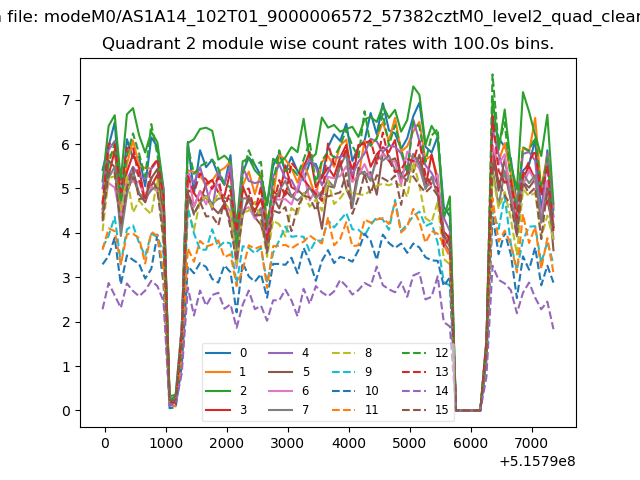
| Module-wise count rates for Quadrant B Data is divided into 100 sec bins |
 |
 |
| Module-wise count rates for Quadrant C Data is divided into 100 sec bins |
 |
 |
| Module-wise count rates for Quadrant D Data is divided into 100 sec bins |
 |
 |
| Parameter | Plot |
|---|---|
| CZT HV Monitor |  |
| D_VDD | 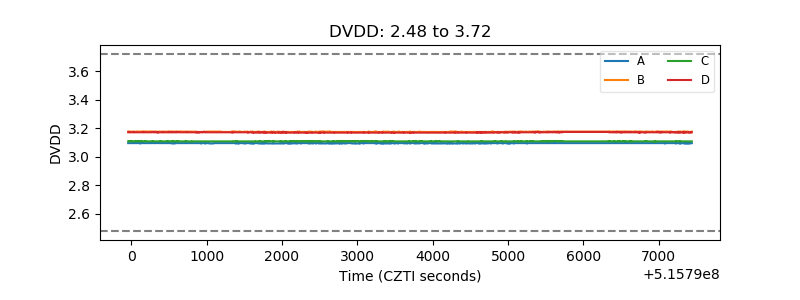 |
| Temperature 1 | 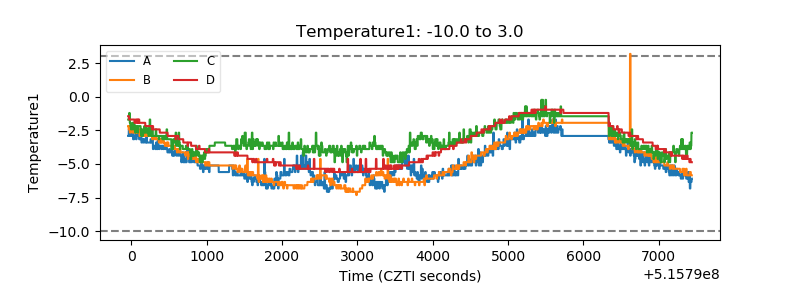 |
| Veto HV Monitor | 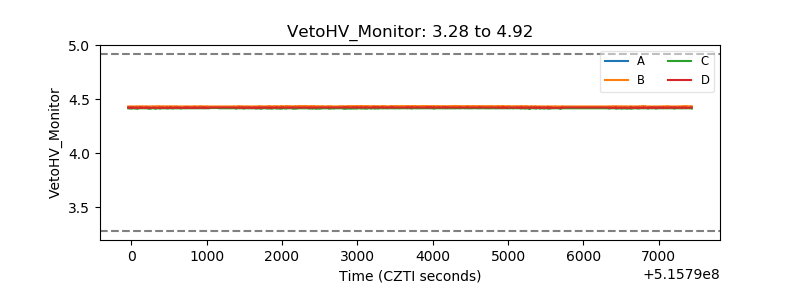 |
| Veto LLD | 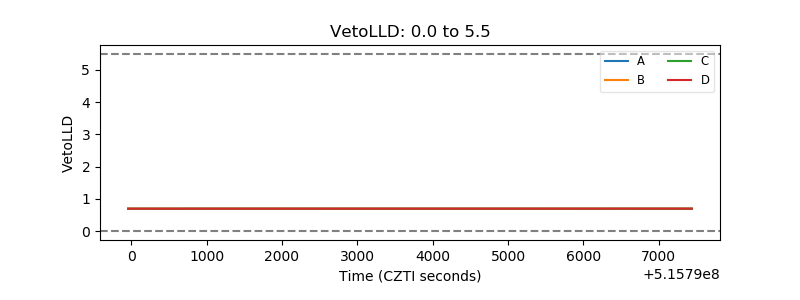 |
| Alpha Counter | 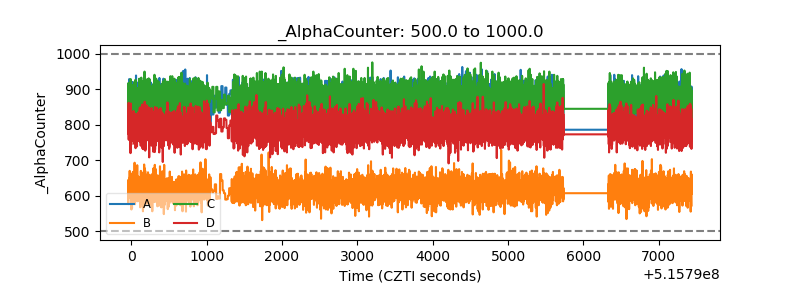 |
| _CPM_Rate | 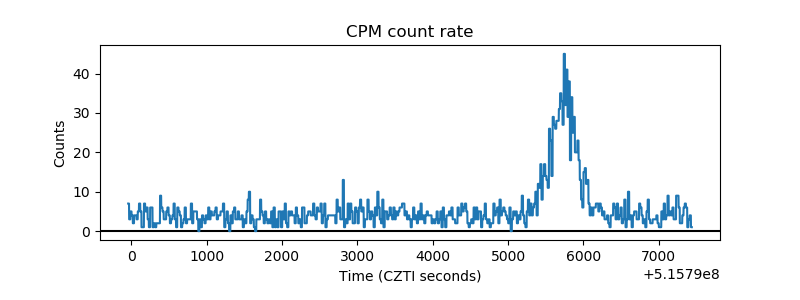 |
| CZT Counter | 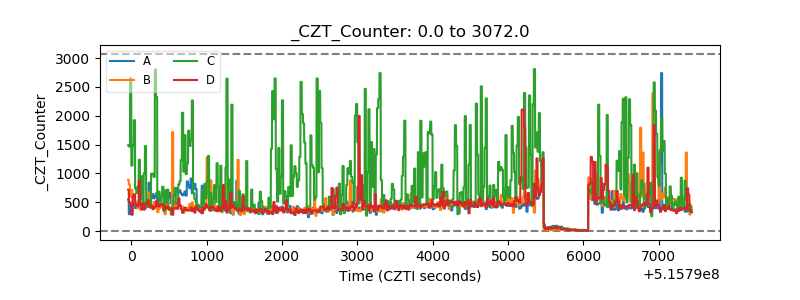 |
| +2.5 Volts monitor | 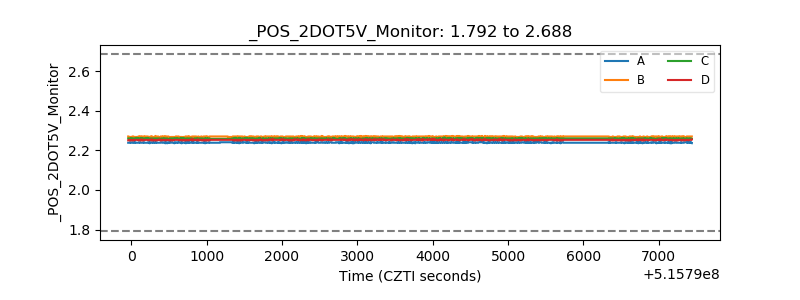 |
| +5 Volts monitor |  |
| _ROLL_ROT | 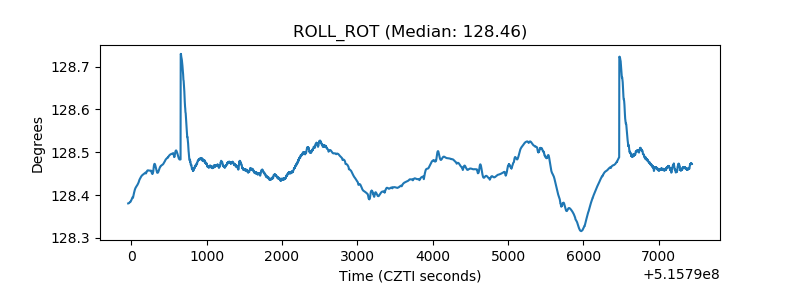 |
| _Roll_DEC | 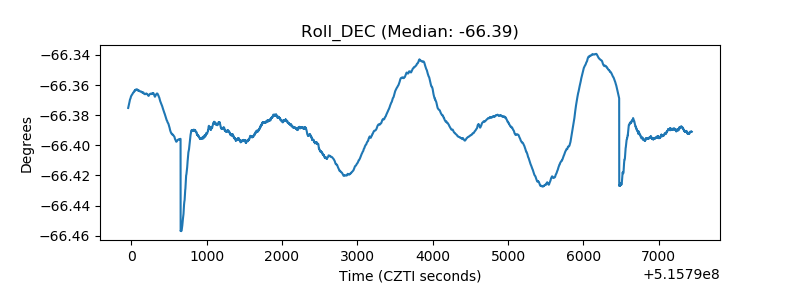 |
| _Roll_RA | 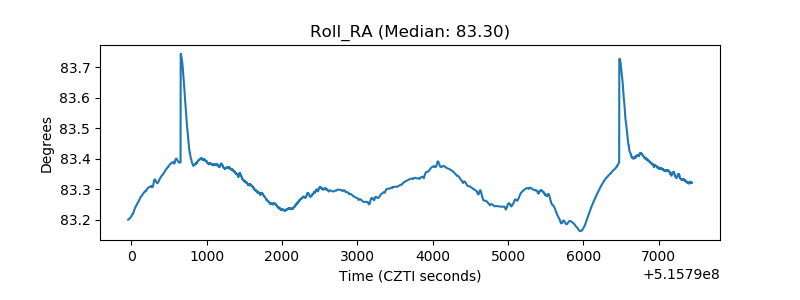 |
| Veto Counter | 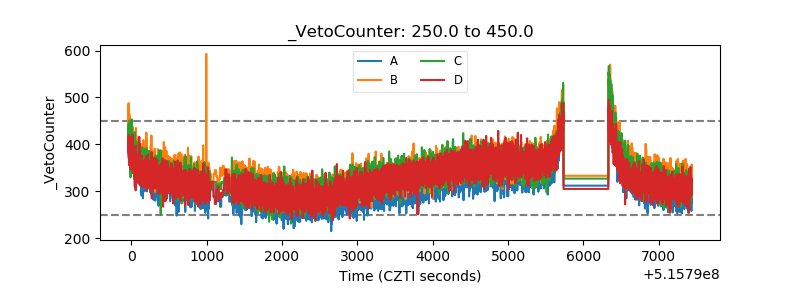 |