| Param | Original file | Final file |
|---|---|---|
| Filename | modeM0/AS1A14_102T01_9000006572_57383cztM0_level2.fits | modeM0/AS1A14_102T01_9000006572_57383cztM0_level2_quad_clean.evt |
| Size (bytes) | 1,565,173,440 | 323,671,680 |
| Size | 1.5 GB | 308.7 MB |
| Events in quadrant A | 10,663,598 | 2,173,818 |
| Events in quadrant B | 10,855,694 | 2,318,276 |
| Events in quadrant C | 20,696,053 | 1,894,143 |
| Events in quadrant D | 13,957,352 | 1,843,860 |
| Mode M0 | |||
|---|---|---|---|
| Quadrant | BADHDUFLAG | Total packets | Discarded packets |
| A | 0 | 49117 | 4 |
| B | 0 | 48877 | 3 |
| C | 0 | 77708 | 3 |
| D | 0 | 58293 | 3 |
| Mode M9 | |||
|---|---|---|---|
| Quadrant | BADHDUFLAG | Total packets | Discarded packets |
| A | 0 | 27 | 0 |
| B | 0 | 27 | 0 |
| C | 0 | 27 | 0 |
| D | 0 | 27 | 0 |
| Mode SS | |||
|---|---|---|---|
| Quadrant | BADHDUFLAG | Total packets | Discarded packets |
| A | 0 | 462 | 0 |
| B | 0 | 462 | 0 |
| C | 0 | 462 | 0 |
| D | 0 | 462 | 0 |
| Quadrant | Total seconds | Saturated seconds | Saturation percentage |
|---|---|---|---|
| A | 22807 | 134 | 0.587539% |
| B | 22808 | 271 | 1.188180% |
| C | 22808 | 2327 | 10.202561% |
| D | 22808 | 1290 | 5.655910% |
Noise dominated data is calculated using 1-second bins in cleaned event files. If a bin has >2000 counts, and if more than 50% of those come from <1% of pixels, then it is considered to be noise-dominated and hence unusable.
| Quadrant | # 1 sec bins | Bins with >0 counts | Bins with >2000 counts | High rate bins dominated by noise | Noise dominated (total time) | Noise dominated (detector-on time) | Marked lightcurve |
|---|---|---|---|---|---|---|---|
| A | 25740 | 23089 | 8 | 8 | 0.03% | 0.03% | 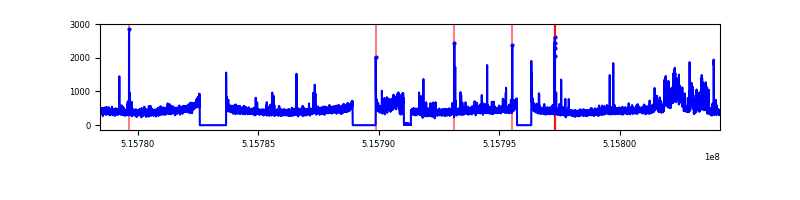 |
| B | 25741 | 23090 | 71 | 71 | 0.28% | 0.31% | 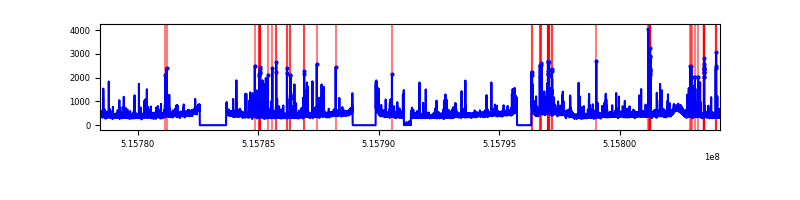 |
| C | 25741 | 23090 | 2075 | 2075 | 8.06% | 8.99% | 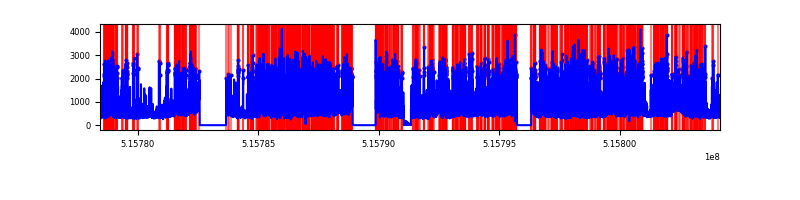 |
| D | 25741 | 23090 | 1249 | 1249 | 4.85% | 5.41% | 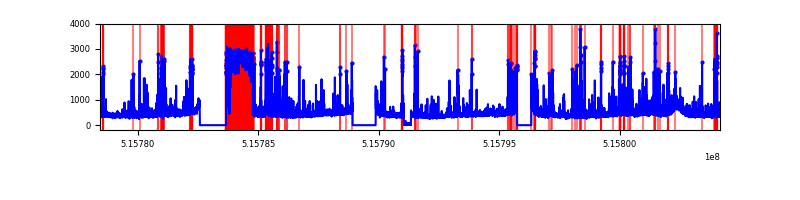 |
Top three noisy pixels from each quadrant. If the there are fewer than three noisy pixels in the level2.evt file, extra rows are filled as -1
| Pixel properties | Quadrant properties | ||||||
|---|---|---|---|---|---|---|---|
| Quadrant | DetID | PixID | Counts | Sigma | Mean | Median | Sigma |
| A | 0 | 12 | 712556 | 1177.82 | 2461 | 2407 | 602.9 |
| A | 10 | 248 | 198788 | 325.71 | 2461 | 2407 | 602.9 |
| A | 3 | 14 | 149293 | 243.62 | 2461 | 2407 | 602.9 |
| B | 0 | 216 | 228737 | 441.77 | 2428 | 2336 | 512.5 |
| B | 5 | 185 | 203213 | 391.97 | 2428 | 2336 | 512.5 |
| B | 4 | 201 | 193156 | 372.35 | 2428 | 2336 | 512.5 |
| C | 15 | 224 | 8990139 | 14633.96 | 2270 | 2250 | 614.2 |
| C | 8 | 7 | 853286 | 1385.65 | 2270 | 2250 | 614.2 |
| C | 14 | 254 | 821967 | 1334.65 | 2270 | 2250 | 614.2 |
| D | 15 | 93 | 2693996 | 4146.27 | 2296 | 2187 | 649.2 |
| D | 8 | 240 | 516949 | 792.9 | 2296 | 2187 | 649.2 |
| D | 3 | 12 | 398292 | 610.13 | 2296 | 2187 | 649.2 |
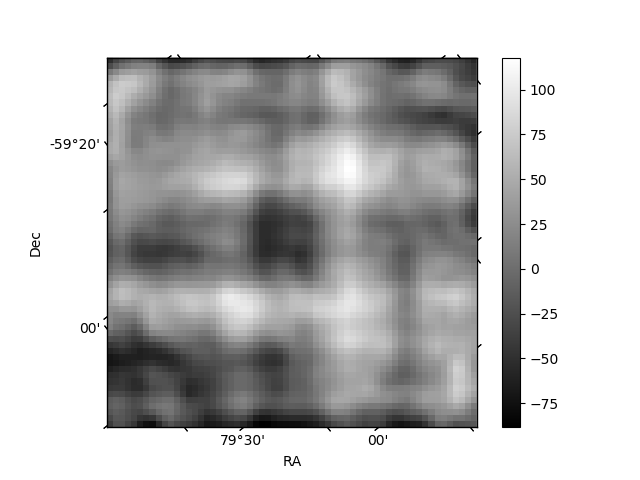
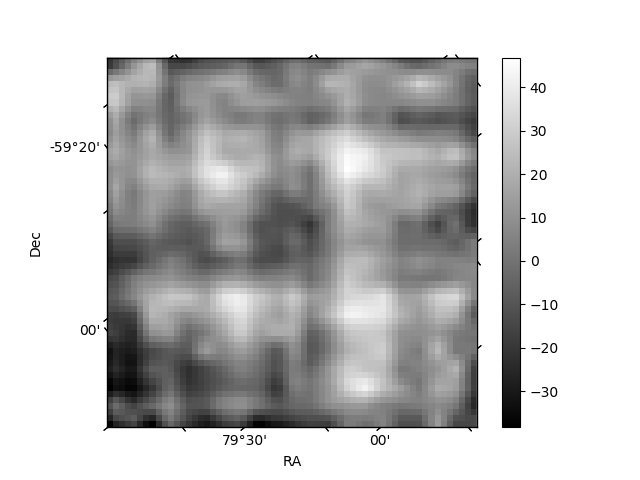
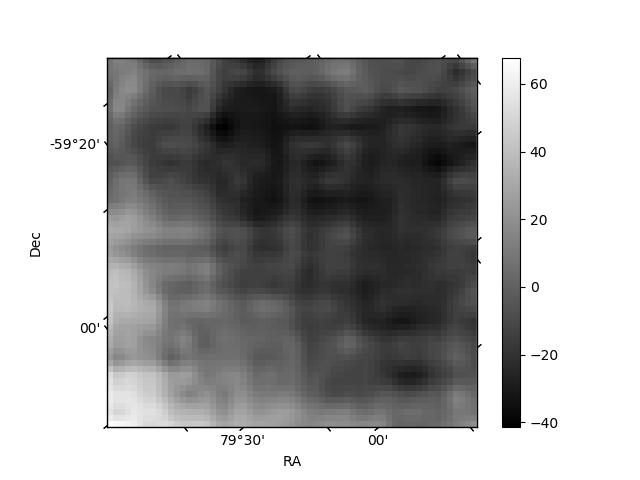
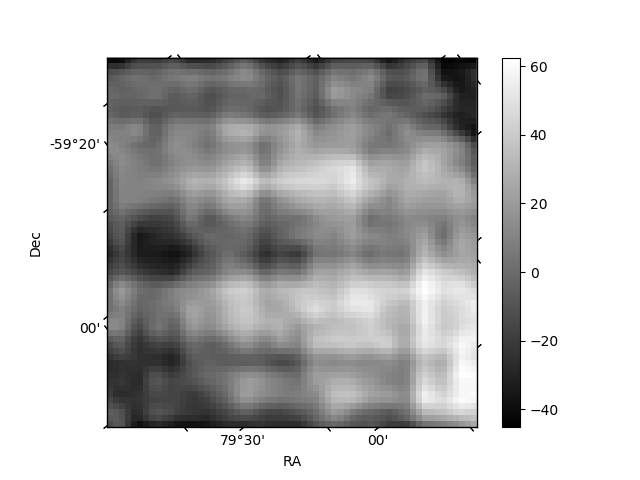
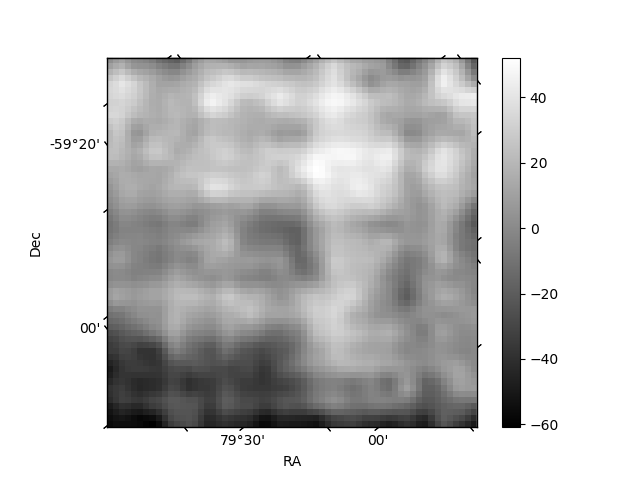
Histogram calculated using DETX and DETY for each event in the final _common_clean file
| Quadrant A | 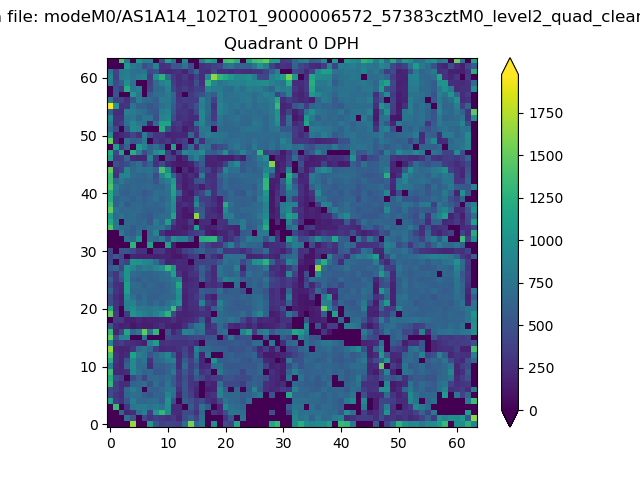 |
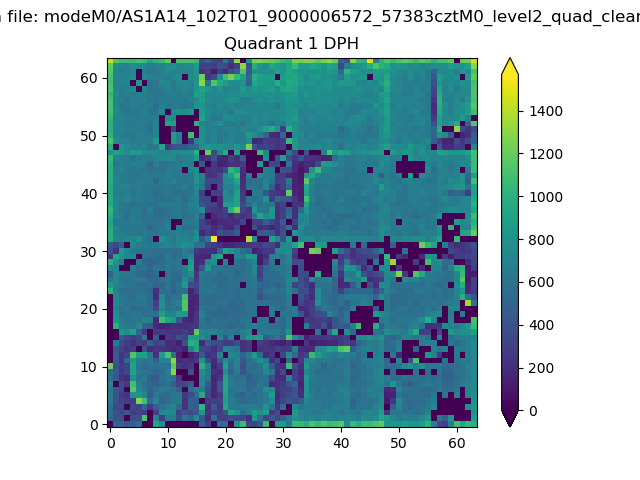 |
Quadrant B |
|---|---|---|---|
| Quadrant D | 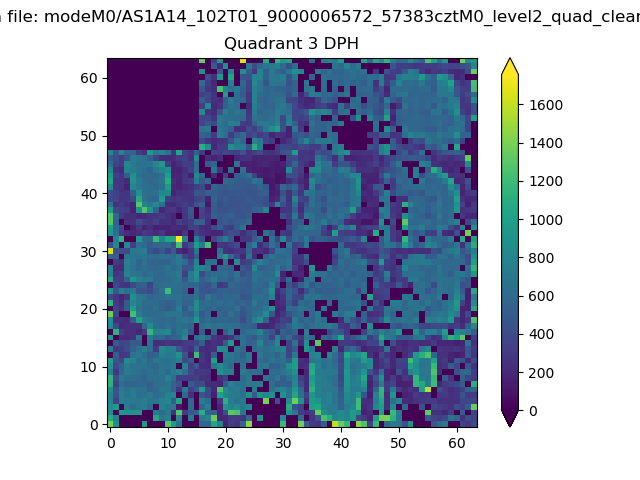 |
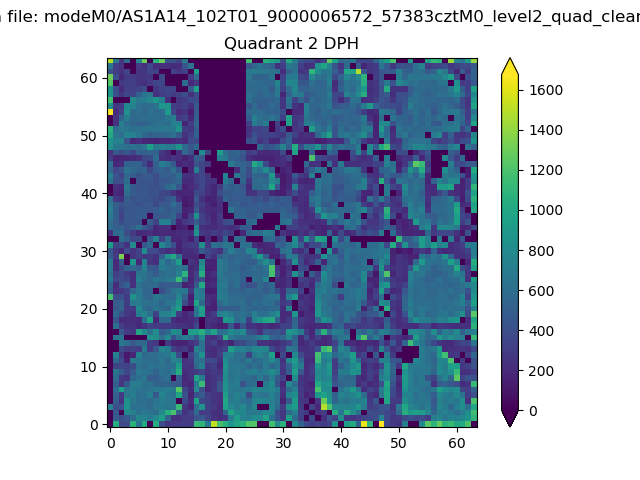 |
Quadrant C |
| Plot type | Count rate plots | Images |
|---|---|---|
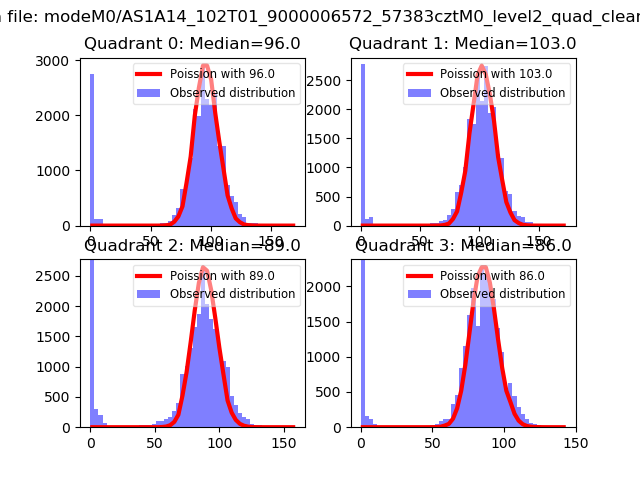
| Comparison with Poisson distribution Blue bars denote a histogram of data divided into 1 sec bins. Red curve is a Poisson curve with rate = median count rate of data. |
 |
 |
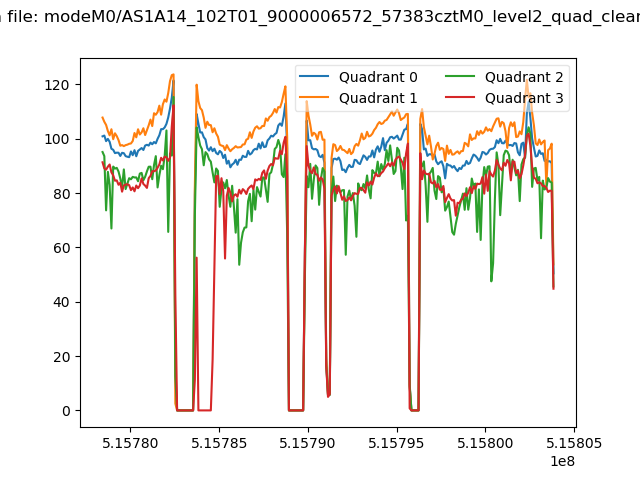
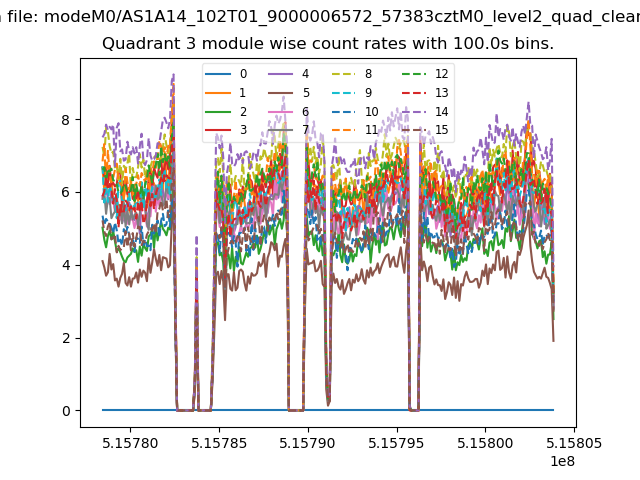
| Quadrant-wise count rates Data is divided into 100 sec bins |
 |
|
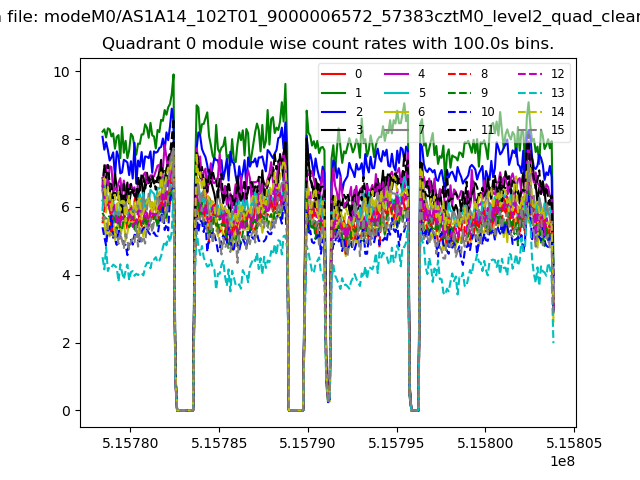
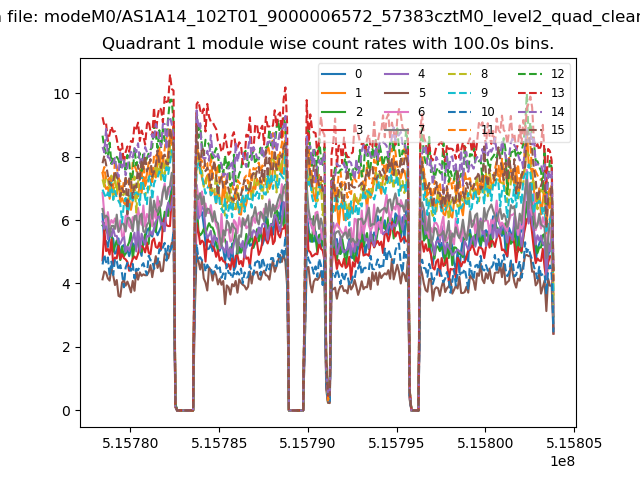
| Module-wise count rates for Quadrant A Data is divided into 100 sec bins |
 |
 |
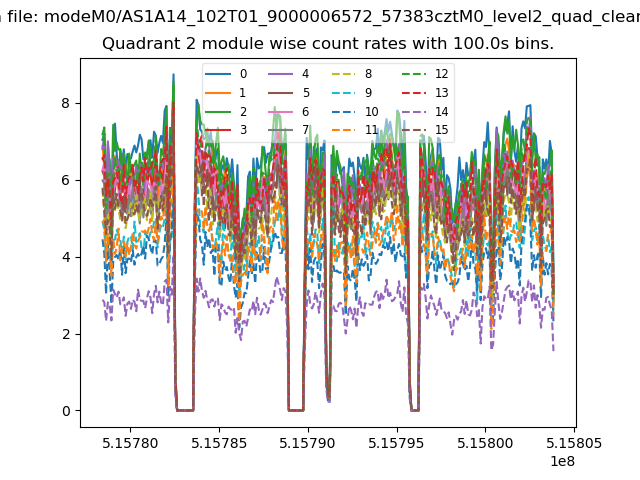
| Module-wise count rates for Quadrant B Data is divided into 100 sec bins |
 |
 |
| Module-wise count rates for Quadrant C Data is divided into 100 sec bins |
 |
 |
| Module-wise count rates for Quadrant D Data is divided into 100 sec bins |
 |
 |
| Parameter | Plot |
|---|---|
| CZT HV Monitor |  |
| D_VDD | 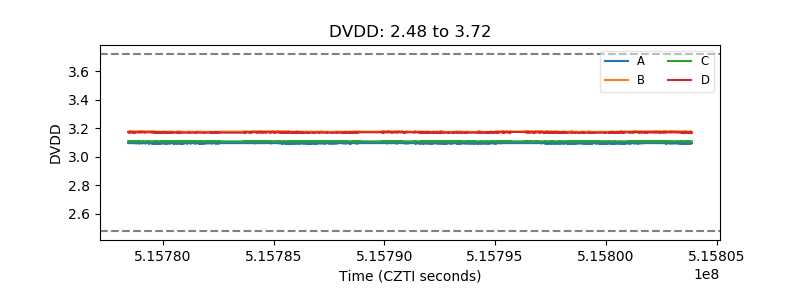 |
| Temperature 1 | 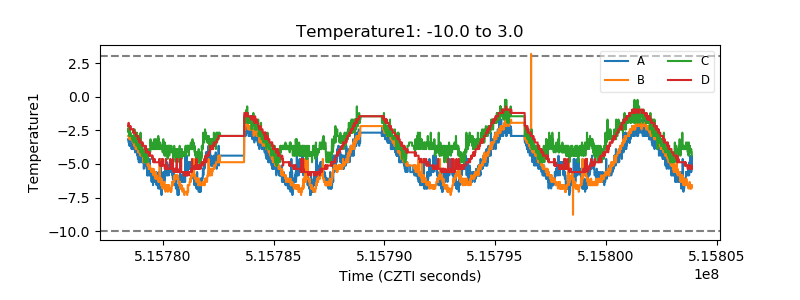 |
| Veto HV Monitor | 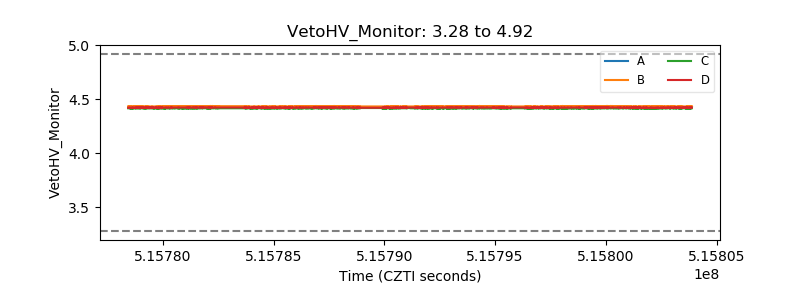 |
| Veto LLD | 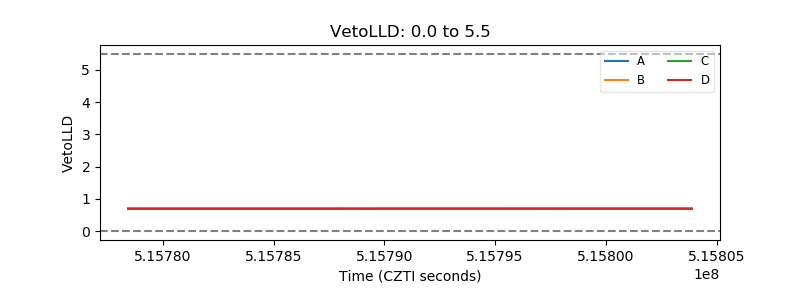 |
| Alpha Counter | 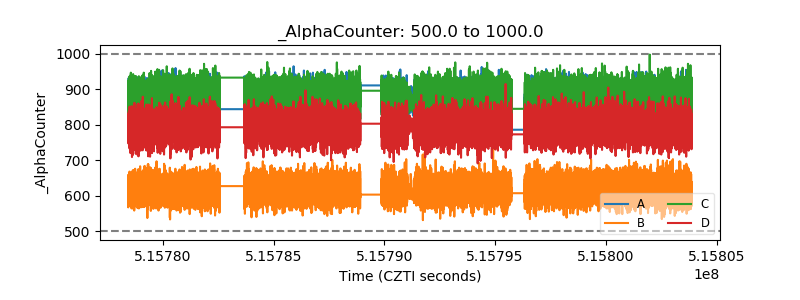 |
| _CPM_Rate | 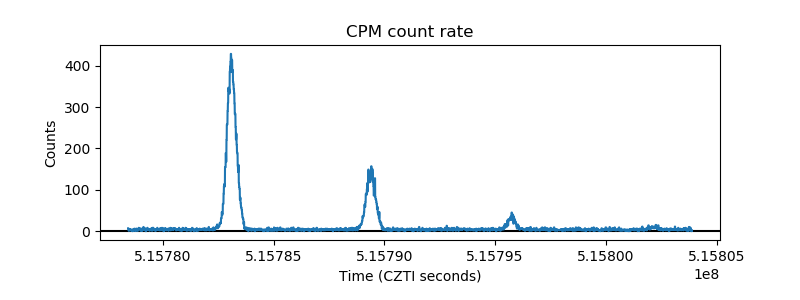 |
| CZT Counter | 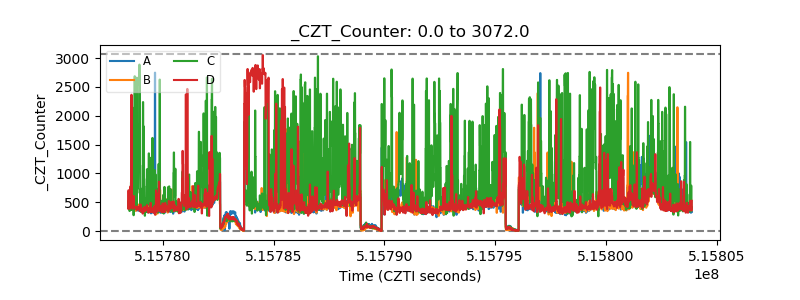 |
| +2.5 Volts monitor |  |
| +5 Volts monitor |  |
| _ROLL_ROT | 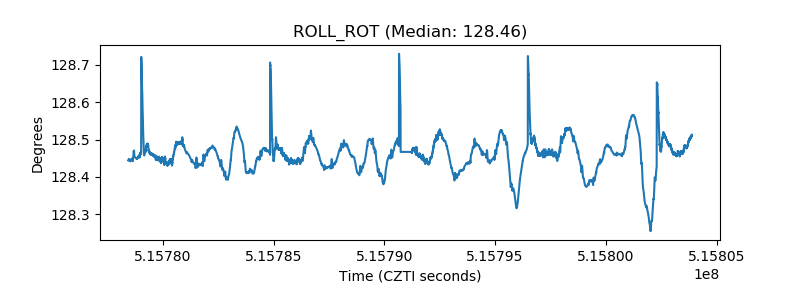 |
| _Roll_DEC | 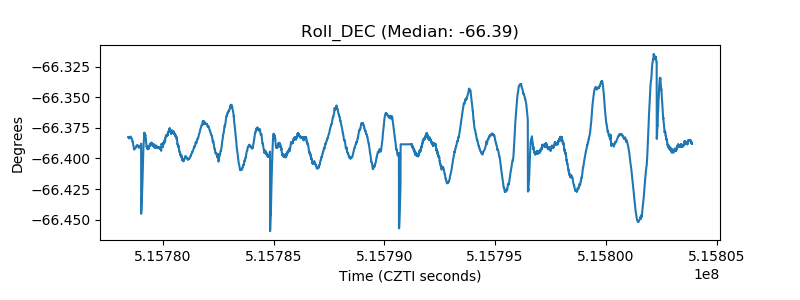 |
| _Roll_RA | 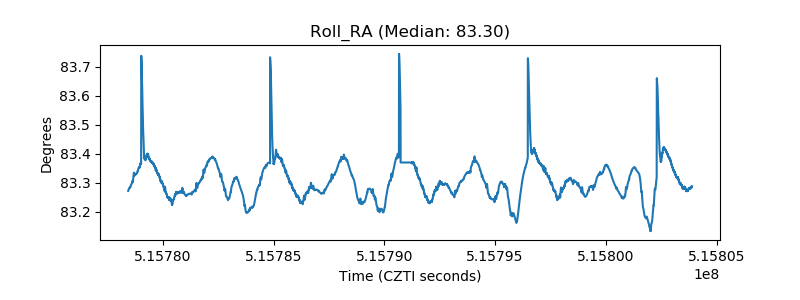 |
| Veto Counter | 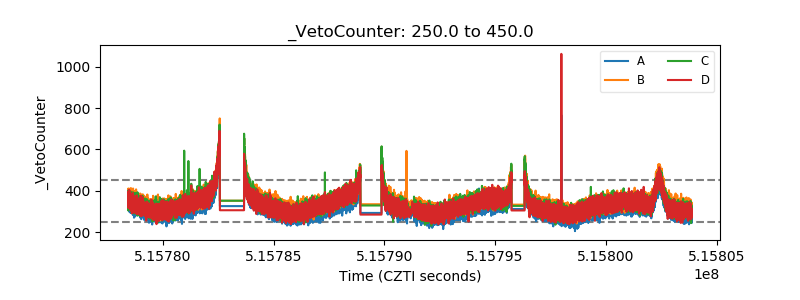 |