| Param | Original file | Final file |
|---|---|---|
| Filename | modeM0/AS1A14_102T01_9000006572_57387cztM0_level2.fits | modeM0/AS1A14_102T01_9000006572_57387cztM0_level2_quad_clean.evt |
| Size (bytes) | 1,339,142,400 | 197,553,600 |
| Size | 1.2 GB | 188.4 MB |
| Events in quadrant A | 8,071,585 | 1,344,005 |
| Events in quadrant B | 8,129,528 | 1,321,007 |
| Events in quadrant C | 20,180,646 | 1,043,087 |
| Events in quadrant D | 11,855,454 | 1,083,940 |
| Mode M0 | |||
|---|---|---|---|
| Quadrant | BADHDUFLAG | Total packets | Discarded packets |
| A | 0 | 36939 | 2 |
| B | 0 | 36992 | 1 |
| C | 0 | 71947 | 1 |
| D | 0 | 47425 | 1 |
| Mode M9 | |||
|---|---|---|---|
| Quadrant | BADHDUFLAG | Total packets | Discarded packets |
| A | 0 | 3 | 0 |
| B | 0 | 3 | 0 |
| C | 0 | 3 | 0 |
| D | 0 | 3 | 0 |
| Mode SS | |||
|---|---|---|---|
| Quadrant | BADHDUFLAG | Total packets | Discarded packets |
| A | 0 | 346 | 0 |
| B | 0 | 346 | 0 |
| C | 0 | 346 | 0 |
| D | 0 | 346 | 0 |
| Quadrant | Total seconds | Saturated seconds | Saturation percentage |
|---|---|---|---|
| A | 17228 | 170 | 0.986766% |
| B | 17229 | 366 | 2.124325% |
| C | 17229 | 4098 | 23.785478% |
| D | 17229 | 995 | 5.775147% |
Noise dominated data is calculated using 1-second bins in cleaned event files. If a bin has >2000 counts, and if more than 50% of those come from <1% of pixels, then it is considered to be noise-dominated and hence unusable.
| Quadrant | # 1 sec bins | Bins with >0 counts | Bins with >2000 counts | High rate bins dominated by noise | Noise dominated (total time) | Noise dominated (detector-on time) | Marked lightcurve |
|---|---|---|---|---|---|---|---|
| A | 17836 | 17512 | 19 | 19 | 0.11% | 0.11% | 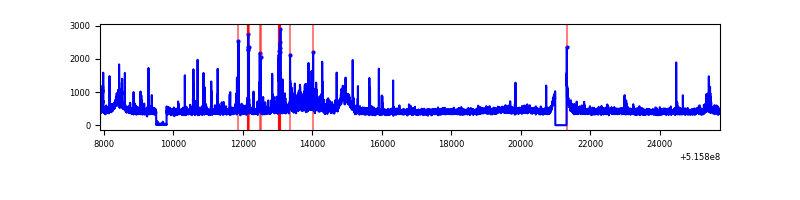 |
| B | 17837 | 17513 | 41 | 41 | 0.23% | 0.23% | 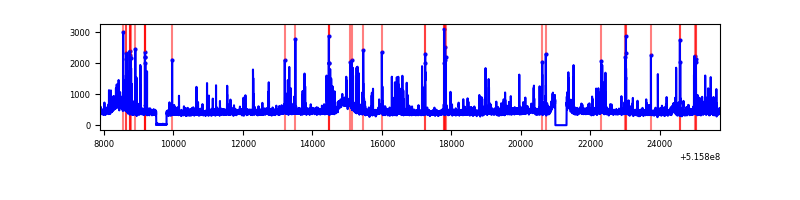 |
| C | 17837 | 17513 | 3203 | 3203 | 17.96% | 18.29% | 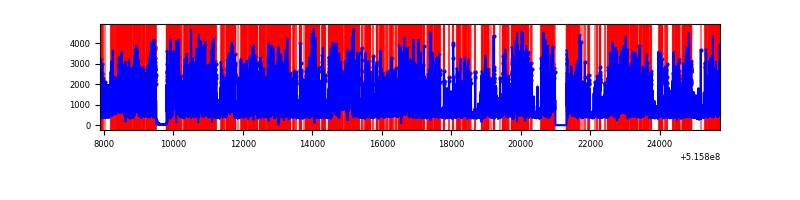 |
| D | 17837 | 17513 | 857 | 857 | 4.80% | 4.89% | 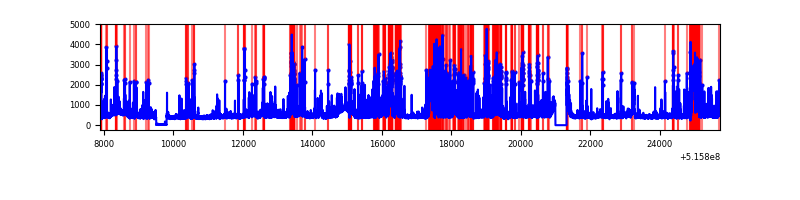 |
Top three noisy pixels from each quadrant. If the there are fewer than three noisy pixels in the level2.evt file, extra rows are filled as -1
| Pixel properties | Quadrant properties | ||||||
|---|---|---|---|---|---|---|---|
| Quadrant | DetID | PixID | Counts | Sigma | Mean | Median | Sigma |
| A | 3 | 14 | 315318 | 685.5 | 1870 | 1818 | 457.3 |
| A | 0 | 12 | 231087 | 501.32 | 1870 | 1818 | 457.3 |
| A | 4 | 13 | 97353 | 208.9 | 1870 | 1818 | 457.3 |
| B | 5 | 185 | 229350 | 579.78 | 1844 | 1769 | 392.5 |
| B | 4 | 201 | 189789 | 479.0 | 1844 | 1769 | 392.5 |
| B | 0 | 245 | 111472 | 279.48 | 1844 | 1769 | 392.5 |
| C | 15 | 224 | 12572012 | 28739.59 | 1612 | 1601 | 437.4 |
| C | 14 | 254 | 413181 | 940.99 | 1612 | 1601 | 437.4 |
| C | 8 | 7 | 309087 | 703.0 | 1612 | 1601 | 437.4 |
| D | 8 | 240 | 2516250 | 5120.46 | 1768 | 1691 | 491.1 |
| D | 7 | 96 | 557330 | 1131.46 | 1768 | 1691 | 491.1 |
| D | 2 | 249 | 459450 | 932.15 | 1768 | 1691 | 491.1 |
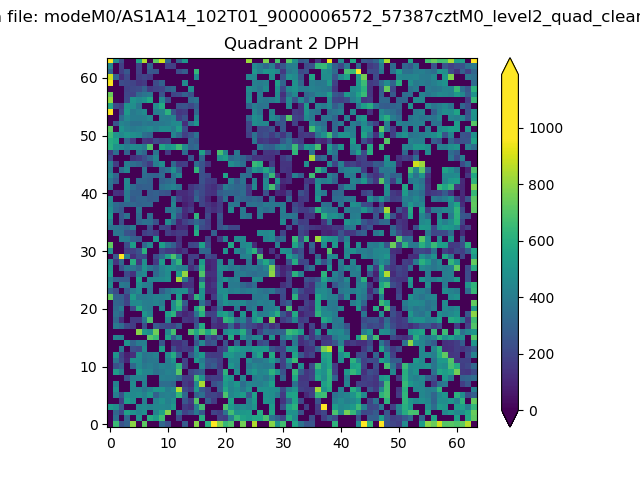
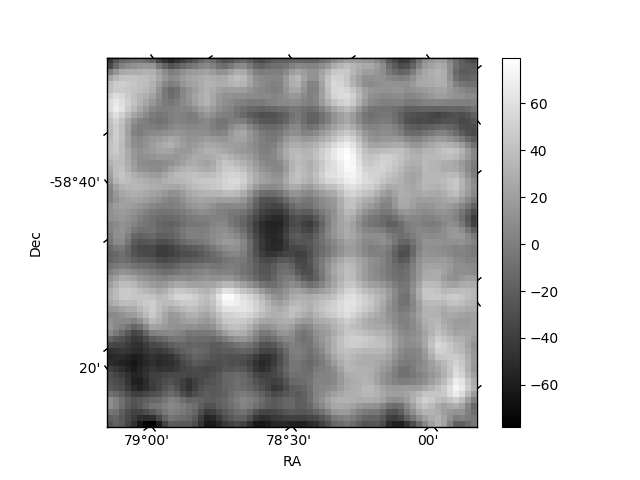
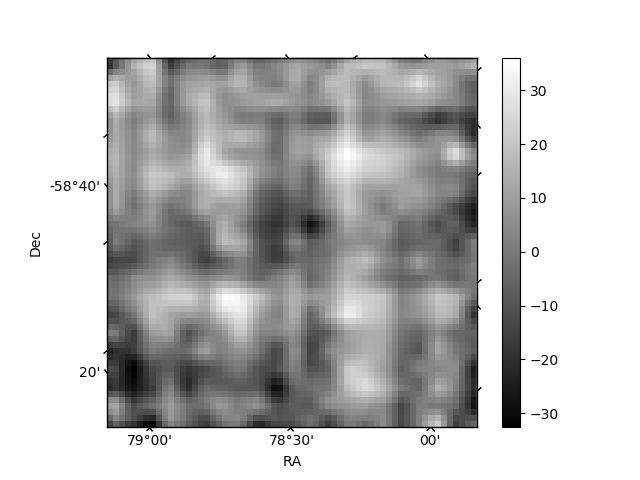
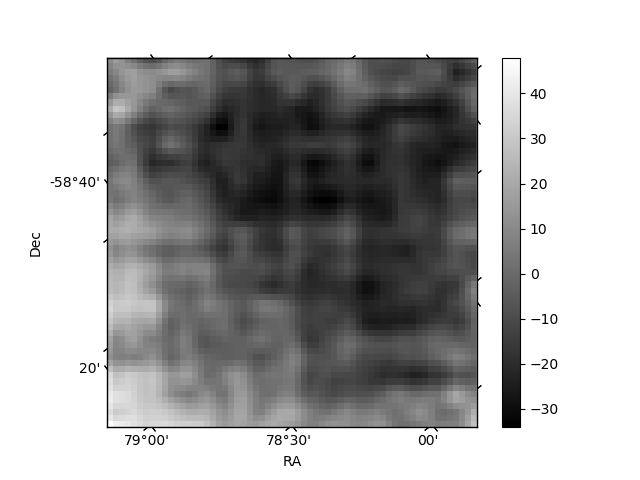
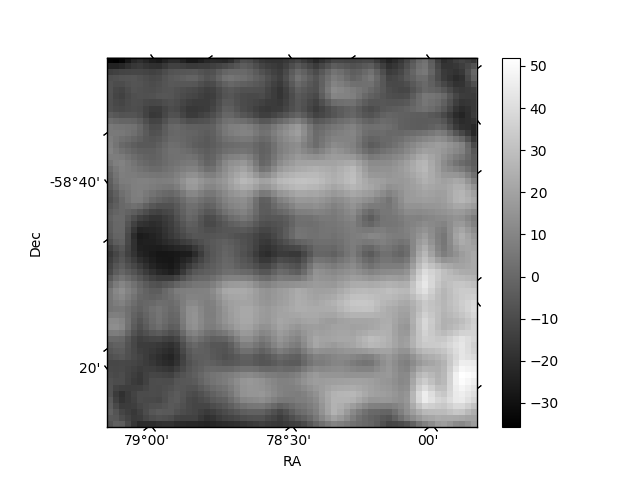
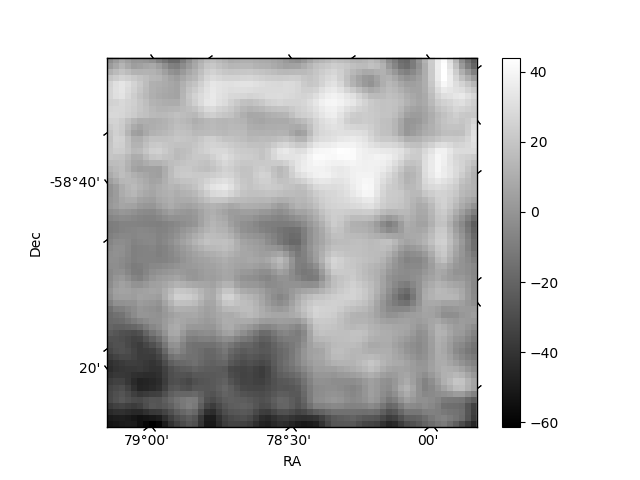
Histogram calculated using DETX and DETY for each event in the final _common_clean file
| Quadrant A | 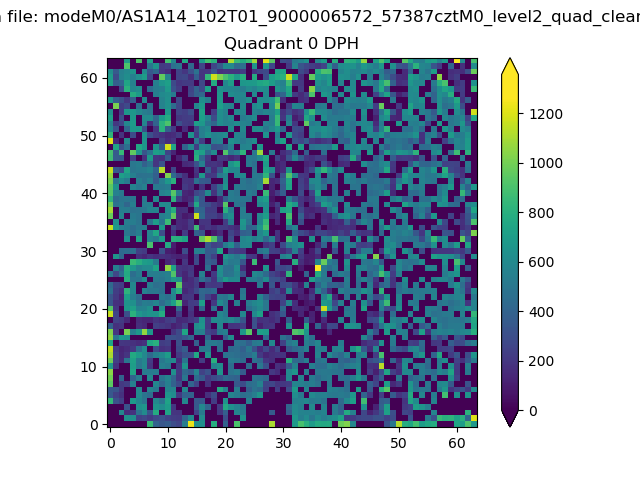 |
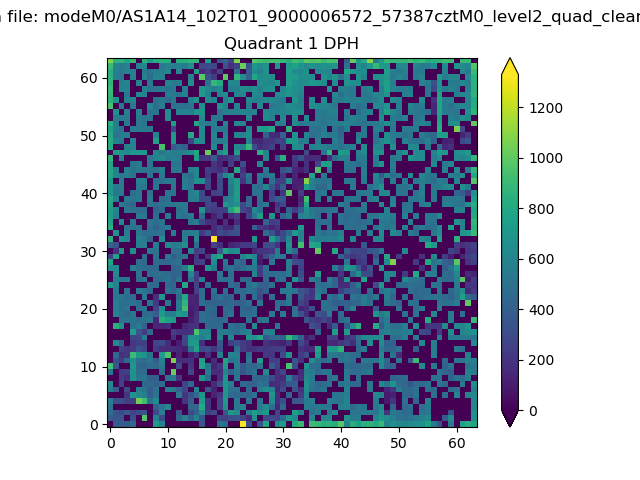 |
Quadrant B |
|---|---|---|---|
| Quadrant D | 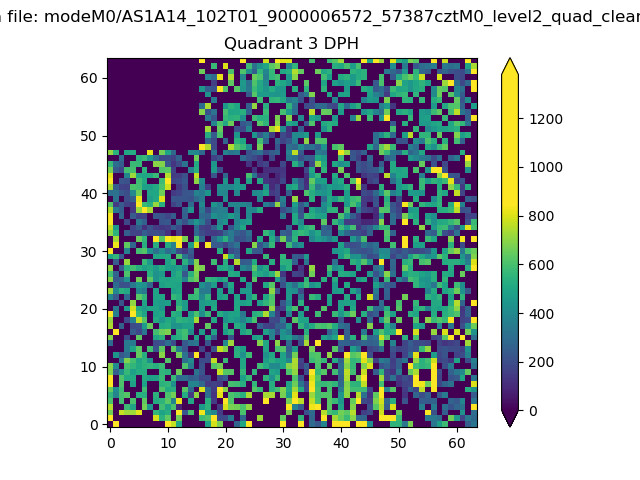 |
 |
Quadrant C |
| Plot type | Count rate plots | Images |
|---|---|---|
| Comparison with Poisson distribution Blue bars denote a histogram of data divided into 1 sec bins. Red curve is a Poisson curve with rate = median count rate of data. |
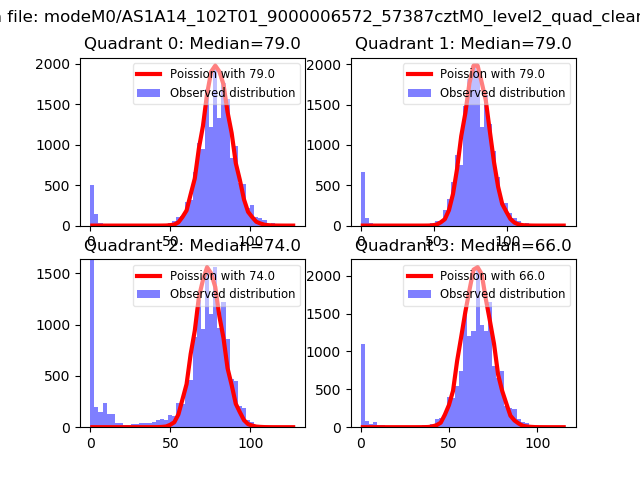 |
 |
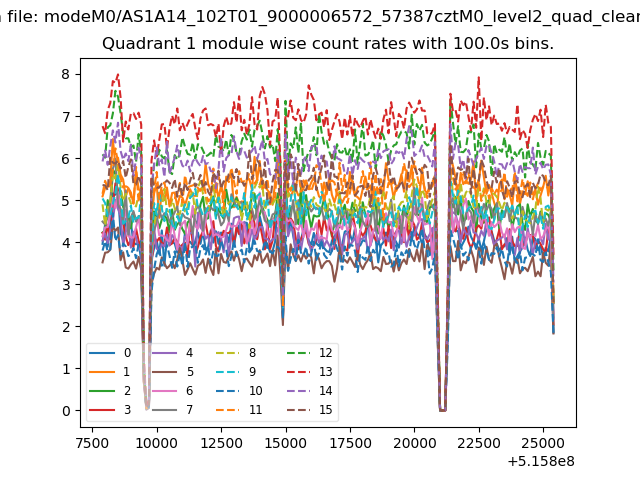
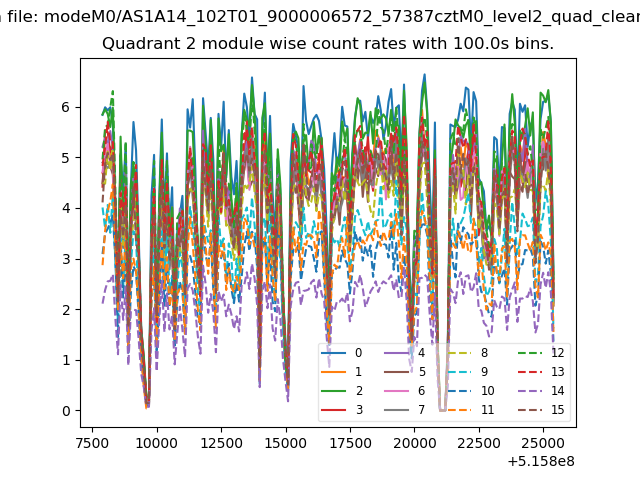
| Quadrant-wise count rates Data is divided into 100 sec bins |
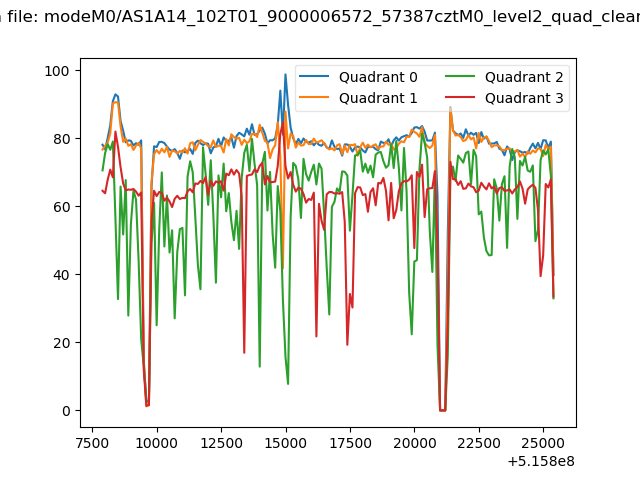 |
|
| Module-wise count rates for Quadrant A Data is divided into 100 sec bins |
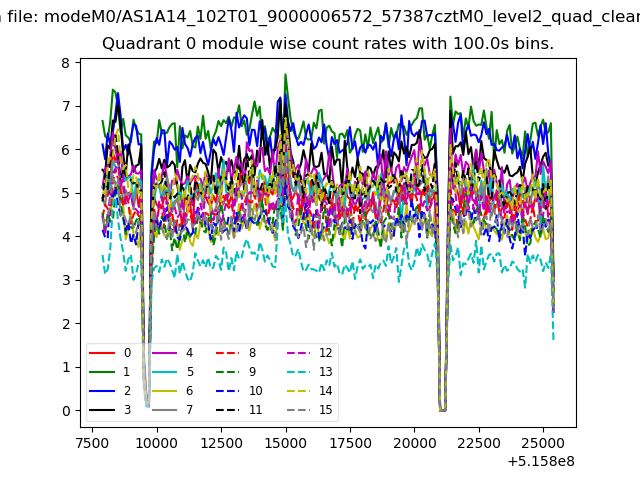 |
 |
| Module-wise count rates for Quadrant B Data is divided into 100 sec bins |
 |
 |
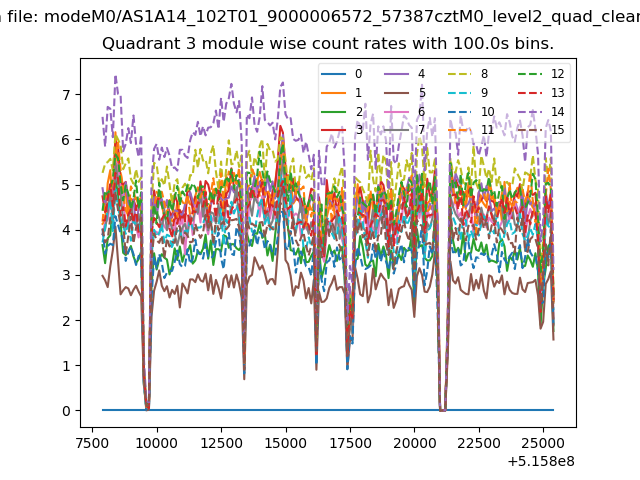
| Module-wise count rates for Quadrant C Data is divided into 100 sec bins |
 |
 |
| Module-wise count rates for Quadrant D Data is divided into 100 sec bins |
 |
 |
| Parameter | Plot |
|---|---|
| CZT HV Monitor | 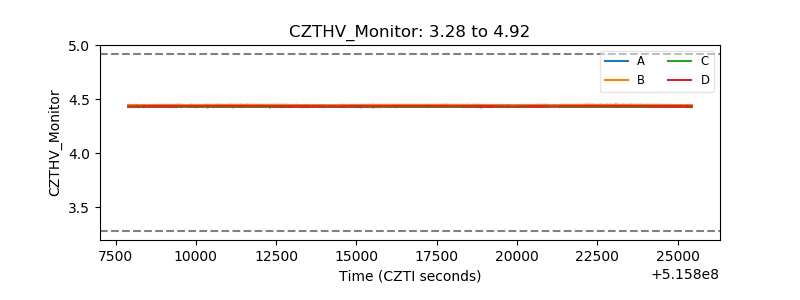 |
| D_VDD | 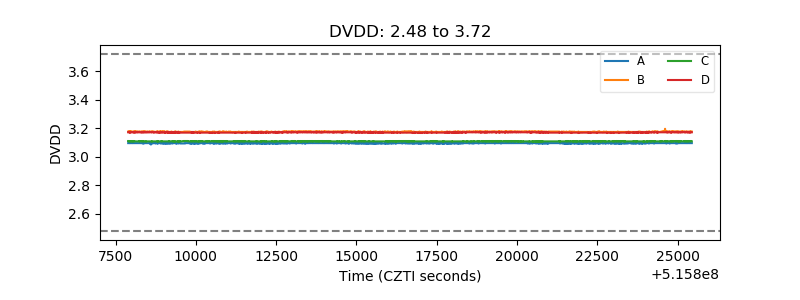 |
| Temperature 1 | 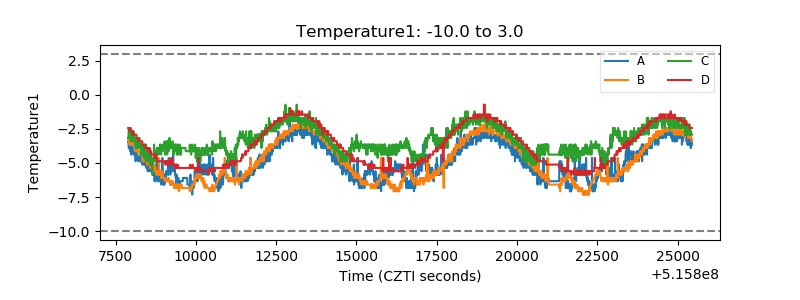 |
| Veto HV Monitor | 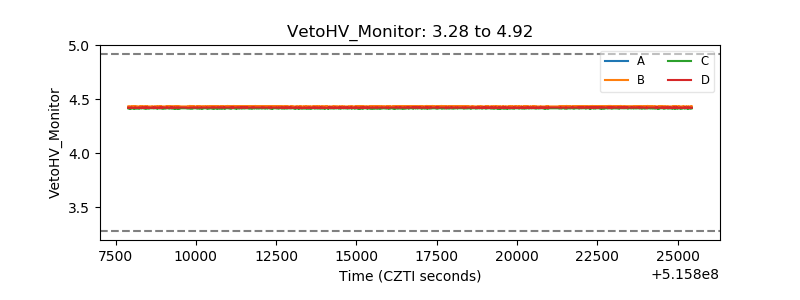 |
| Veto LLD | 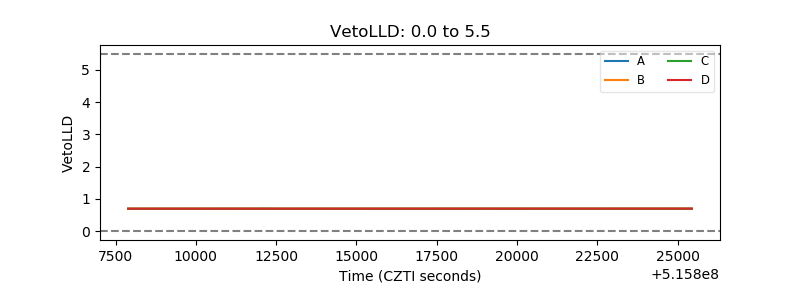 |
| Alpha Counter | 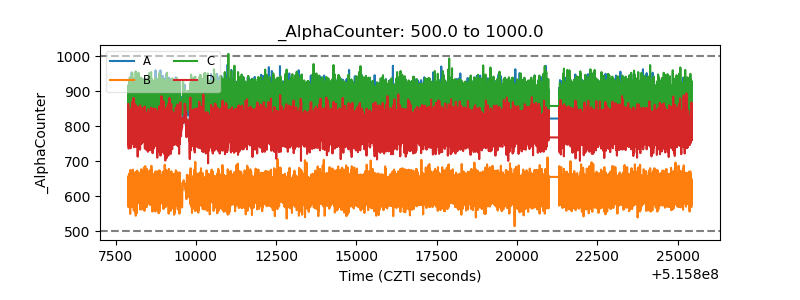 |
| _CPM_Rate | 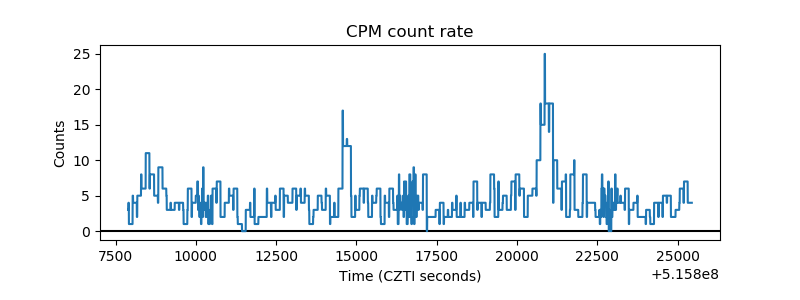 |
| CZT Counter | 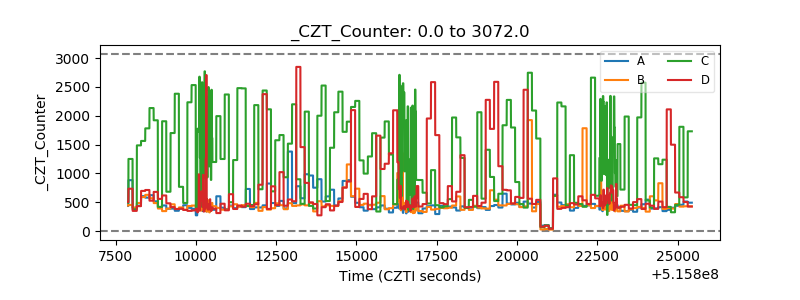 |
| +2.5 Volts monitor | 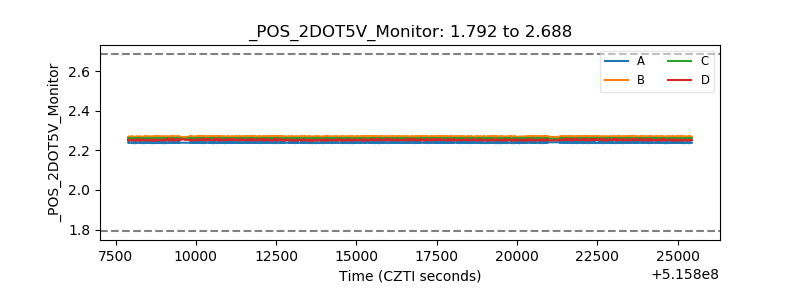 |
| +5 Volts monitor | 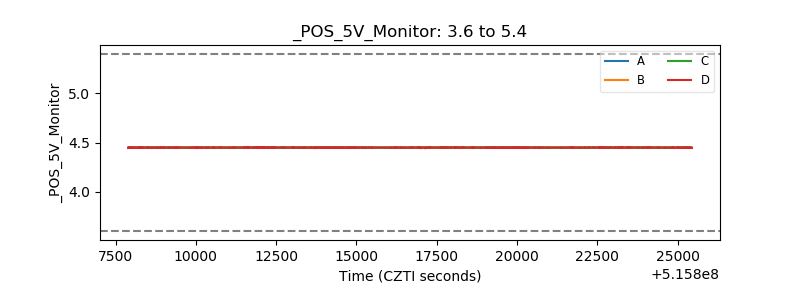 |
| _ROLL_ROT | 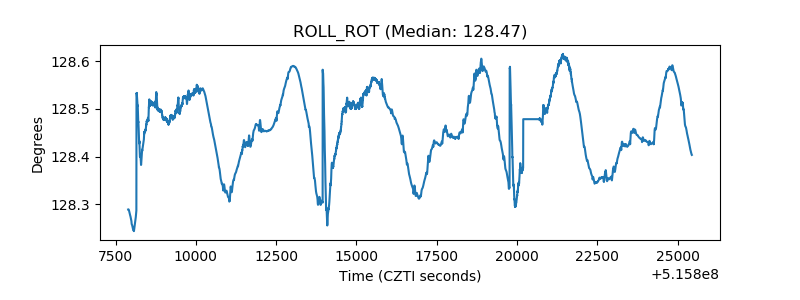 |
| _Roll_DEC | 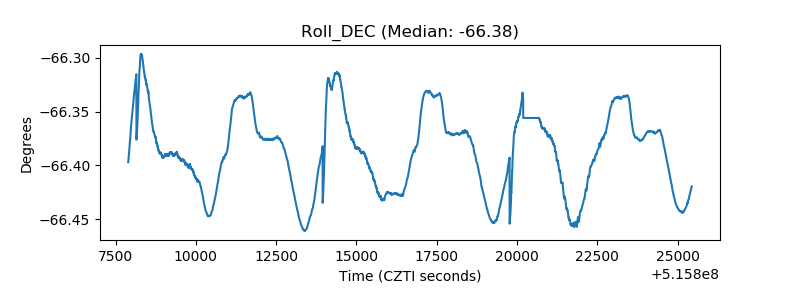 |
| _Roll_RA | 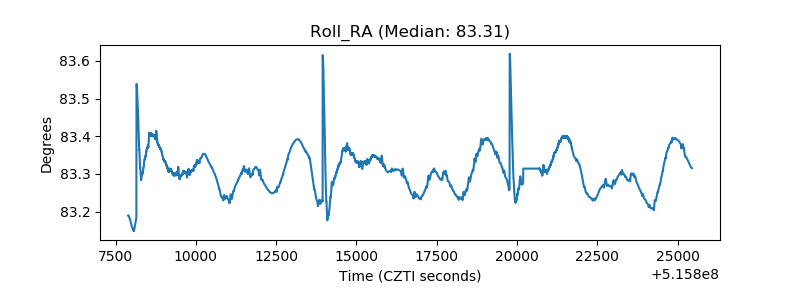 |
| Veto Counter | 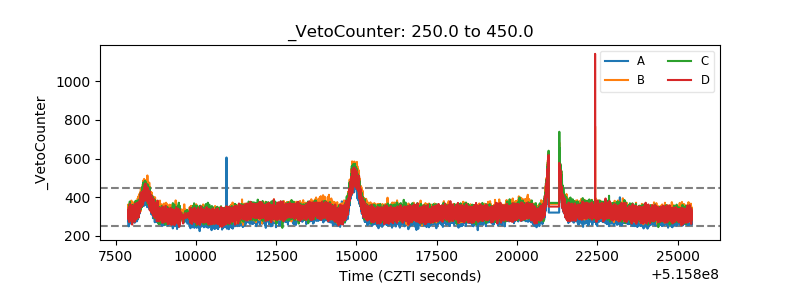 |