| Param | Original file | Final file |
|---|---|---|
| Filename | modeM0/AS1A14_102T01_9000006572_57391cztM0_level2.fits | modeM0/AS1A14_102T01_9000006572_57391cztM0_level2_quad_clean.evt |
| Size (bytes) | 445,740,480 | 83,393,280 |
| Size | 425.1 MB | 79.5 MB |
| Events in quadrant A | 2,764,273 | 569,570 |
| Events in quadrant B | 2,727,836 | 608,579 |
| Events in quadrant C | 7,056,009 | 429,784 |
| Events in quadrant D | 3,493,620 | 506,259 |
| Mode M0 | |||
|---|---|---|---|
| Quadrant | BADHDUFLAG | Total packets | Discarded packets |
| A | 0 | 12355 | 1 |
| B | 0 | 12396 | 1 |
| C | 0 | 25061 | 1 |
| D | 0 | 14462 | 1 |
| Mode M9 | |||
|---|---|---|---|
| Quadrant | BADHDUFLAG | Total packets | Discarded packets |
| A | 0 | 11 | 0 |
| B | 0 | 11 | 0 |
| C | 0 | 11 | 0 |
| D | 0 | 11 | 0 |
| Mode SS | |||
|---|---|---|---|
| Quadrant | BADHDUFLAG | Total packets | Discarded packets |
| A | 0 | 118 | 0 |
| B | 0 | 118 | 0 |
| C | 0 | 118 | 0 |
| D | 0 | 118 | 0 |
| Quadrant | Total seconds | Saturated seconds | Saturation percentage |
|---|---|---|---|
| A | 5884 | 72 | 1.223657% |
| B | 5884 | 68 | 1.155676% |
| C | 5884 | 1517 | 25.781781% |
| D | 5884 | 193 | 3.280082% |
Noise dominated data is calculated using 1-second bins in cleaned event files. If a bin has >2000 counts, and if more than 50% of those come from <1% of pixels, then it is considered to be noise-dominated and hence unusable.
| Quadrant | # 1 sec bins | Bins with >0 counts | Bins with >2000 counts | High rate bins dominated by noise | Noise dominated (total time) | Noise dominated (detector-on time) | Marked lightcurve |
|---|---|---|---|---|---|---|---|
| A | 6919 | 5887 | 9 | 9 | 0.13% | 0.15% | 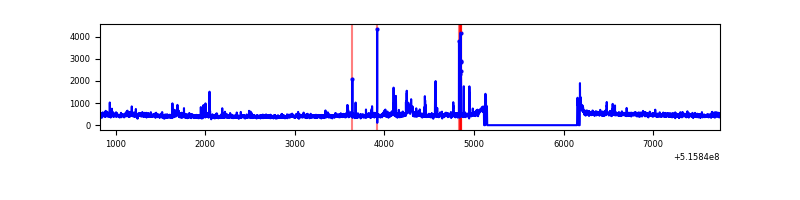 |
| B | 6919 | 5887 | 11 | 11 | 0.16% | 0.19% | 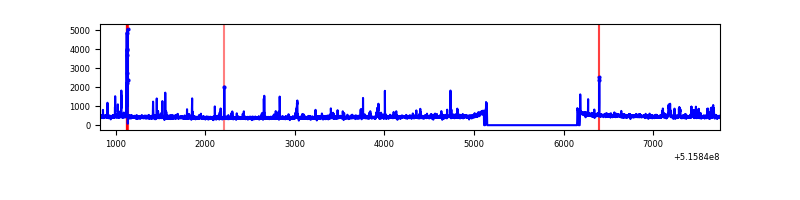 |
| C | 6919 | 5886 | 1206 | 1206 | 17.43% | 20.49% | 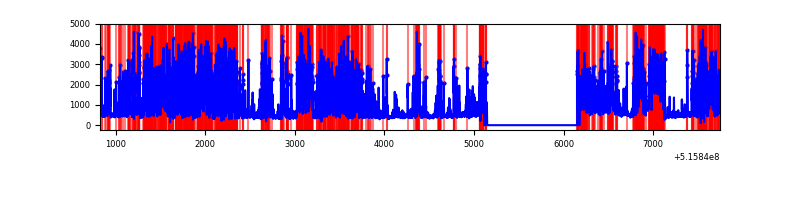 |
| D | 6919 | 5887 | 160 | 160 | 2.31% | 2.72% | 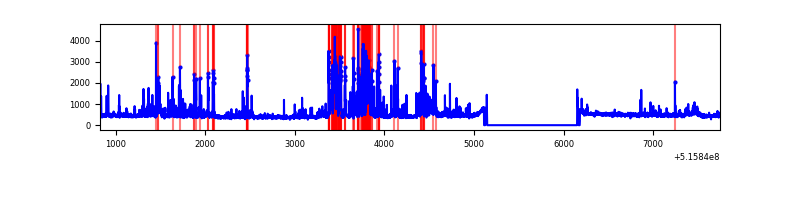 |
Top three noisy pixels from each quadrant. If the there are fewer than three noisy pixels in the level2.evt file, extra rows are filled as -1
| Pixel properties | Quadrant properties | ||||||
|---|---|---|---|---|---|---|---|
| Quadrant | DetID | PixID | Counts | Sigma | Mean | Median | Sigma |
| A | 0 | 12 | 89810 | 564.15 | 642 | 625 | 158.1 |
| A | 3 | 14 | 60937 | 381.51 | 642 | 625 | 158.1 |
| A | 3 | 61 | 60817 | 380.75 | 642 | 625 | 158.1 |
| B | 10 | 247 | 73113 | 533.73 | 627 | 603 | 135.9 |
| B | 0 | 245 | 60350 | 439.79 | 627 | 603 | 135.9 |
| B | 5 | 185 | 25720 | 184.88 | 627 | 603 | 135.9 |
| C | 15 | 224 | 4543293 | 30562.97 | 543 | 538 | 148.6 |
| C | 12 | 250 | 226806 | 1522.3 | 543 | 538 | 148.6 |
| C | 14 | 254 | 40978 | 272.07 | 543 | 538 | 148.6 |
| D | 15 | 142 | 401940 | 2324.15 | 613 | 584 | 172.7 |
| D | 3 | 224 | 317228 | 1833.6 | 613 | 584 | 172.7 |
| D | 7 | 96 | 60040 | 344.29 | 613 | 584 | 172.7 |
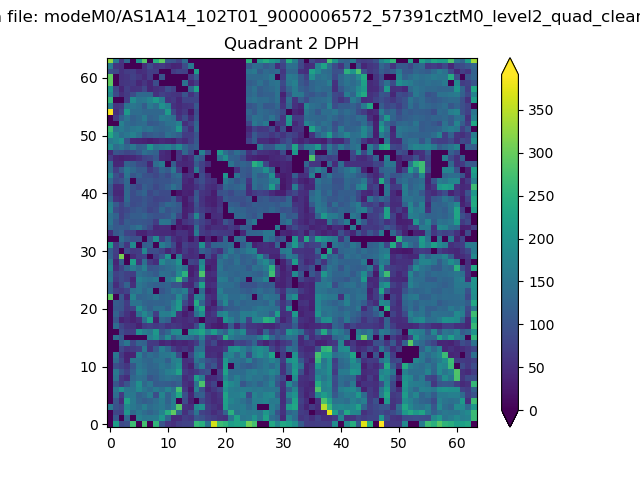
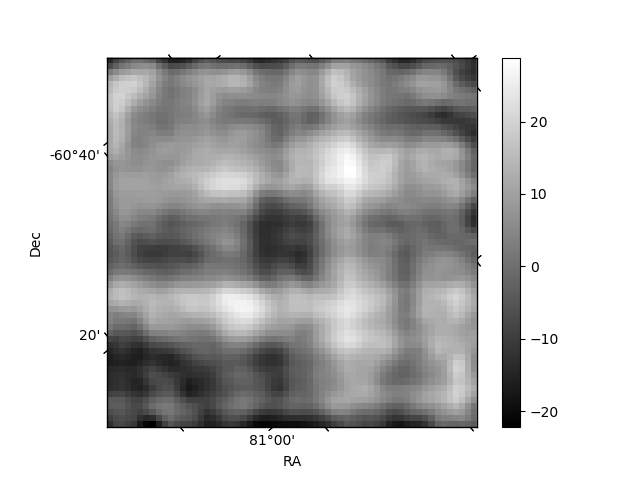
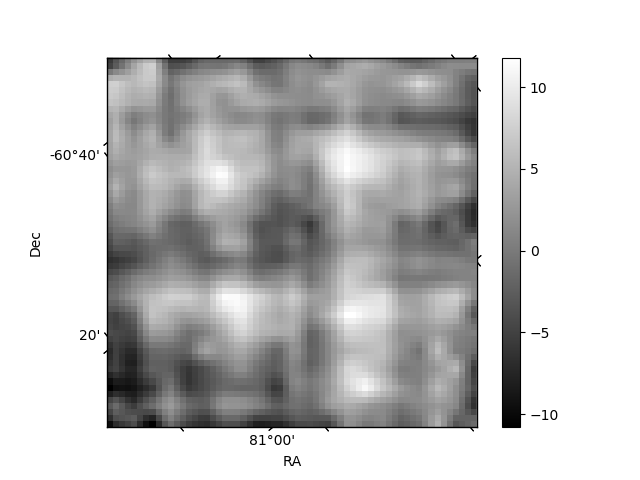
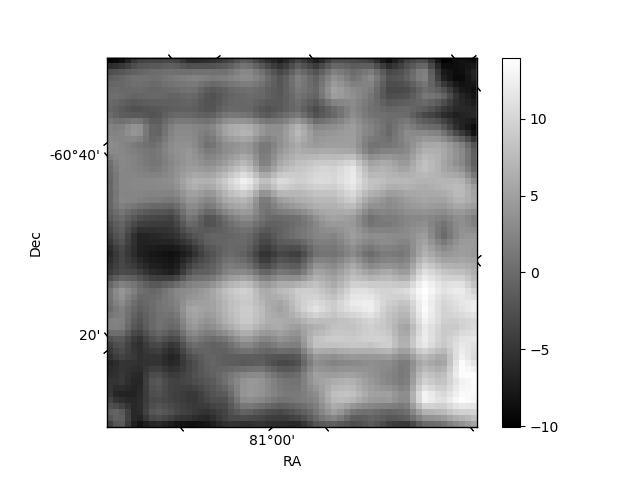
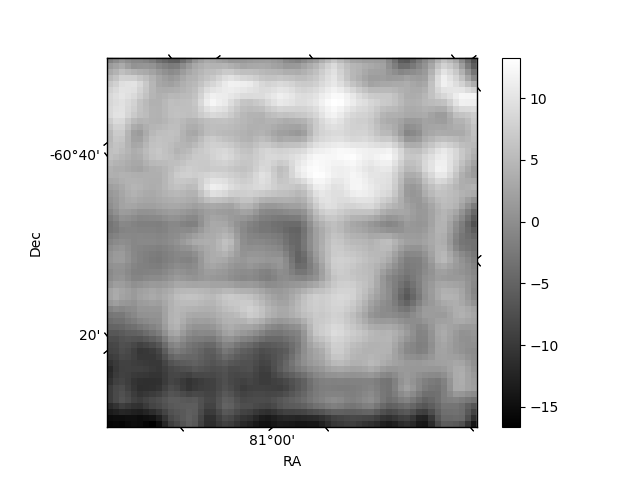
Histogram calculated using DETX and DETY for each event in the final _common_clean file
| Quadrant A | 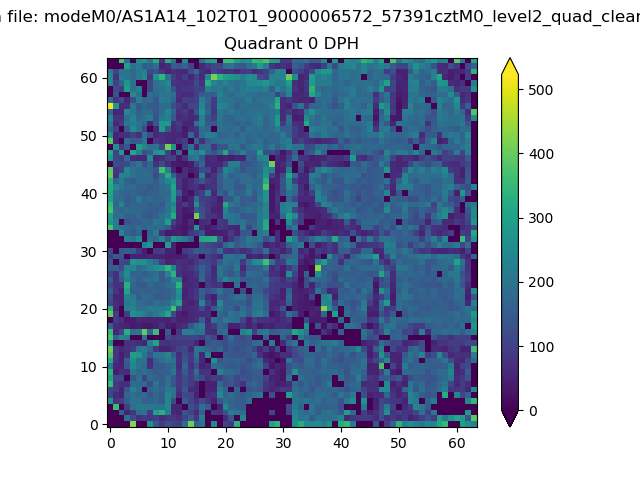 |
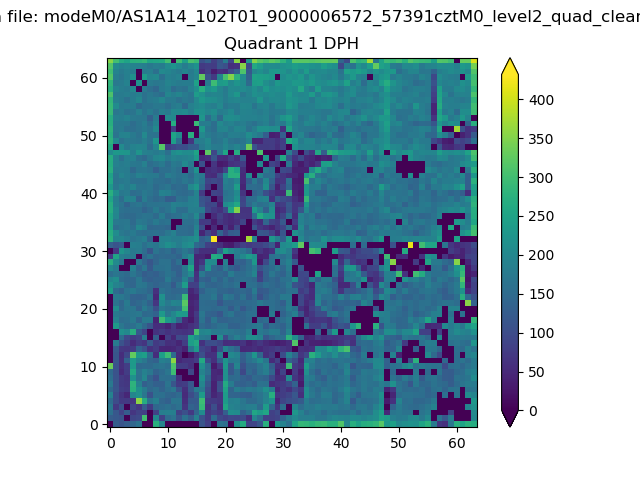 |
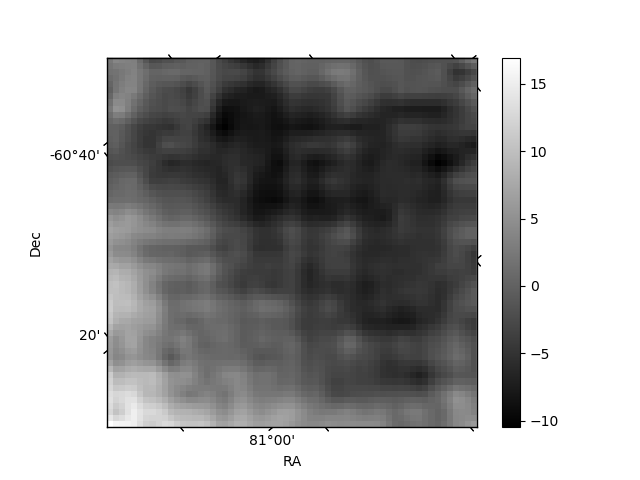
Quadrant B |
|---|---|---|---|
| Quadrant D | 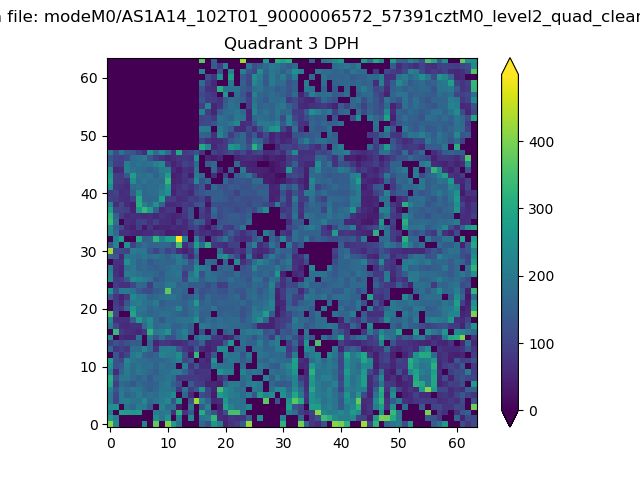 |
 |
Quadrant C |
| Plot type | Count rate plots | Images |
|---|---|---|
| Comparison with Poisson distribution Blue bars denote a histogram of data divided into 1 sec bins. Red curve is a Poisson curve with rate = median count rate of data. |
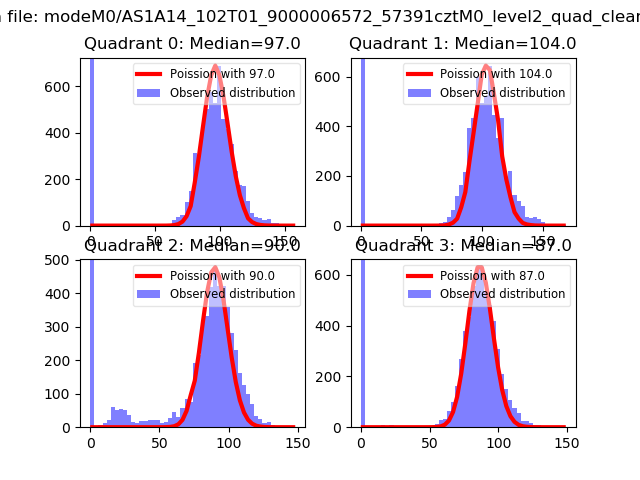 |
 |
| Quadrant-wise count rates Data is divided into 100 sec bins |
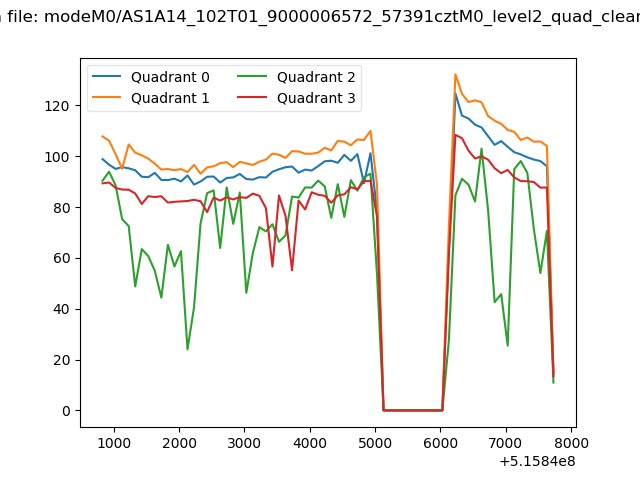 |
|
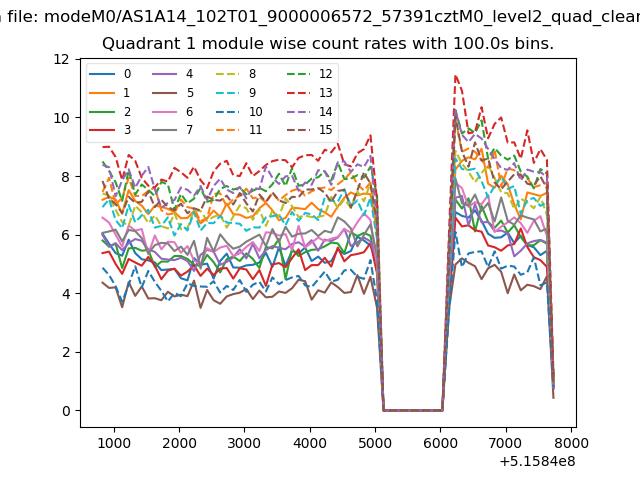
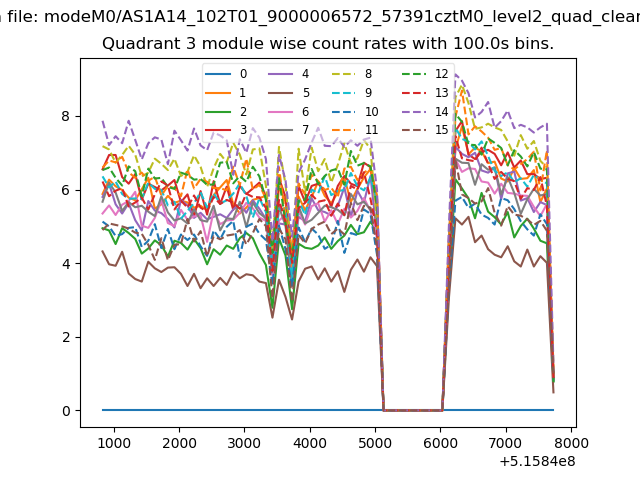
| Module-wise count rates for Quadrant A Data is divided into 100 sec bins |
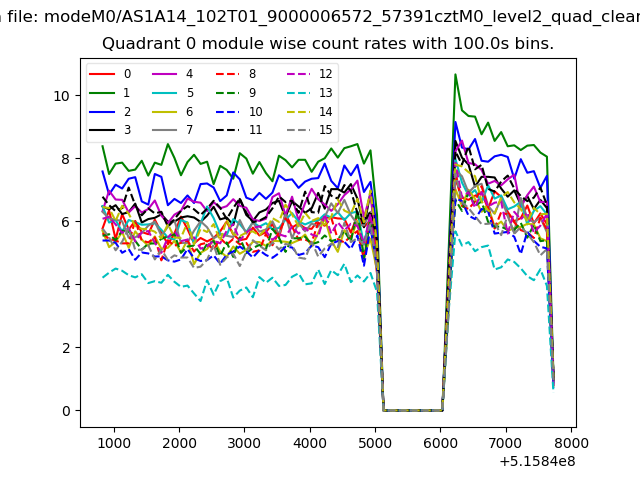 |
 |
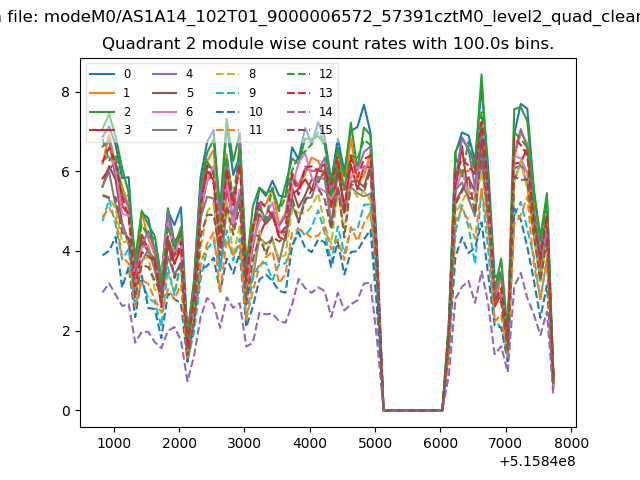
| Module-wise count rates for Quadrant B Data is divided into 100 sec bins |
 |
 |
| Module-wise count rates for Quadrant C Data is divided into 100 sec bins |
 |
 |
| Module-wise count rates for Quadrant D Data is divided into 100 sec bins |
 |
 |
| Parameter | Plot |
|---|---|
| CZT HV Monitor | 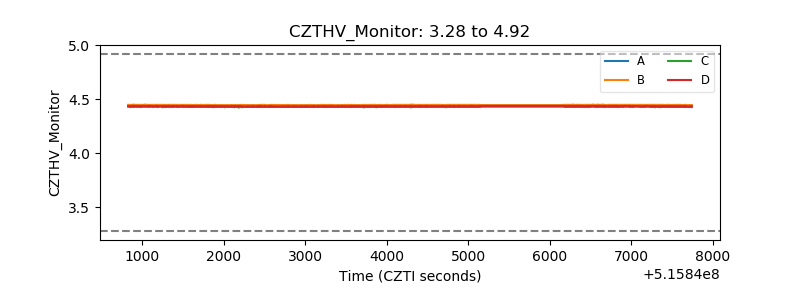 |
| D_VDD |  |
| Temperature 1 | 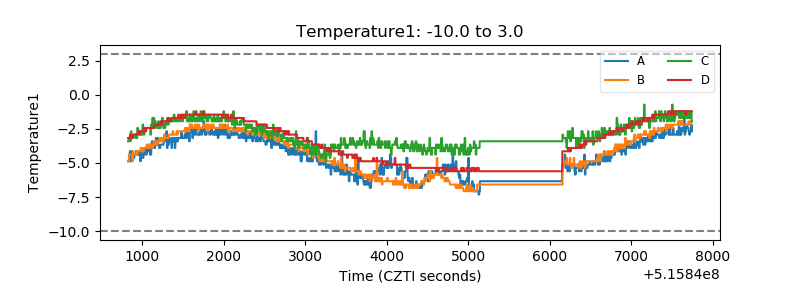 |
| Veto HV Monitor | 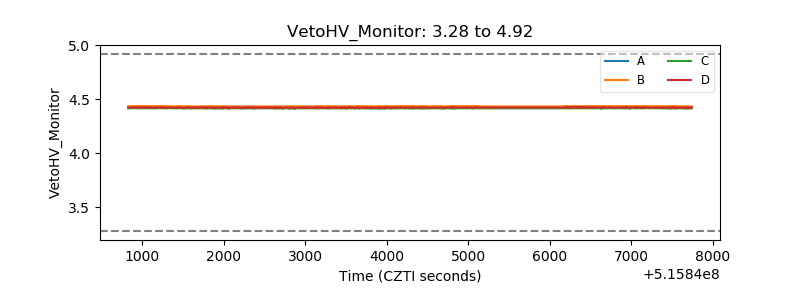 |
| Veto LLD | 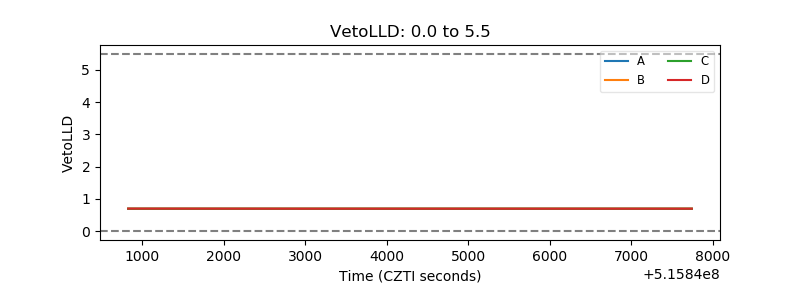 |
| Alpha Counter | 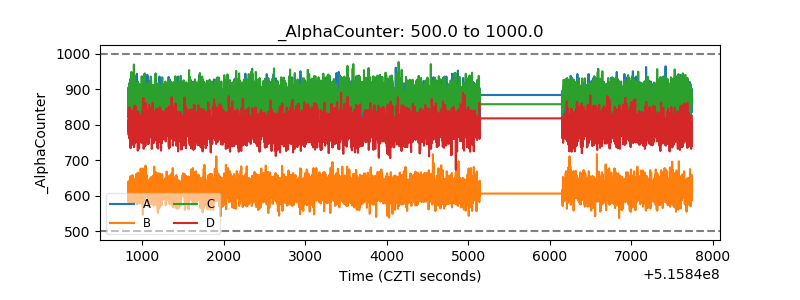 |
| _CPM_Rate | 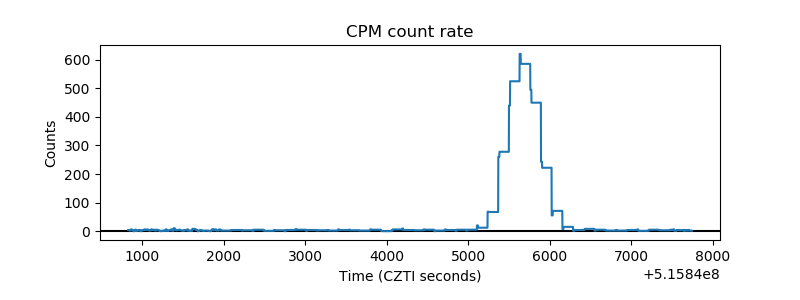 |
| CZT Counter | 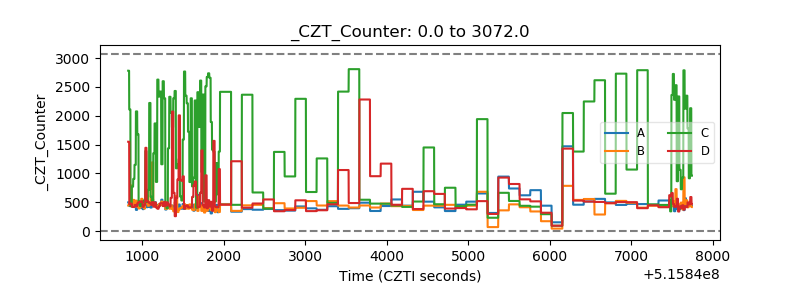 |
| +2.5 Volts monitor | 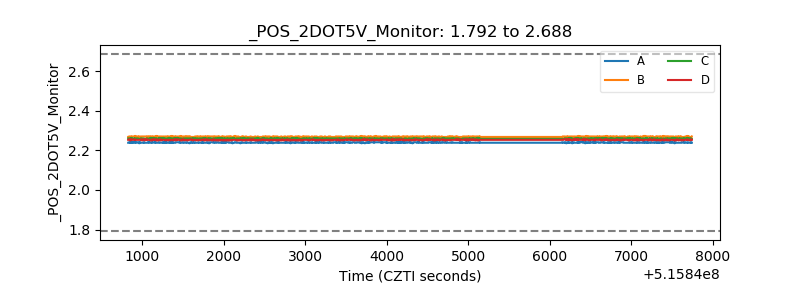 |
| +5 Volts monitor | 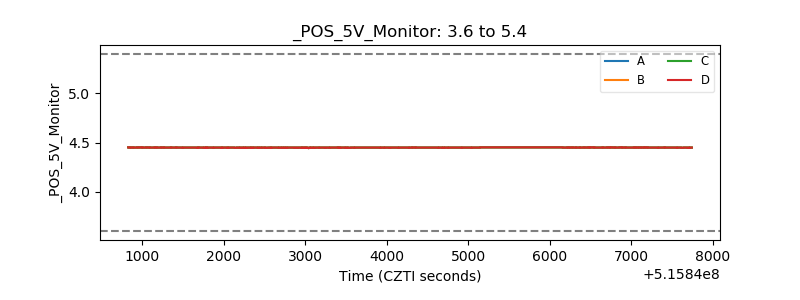 |
| _ROLL_ROT | 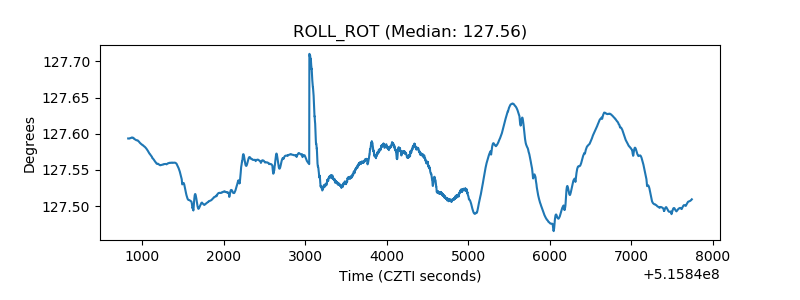 |
| _Roll_DEC | 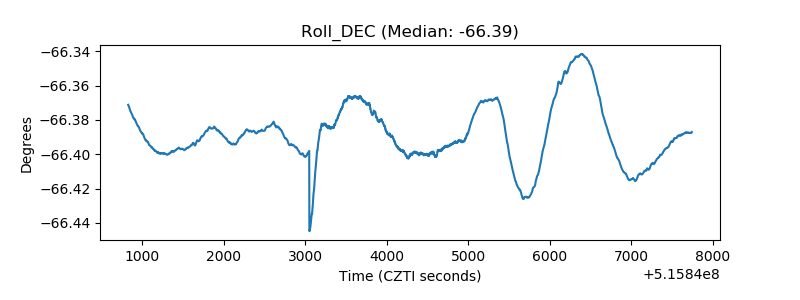 |
| _Roll_RA | 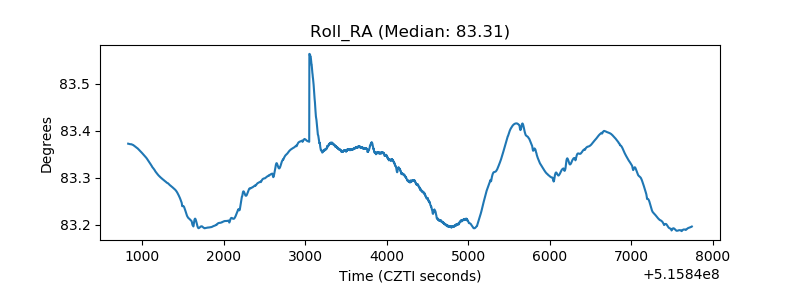 |
| Veto Counter | 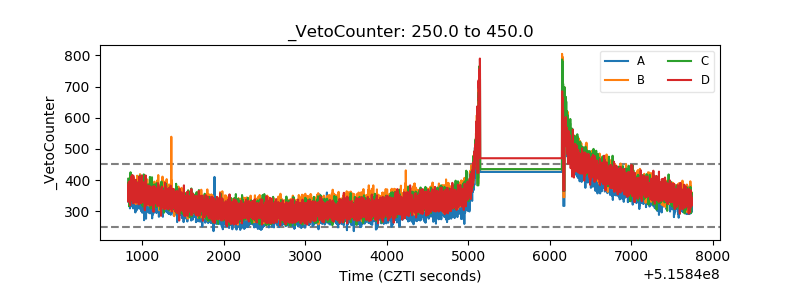 |