| Param | Original file | Final file |
|---|---|---|
| Filename | modeM0/AS1A14_102T01_9000006572_57394cztM0_level2.fits | modeM0/AS1A14_102T01_9000006572_57394cztM0_level2_quad_clean.evt |
| Size (bytes) | 416,200,320 | 83,949,120 |
| Size | 396.9 MB | 80.1 MB |
| Events in quadrant A | 2,607,383 | 576,384 |
| Events in quadrant B | 2,717,310 | 609,828 |
| Events in quadrant C | 6,718,921 | 438,738 |
| Events in quadrant D | 2,915,391 | 514,449 |
| Mode M0 | |||
|---|---|---|---|
| Quadrant | BADHDUFLAG | Total packets | Discarded packets |
| A | 0 | 11966 | 1 |
| B | 0 | 12344 | 1 |
| C | 0 | 23976 | 1 |
| D | 0 | 12769 | 1 |
| Mode M9 | |||
|---|---|---|---|
| Quadrant | BADHDUFLAG | Total packets | Discarded packets |
| A | 0 | 11 | 0 |
| B | 0 | 11 | 0 |
| C | 0 | 11 | 0 |
| D | 0 | 11 | 0 |
| Mode SS | |||
|---|---|---|---|
| Quadrant | BADHDUFLAG | Total packets | Discarded packets |
| A | 0 | 120 | 0 |
| B | 0 | 120 | 0 |
| C | 0 | 120 | 0 |
| D | 0 | 120 | 0 |
| Quadrant | Total seconds | Saturated seconds | Saturation percentage |
|---|---|---|---|
| A | 5747 | 62 | 1.078824% |
| B | 5747 | 77 | 1.339829% |
| C | 5747 | 1288 | 22.411693% |
| D | 5748 | 43 | 0.748086% |
Noise dominated data is calculated using 1-second bins in cleaned event files. If a bin has >2000 counts, and if more than 50% of those come from <1% of pixels, then it is considered to be noise-dominated and hence unusable.
| Quadrant | # 1 sec bins | Bins with >0 counts | Bins with >2000 counts | High rate bins dominated by noise | Noise dominated (total time) | Noise dominated (detector-on time) | Marked lightcurve |
|---|---|---|---|---|---|---|---|
| A | 6907 | 5747 | 1 | 1 | 0.01% | 0.02% | 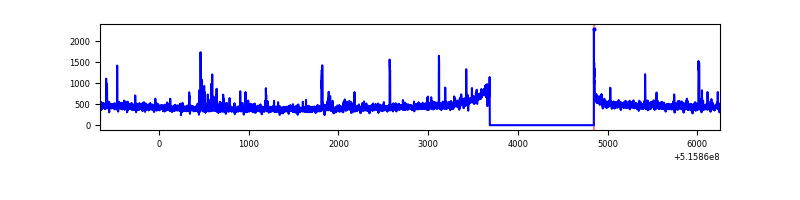 |
| B | 6907 | 5747 | 7 | 7 | 0.10% | 0.12% | 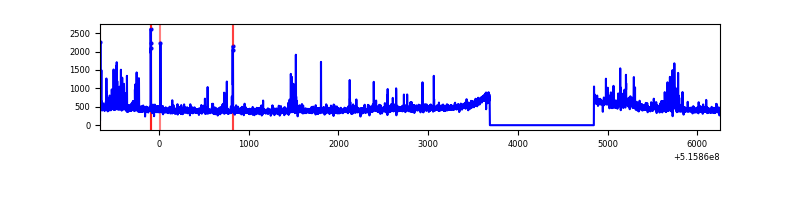 |
| C | 6907 | 5746 | 1022 | 1022 | 14.80% | 17.79% | 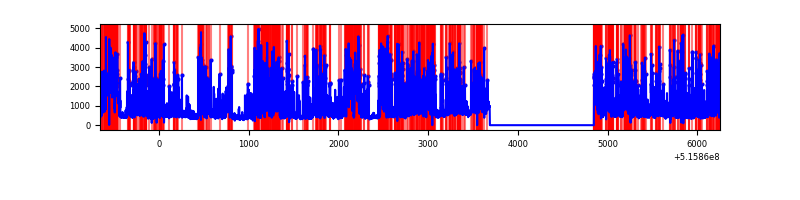 |
| D | 6908 | 5748 | 15 | 15 | 0.22% | 0.26% | 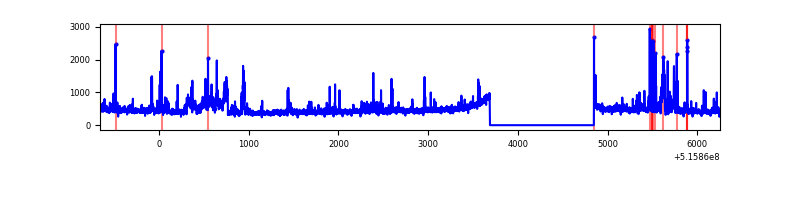 |
Top three noisy pixels from each quadrant. If the there are fewer than three noisy pixels in the level2.evt file, extra rows are filled as -1
| Pixel properties | Quadrant properties | ||||||
|---|---|---|---|---|---|---|---|
| Quadrant | DetID | PixID | Counts | Sigma | Mean | Median | Sigma |
| A | 0 | 12 | 60408 | 382.2 | 634 | 617 | 156.4 |
| A | 8 | 4 | 30892 | 193.53 | 634 | 617 | 156.4 |
| A | 10 | 251 | 27143 | 169.56 | 634 | 617 | 156.4 |
| B | 5 | 185 | 103557 | 781.5 | 621 | 597 | 131.7 |
| B | 0 | 63 | 43932 | 328.93 | 621 | 597 | 131.7 |
| B | 0 | 153 | 26013 | 192.91 | 621 | 597 | 131.7 |
| C | 15 | 224 | 4232521 | 28974.36 | 534 | 530 | 146.1 |
| C | 13 | 3 | 118811 | 809.81 | 534 | 530 | 146.1 |
| C | 14 | 254 | 68005 | 461.97 | 534 | 530 | 146.1 |
| D | 14 | 49 | 135302 | 776.32 | 606 | 576 | 173.5 |
| D | 8 | 240 | 66286 | 378.64 | 606 | 576 | 173.5 |
| D | 3 | 12 | 58165 | 331.84 | 606 | 576 | 173.5 |
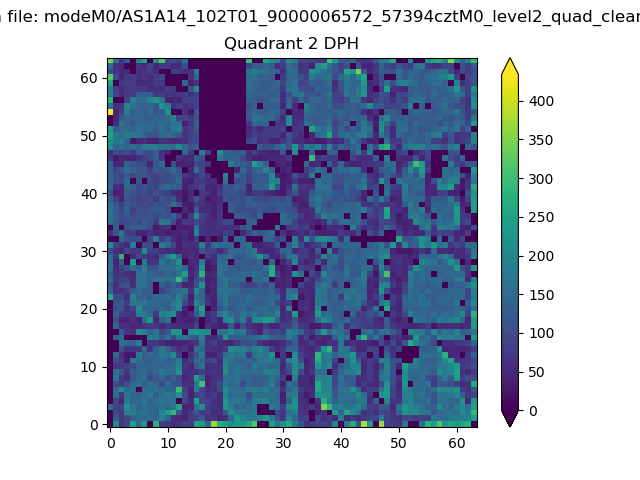
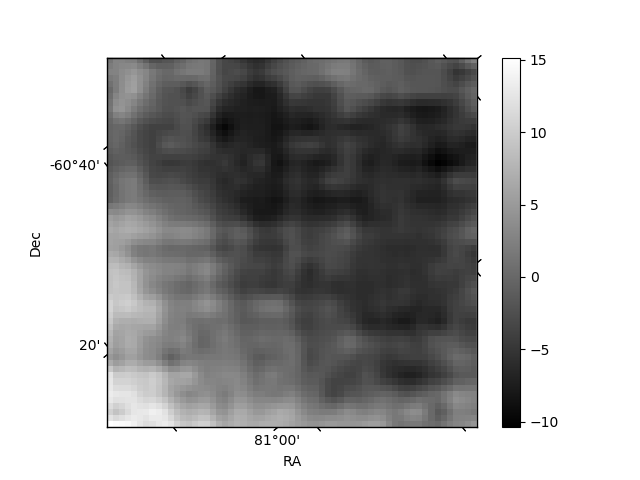
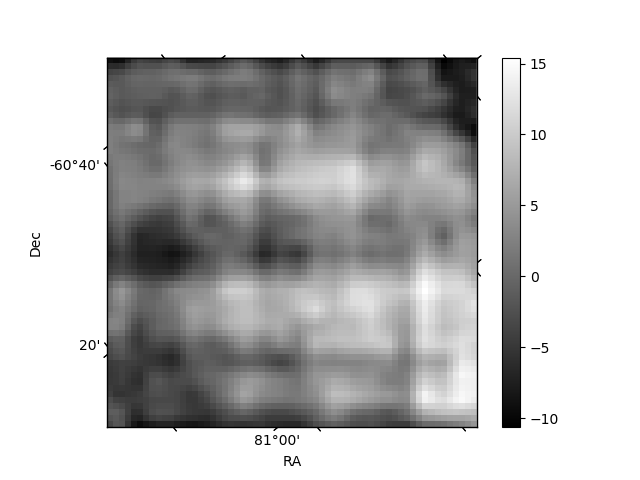
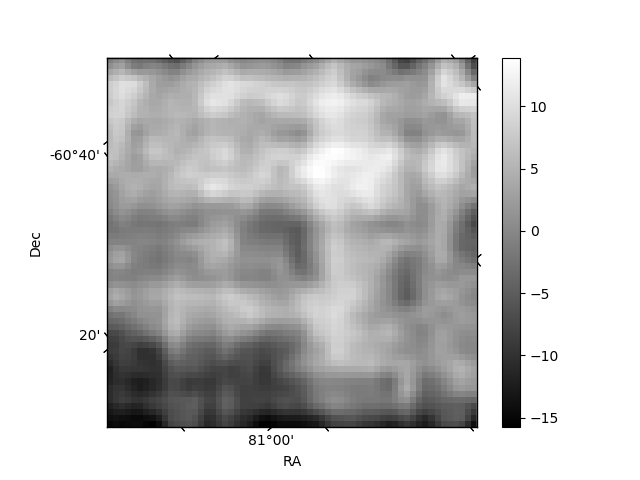
Histogram calculated using DETX and DETY for each event in the final _common_clean file
| Quadrant A | 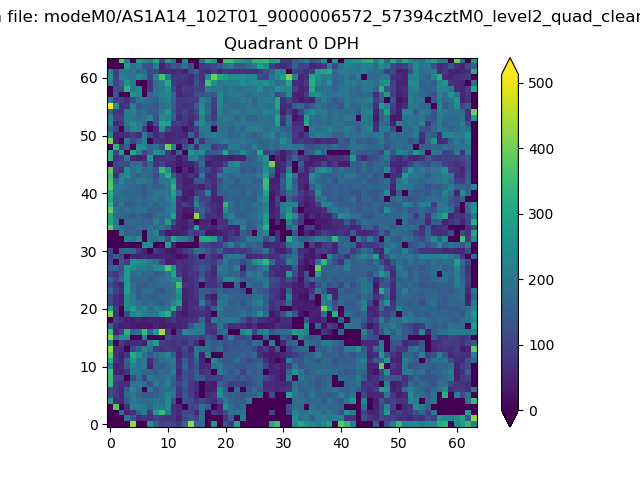 |
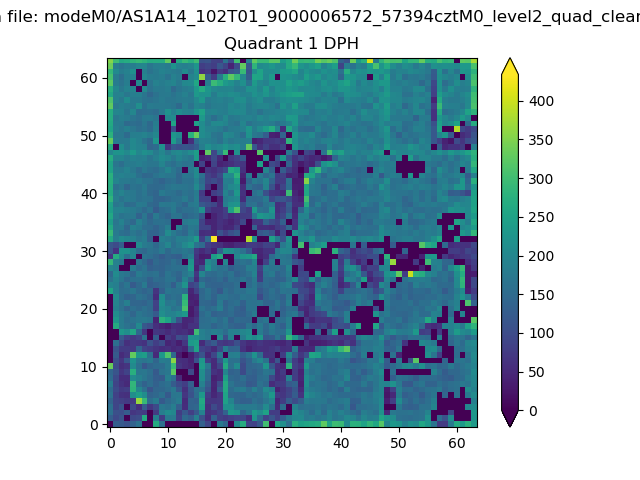 |
Quadrant B |
|---|---|---|---|
| Quadrant D | 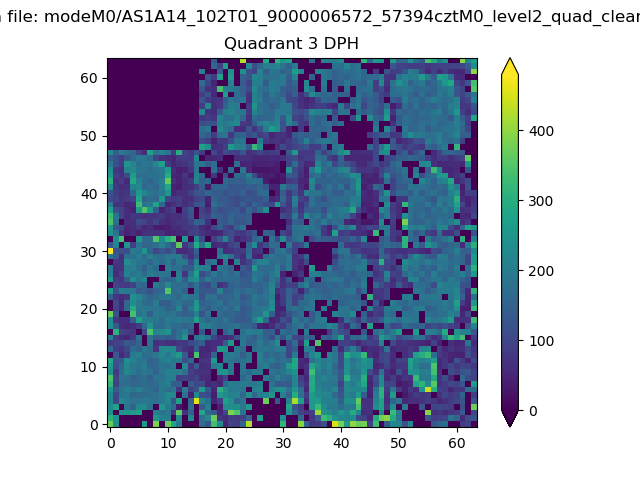 |
 |
Quadrant C |
| Plot type | Count rate plots | Images |
|---|---|---|
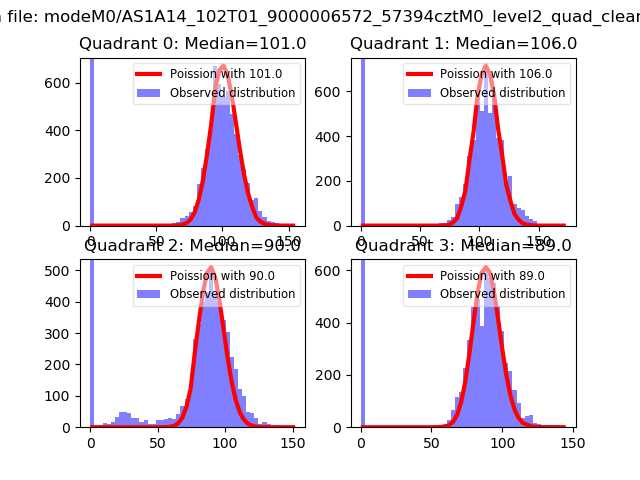
| Comparison with Poisson distribution Blue bars denote a histogram of data divided into 1 sec bins. Red curve is a Poisson curve with rate = median count rate of data. |
 |
 |
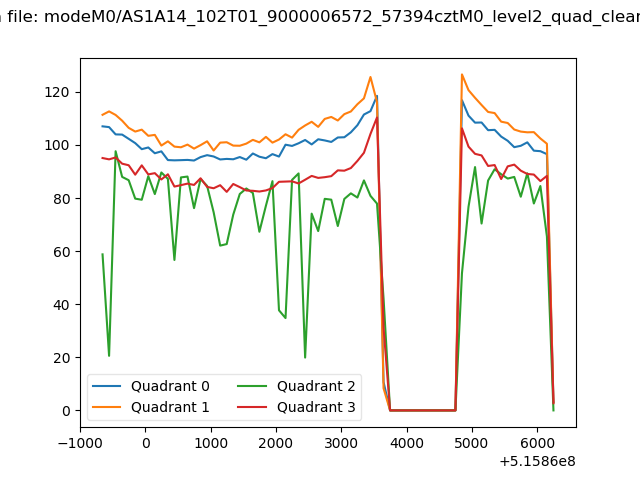
| Quadrant-wise count rates Data is divided into 100 sec bins |
 |
|
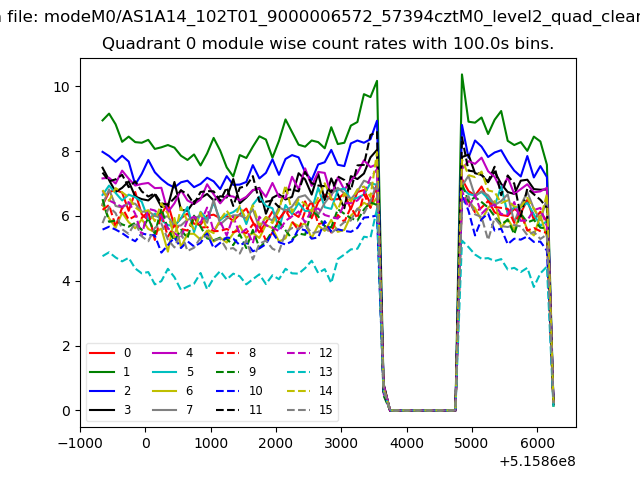
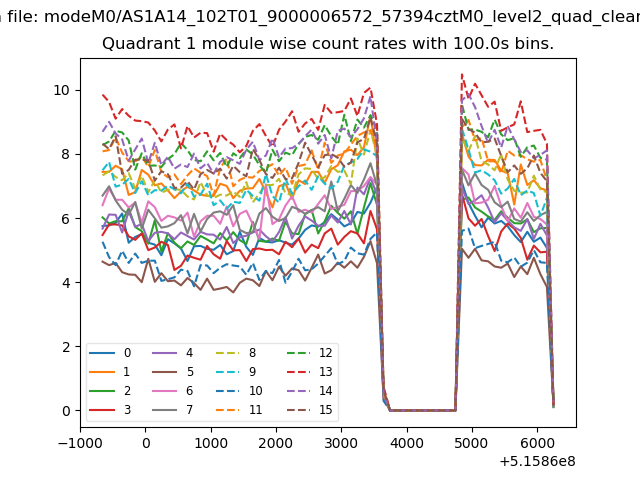
| Module-wise count rates for Quadrant A Data is divided into 100 sec bins |
 |
 |
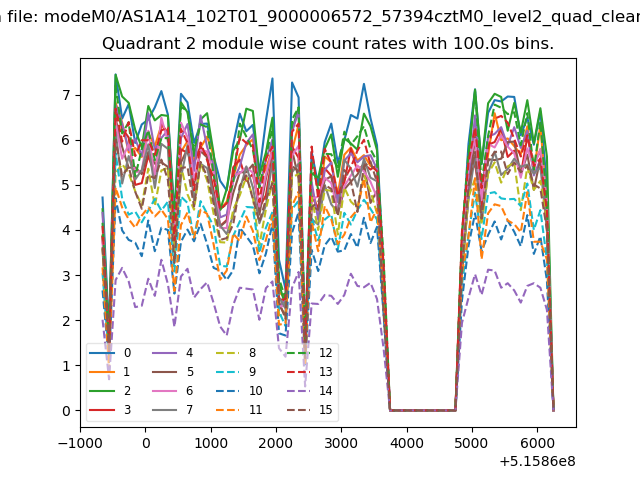
| Module-wise count rates for Quadrant B Data is divided into 100 sec bins |
 |
 |
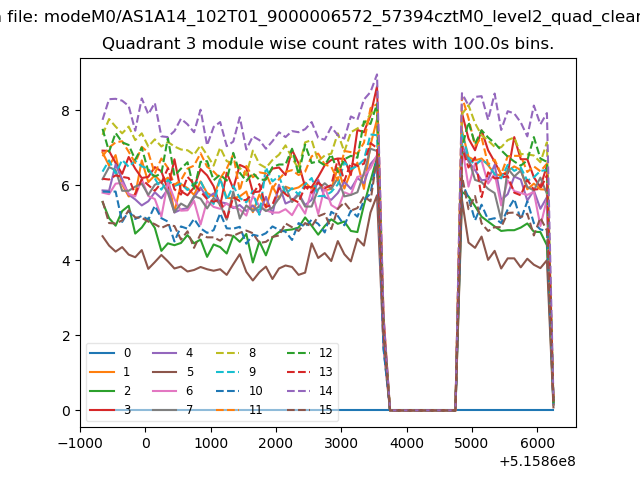
| Module-wise count rates for Quadrant C Data is divided into 100 sec bins |
 |
 |
| Module-wise count rates for Quadrant D Data is divided into 100 sec bins |
 |
 |
| Parameter | Plot |
|---|---|
| CZT HV Monitor | 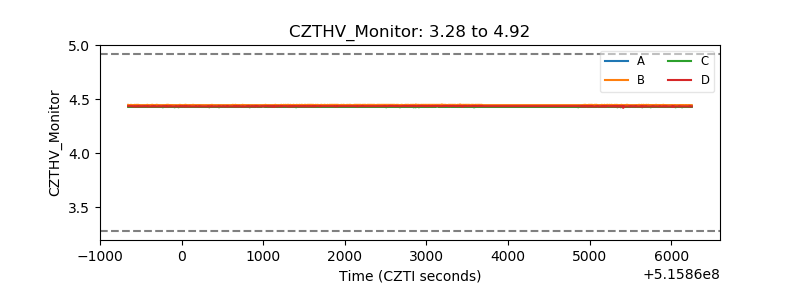 |
| D_VDD | 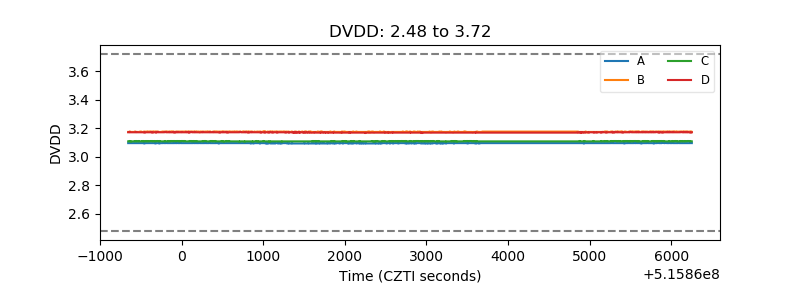 |
| Temperature 1 | 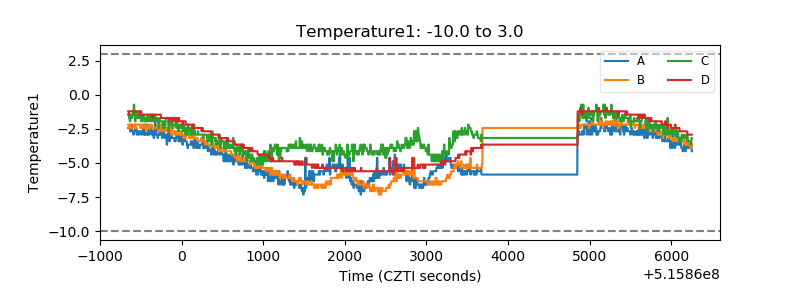 |
| Veto HV Monitor | 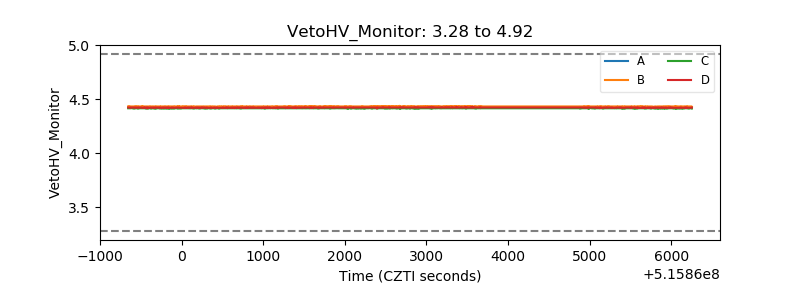 |
| Veto LLD | 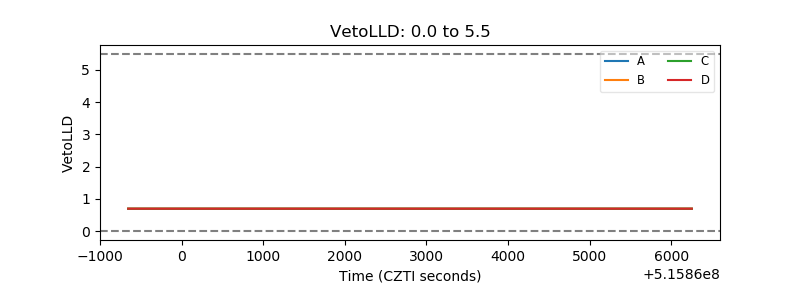 |
| Alpha Counter | 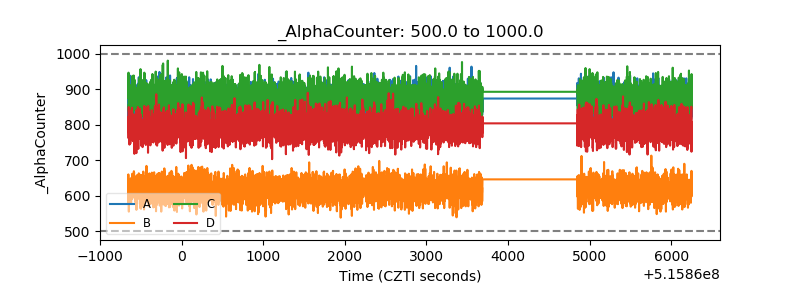 |
| _CPM_Rate | 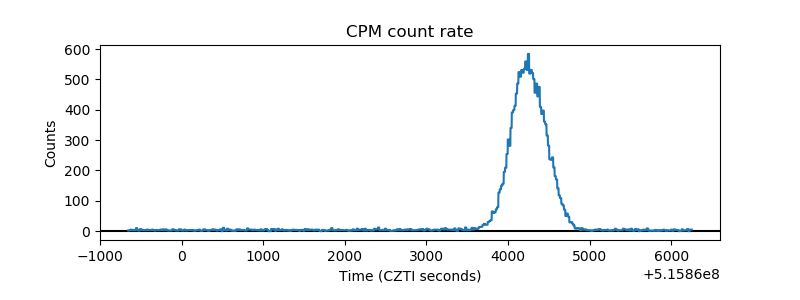 |
| CZT Counter | 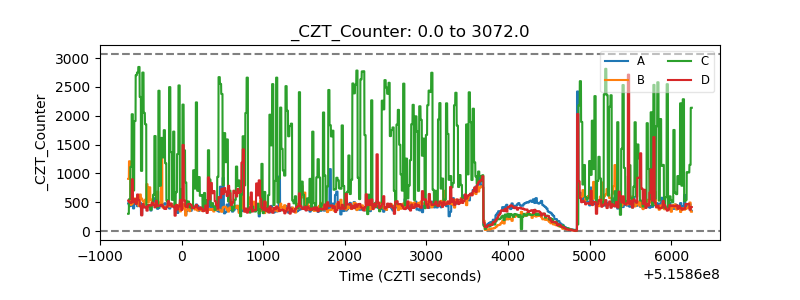 |
| +2.5 Volts monitor | 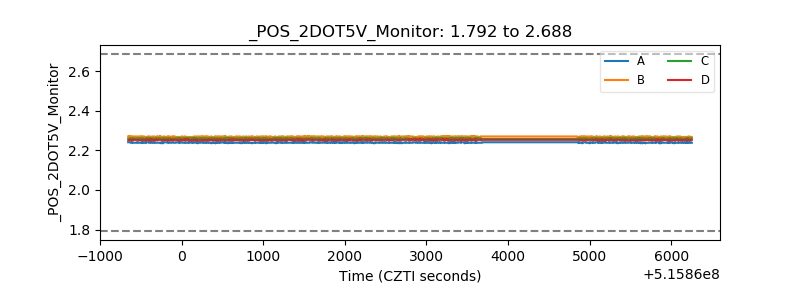 |
| +5 Volts monitor |  |
| _ROLL_ROT | 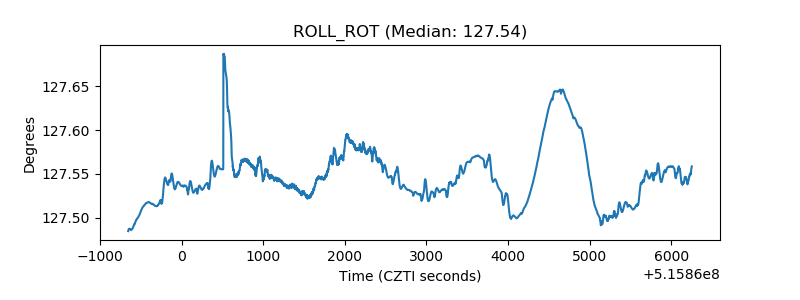 |
| _Roll_DEC | 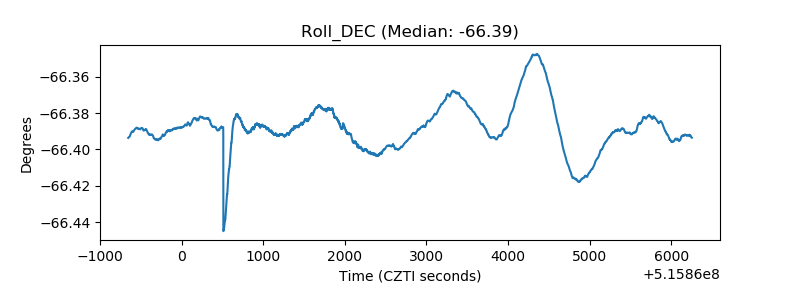 |
| _Roll_RA | 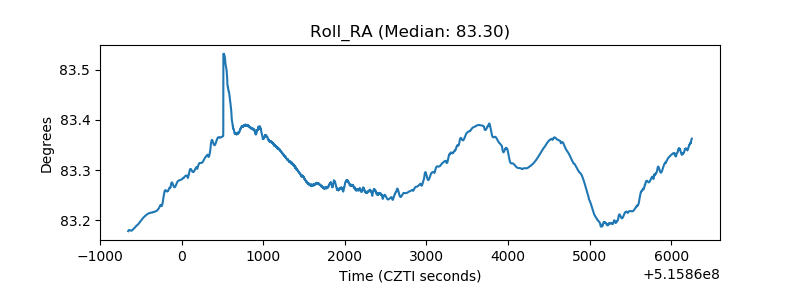 |
| Veto Counter | 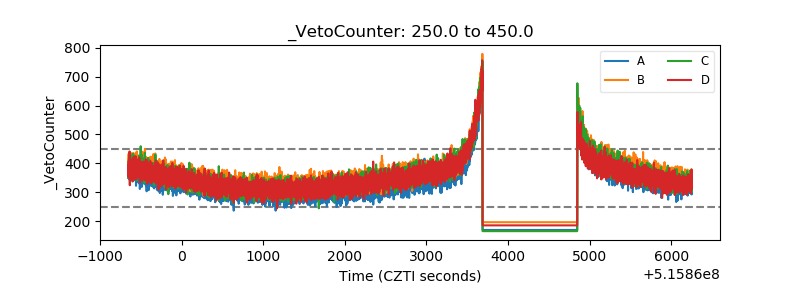 |