| Param | Original file | Final file |
|---|---|---|
| Filename | modeM0/AS1A14_102T01_9000006572_57395cztM0_level2.fits | modeM0/AS1A14_102T01_9000006572_57395cztM0_level2_quad_clean.evt |
| Size (bytes) | 508,518,720 | 91,356,480 |
| Size | 485.0 MB | 87.1 MB |
| Events in quadrant A | 3,048,729 | 639,092 |
| Events in quadrant B | 3,419,085 | 659,141 |
| Events in quadrant C | 8,413,943 | 452,094 |
| Events in quadrant D | 3,441,705 | 566,060 |
| Mode M0 | |||
|---|---|---|---|
| Quadrant | BADHDUFLAG | Total packets | Discarded packets |
| A | 0 | 13738 | 49 |
| B | 0 | 15013 | 56 |
| C | 0 | 29678 | 196 |
| D | 0 | 14839 | 38 |
| Mode M9 | |||
|---|---|---|---|
| Quadrant | BADHDUFLAG | Total packets | Discarded packets |
| A | 0 | 10 | 0 |
| B | 0 | 10 | 0 |
| C | 0 | 11 | 1 |
| D | 0 | 10 | 0 |
| Mode SS | |||
|---|---|---|---|
| Quadrant | BADHDUFLAG | Total packets | Discarded packets |
| A | 0 | 134 | 0 |
| B | 0 | 134 | 0 |
| C | 0 | 134 | 0 |
| D | 0 | 134 | 0 |
| Quadrant | Total seconds | Saturated seconds | Saturation percentage |
|---|---|---|---|
| A | 6442 | 56 | 0.869295% |
| B | 6437 | 237 | 3.681839% |
| C | 6421 | 1815 | 28.266625% |
| D | 6443 | 77 | 1.195095% |
Noise dominated data is calculated using 1-second bins in cleaned event files. If a bin has >2000 counts, and if more than 50% of those come from <1% of pixels, then it is considered to be noise-dominated and hence unusable.
| Quadrant | # 1 sec bins | Bins with >0 counts | Bins with >2000 counts | High rate bins dominated by noise | Noise dominated (total time) | Noise dominated (detector-on time) | Marked lightcurve |
|---|---|---|---|---|---|---|---|
| A | 7514 | 6451 | 24 | 24 | 0.32% | 0.37% | 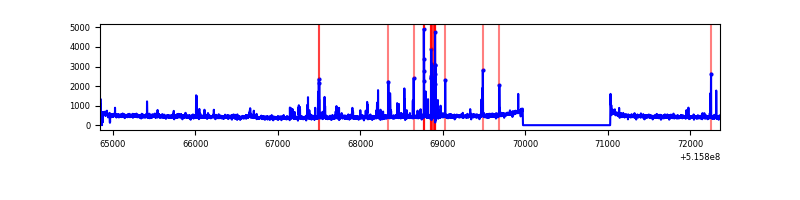 |
| B | 7514 | 6449 | 141 | 141 | 1.88% | 2.19% | 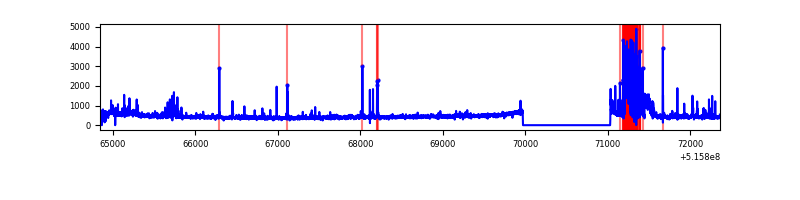 |
| C | 7513 | 6438 | 1385 | 1385 | 18.43% | 21.51% | 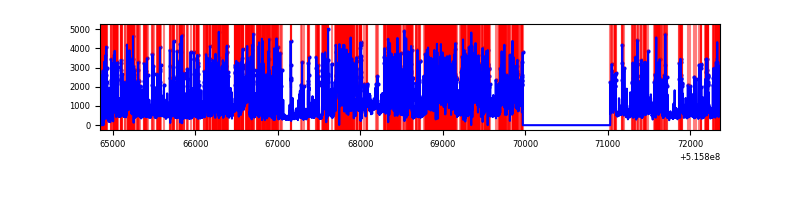 |
| D | 7513 | 6453 | 76 | 76 | 1.01% | 1.18% | 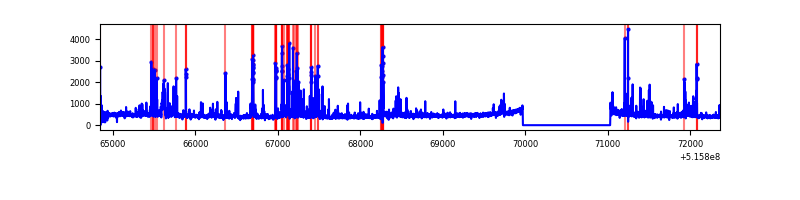 |
Top three noisy pixels from each quadrant. If the there are fewer than three noisy pixels in the level2.evt file, extra rows are filled as -1
| Pixel properties | Quadrant properties | ||||||
|---|---|---|---|---|---|---|---|
| Quadrant | DetID | PixID | Counts | Sigma | Mean | Median | Sigma |
| A | 3 | 61 | 148774 | 861.77 | 704 | 687 | 171.8 |
| A | 0 | 12 | 70822 | 408.14 | 704 | 687 | 171.8 |
| A | 8 | 4 | 37024 | 211.46 | 704 | 687 | 171.8 |
| B | 4 | 171 | 502701 | 3468.59 | 682 | 659 | 144.7 |
| B | 5 | 185 | 49598 | 338.12 | 682 | 659 | 144.7 |
| B | 0 | 63 | 44116 | 300.24 | 682 | 659 | 144.7 |
| C | 15 | 224 | 5163353 | 33015.54 | 575 | 571 | 156.4 |
| C | 12 | 249 | 613442 | 3919.26 | 575 | 571 | 156.4 |
| C | 6 | 223 | 119862 | 762.86 | 575 | 571 | 156.4 |
| D | 8 | 240 | 289308 | 1510.78 | 673 | 643 | 191.1 |
| D | 3 | 224 | 102998 | 535.69 | 673 | 643 | 191.1 |
| D | 15 | 142 | 98019 | 509.63 | 673 | 643 | 191.1 |
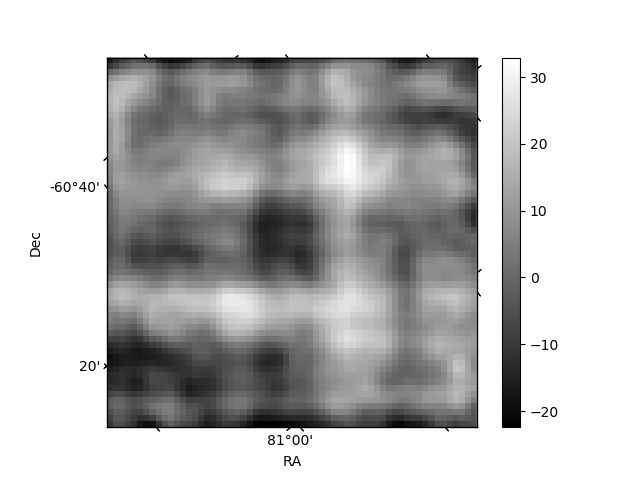
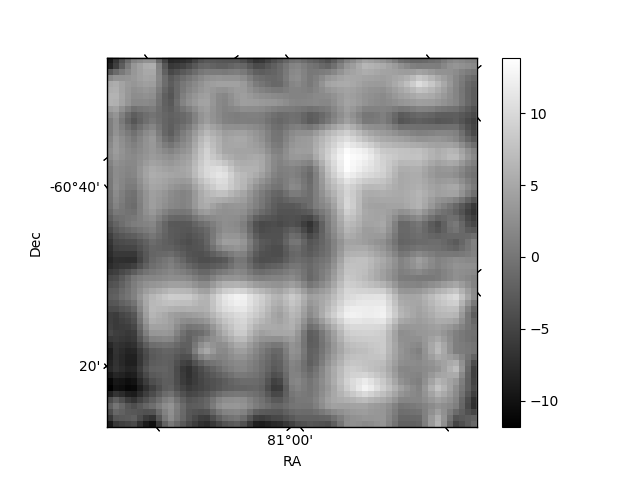
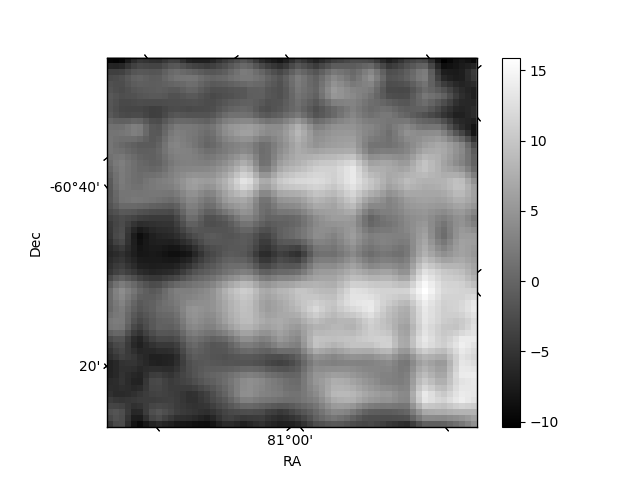
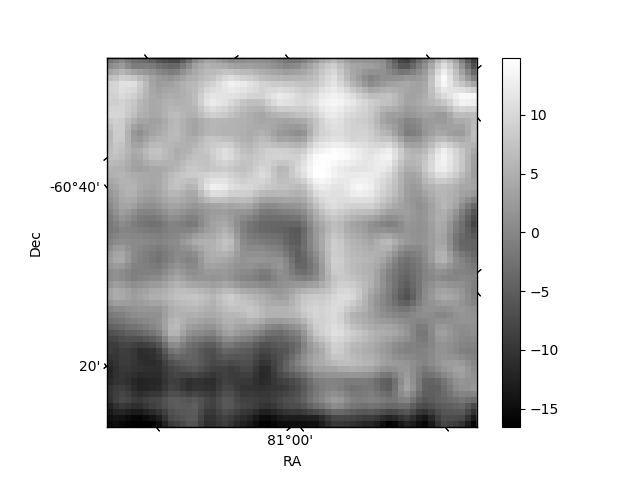
Histogram calculated using DETX and DETY for each event in the final _common_clean file
| Quadrant A | 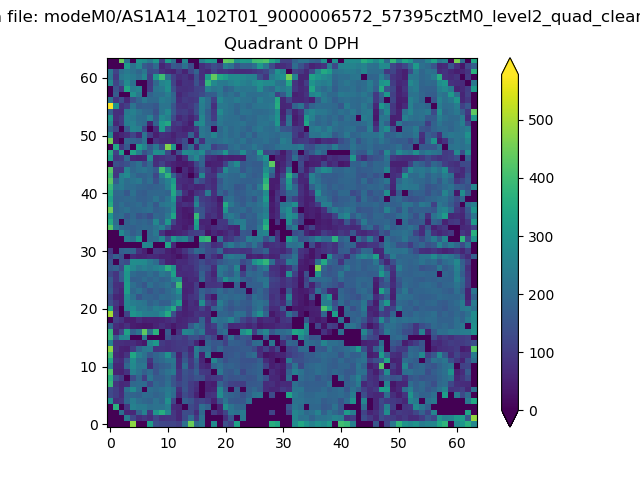 |
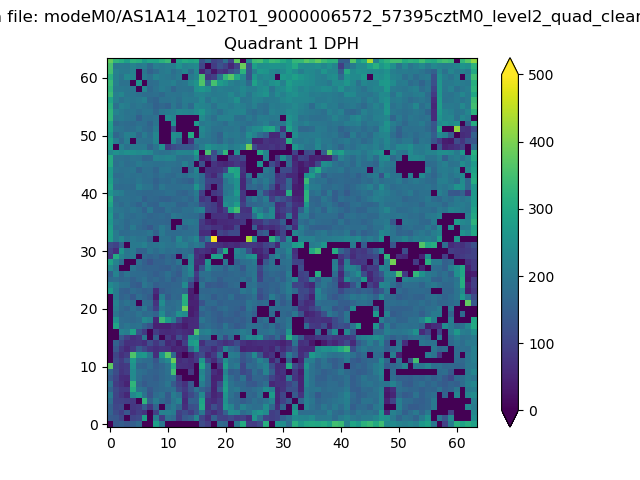 |
Quadrant B |
|---|---|---|---|
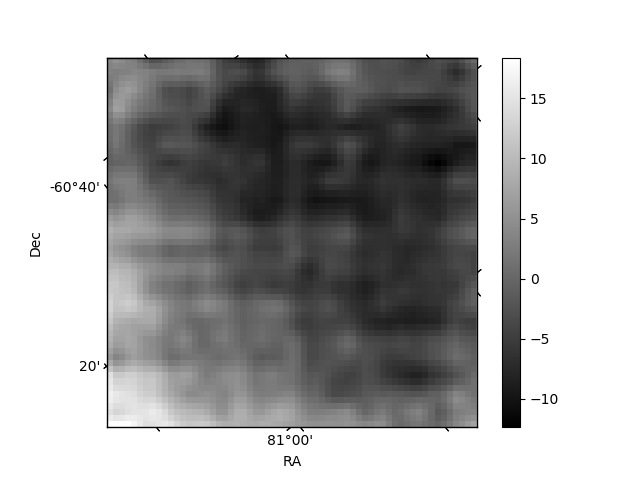
| Quadrant D | 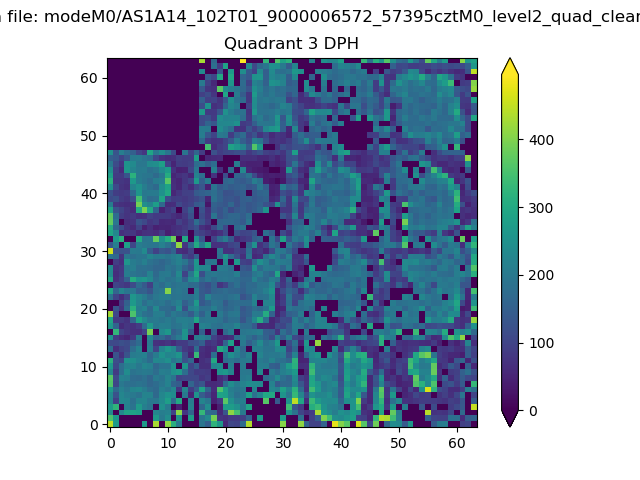 |
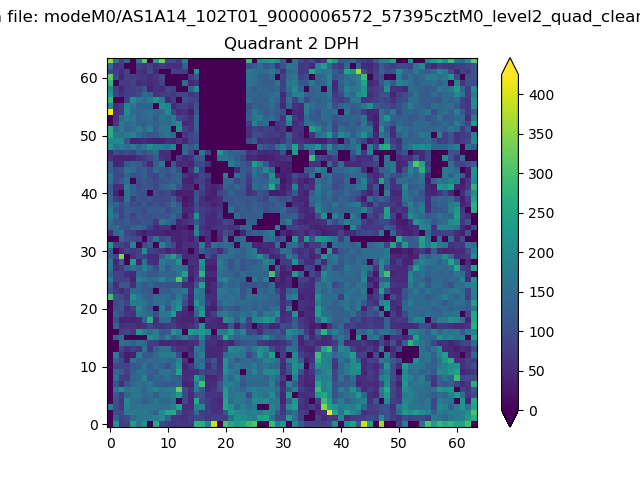 |
Quadrant C |
| Plot type | Count rate plots | Images |
|---|---|---|
| Comparison with Poisson distribution Blue bars denote a histogram of data divided into 1 sec bins. Red curve is a Poisson curve with rate = median count rate of data. |
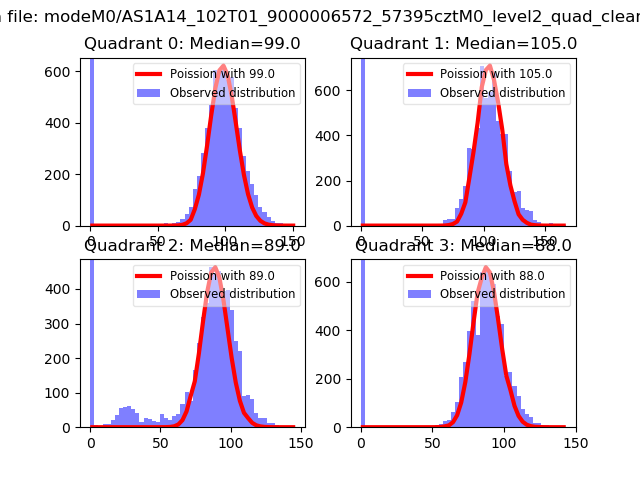 |
 |
| Quadrant-wise count rates Data is divided into 100 sec bins |
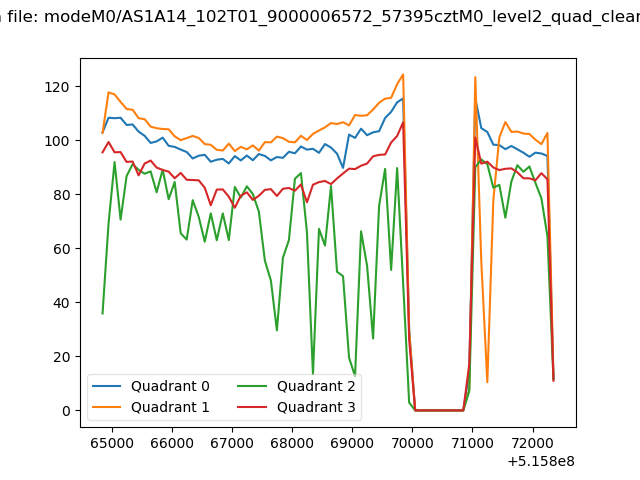 |
|
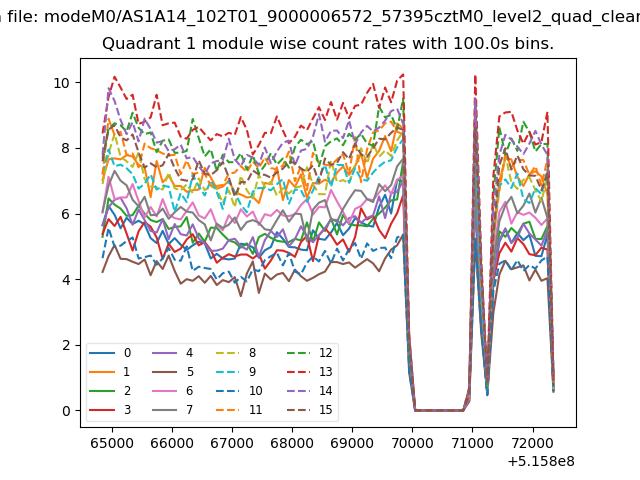
| Module-wise count rates for Quadrant A Data is divided into 100 sec bins |
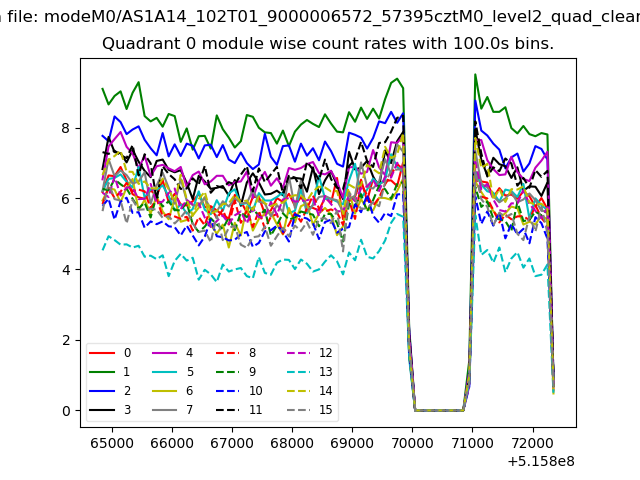 |
 |
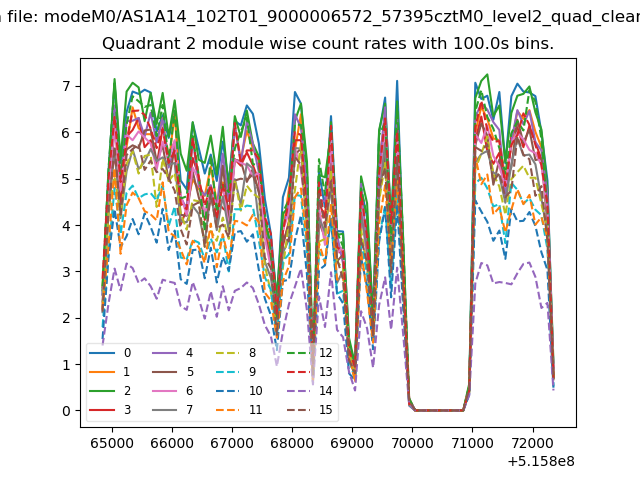
| Module-wise count rates for Quadrant B Data is divided into 100 sec bins |
 |
 |
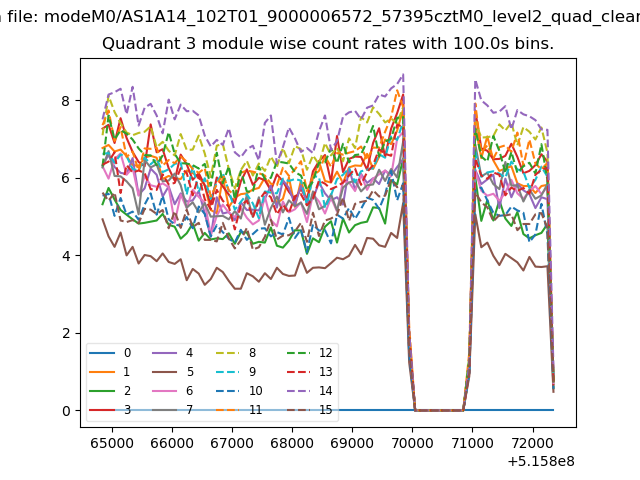
| Module-wise count rates for Quadrant C Data is divided into 100 sec bins |
 |
 |
| Module-wise count rates for Quadrant D Data is divided into 100 sec bins |
 |
 |
| Parameter | Plot |
|---|---|
| CZT HV Monitor | 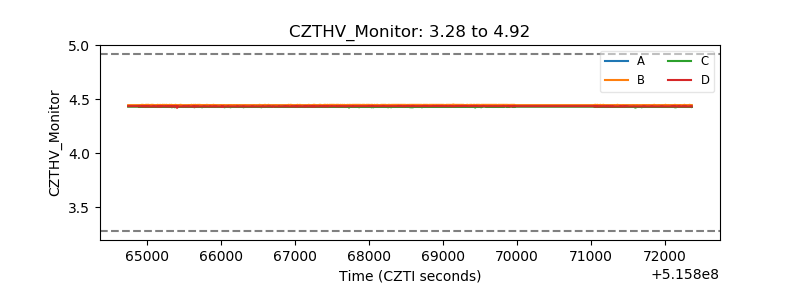 |
| D_VDD | 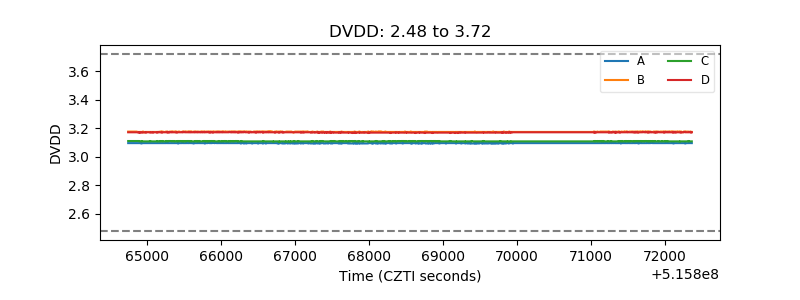 |
| Temperature 1 | 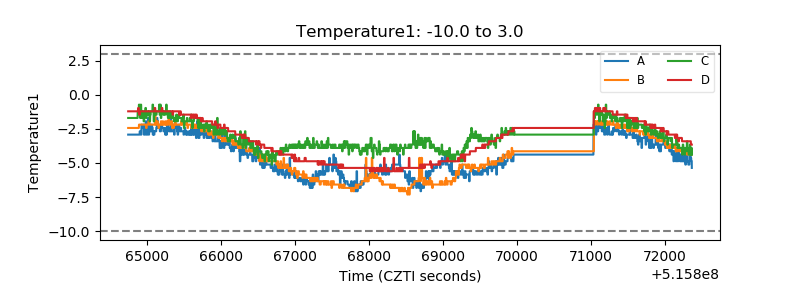 |
| Veto HV Monitor | 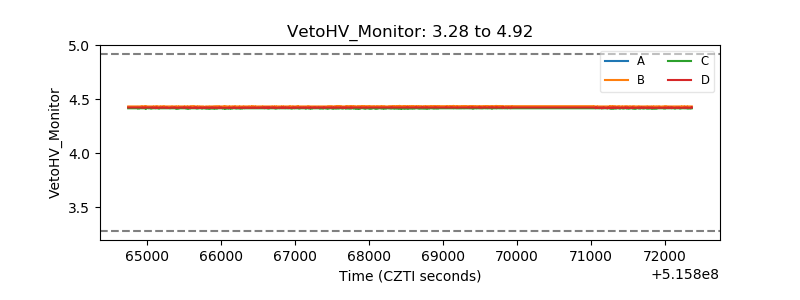 |
| Veto LLD | 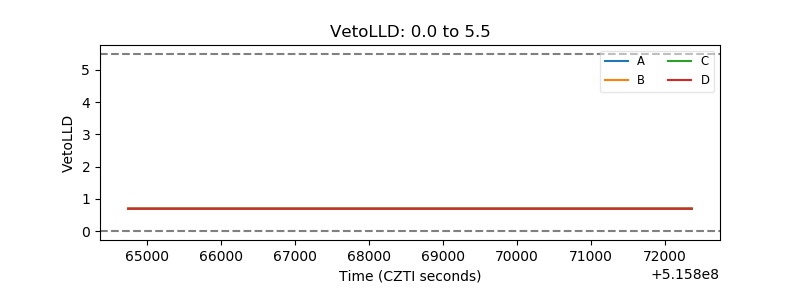 |
| Alpha Counter | 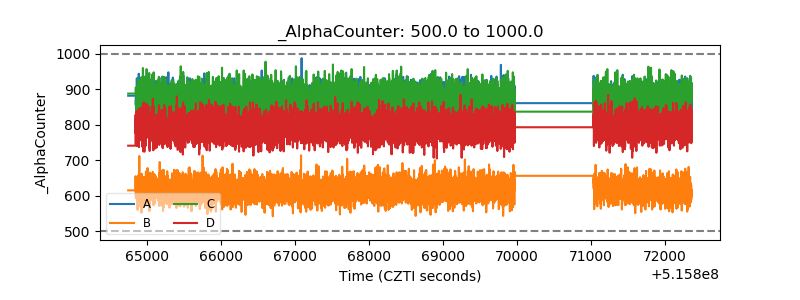 |
| _CPM_Rate | 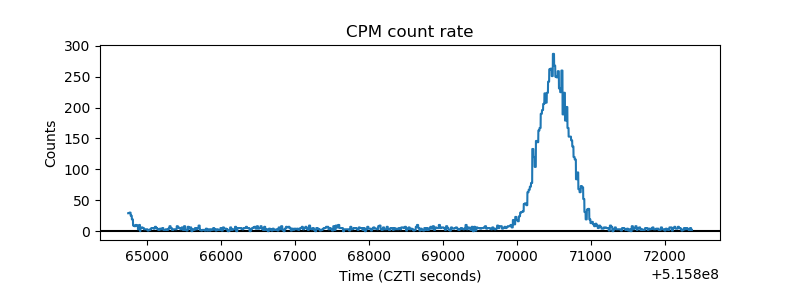 |
| CZT Counter | 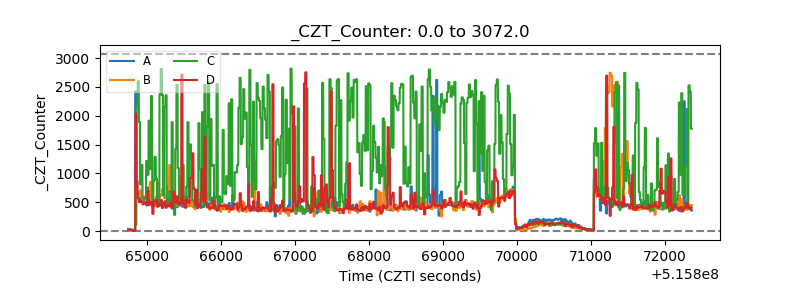 |
| +2.5 Volts monitor | 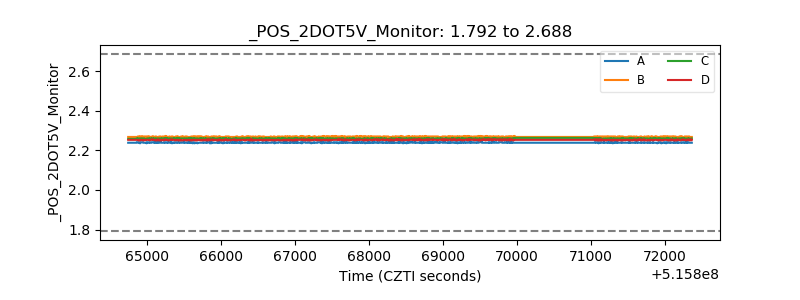 |
| +5 Volts monitor | 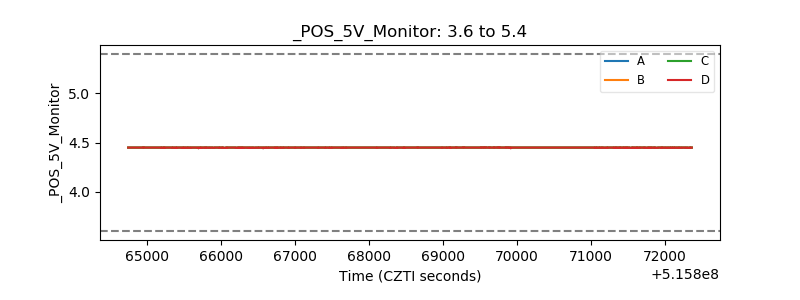 |
| _ROLL_ROT | 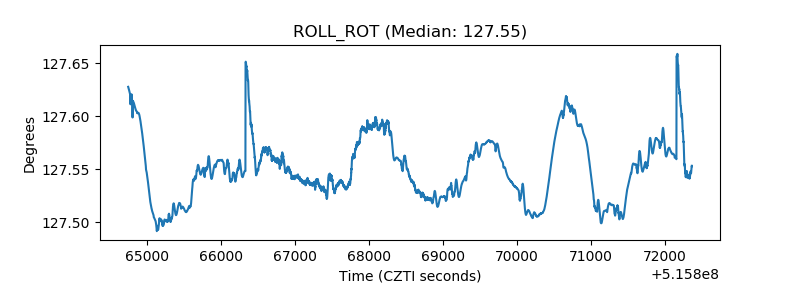 |
| _Roll_DEC | 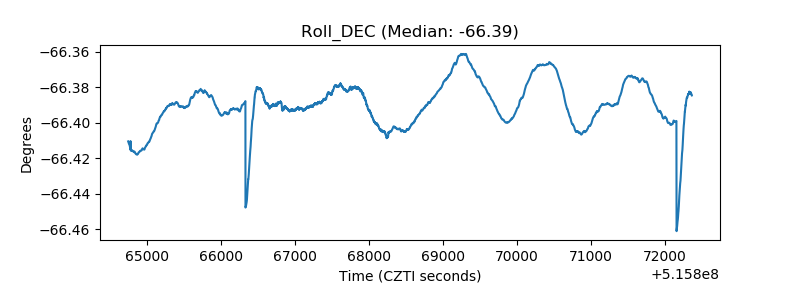 |
| _Roll_RA | 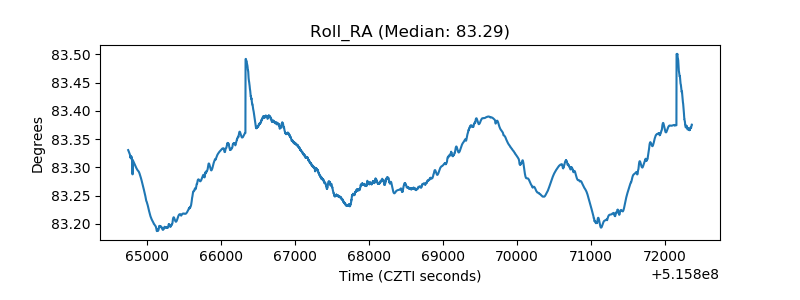 |
| Veto Counter | 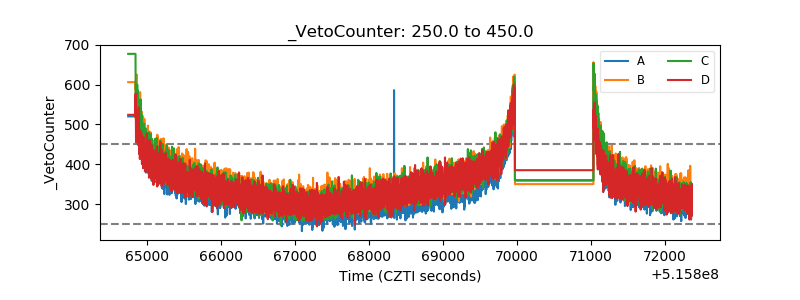 |