| Param | Original file | Final file |
|---|---|---|
| Filename | modeM0/AS1A14_102T01_9000006572_57396cztM0_level2.fits | modeM0/AS1A14_102T01_9000006572_57396cztM0_level2_quad_clean.evt |
| Size (bytes) | 498,896,640 | 83,111,040 |
| Size | 475.8 MB | 79.3 MB |
| Events in quadrant A | 3,092,843 | 564,560 |
| Events in quadrant B | 3,184,809 | 582,972 |
| Events in quadrant C | 8,247,180 | 427,252 |
| Events in quadrant D | 3,430,891 | 482,099 |
| Mode M0 | |||
|---|---|---|---|
| Quadrant | BADHDUFLAG | Total packets | Discarded packets |
| A | 0 | 14522 | 433 |
| B | 0 | 15594 | 1297 |
| C | 0 | 29899 | 835 |
| D | 0 | 15515 | 532 |
| Mode M9 | |||
|---|---|---|---|
| Quadrant | BADHDUFLAG | Total packets | Discarded packets |
| A | 0 | 8 | 0 |
| B | 0 | 8 | 0 |
| C | 0 | 8 | 0 |
| D | 0 | 8 | 0 |
| Mode SS | |||
|---|---|---|---|
| Quadrant | BADHDUFLAG | Total packets | Discarded packets |
| A | 0 | 138 | 4 |
| B | 0 | 138 | 2 |
| C | 0 | 138 | 2 |
| D | 0 | 138 | 0 |
| Quadrant | Total seconds | Saturated seconds | Saturation percentage |
|---|---|---|---|
| A | 6601 | 82 | 1.242236% |
| B | 6543 | 111 | 1.696470% |
| C | 6573 | 1700 | 25.863380% |
| D | 6595 | 95 | 1.440485% |
Noise dominated data is calculated using 1-second bins in cleaned event files. If a bin has >2000 counts, and if more than 50% of those come from <1% of pixels, then it is considered to be noise-dominated and hence unusable.
| Quadrant | # 1 sec bins | Bins with >0 counts | Bins with >2000 counts | High rate bins dominated by noise | Noise dominated (total time) | Noise dominated (detector-on time) | Marked lightcurve |
|---|---|---|---|---|---|---|---|
| A | 7813 | 6925 | 49 | 49 | 0.63% | 0.71% | 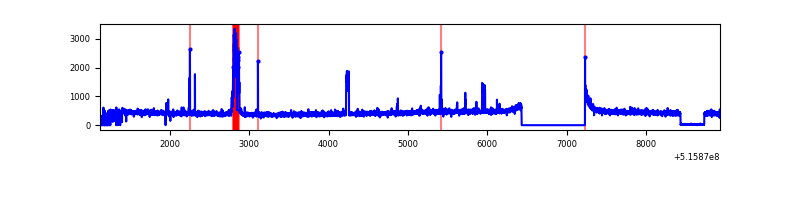 |
| B | 7785 | 6859 | 47 | 47 | 0.60% | 0.69% | 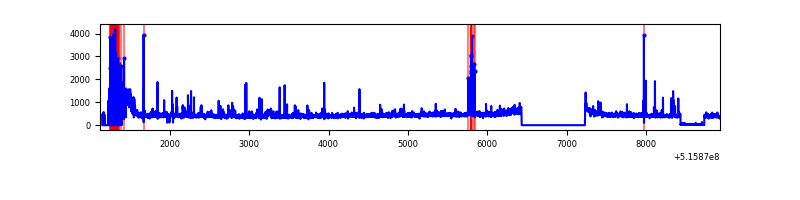 |
| C | 7785 | 6884 | 1308 | 1308 | 16.80% | 19.00% | 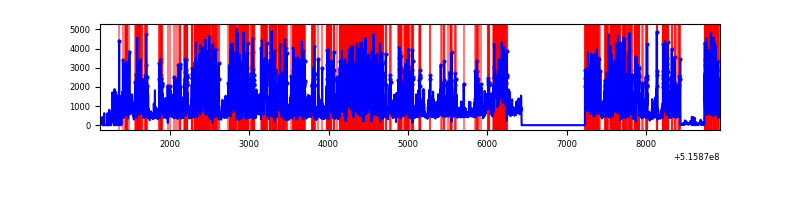 |
| D | 7811 | 6924 | 62 | 62 | 0.79% | 0.90% | 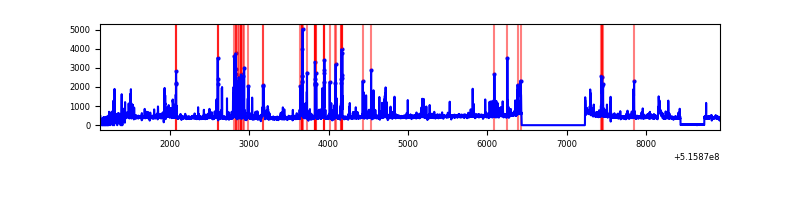 |
Top three noisy pixels from each quadrant. If the there are fewer than three noisy pixels in the level2.evt file, extra rows are filled as -1
| Pixel properties | Quadrant properties | ||||||
|---|---|---|---|---|---|---|---|
| Quadrant | DetID | PixID | Counts | Sigma | Mean | Median | Sigma |
| A | 5 | 242 | 159761 | 925.82 | 702 | 684 | 171.8 |
| A | 0 | 12 | 84114 | 485.56 | 702 | 684 | 171.8 |
| A | 3 | 14 | 83802 | 483.74 | 702 | 684 | 171.8 |
| B | 4 | 171 | 258857 | 1762.27 | 682 | 658 | 146.5 |
| B | 10 | 247 | 86479 | 585.75 | 682 | 658 | 146.5 |
| B | 0 | 245 | 43844 | 294.76 | 682 | 658 | 146.5 |
| C | 15 | 224 | 4818022 | 29887.85 | 593 | 590 | 161.2 |
| C | 12 | 249 | 364277 | 2256.35 | 593 | 590 | 161.2 |
| C | 14 | 254 | 206223 | 1275.77 | 593 | 590 | 161.2 |
| D | 3 | 12 | 313619 | 1653.1 | 668 | 636 | 189.3 |
| D | 8 | 240 | 245838 | 1295.1 | 668 | 636 | 189.3 |
| D | 3 | 224 | 68213 | 356.93 | 668 | 636 | 189.3 |
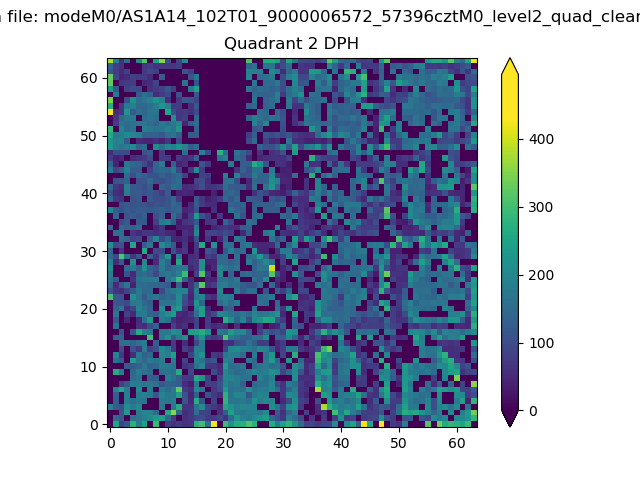
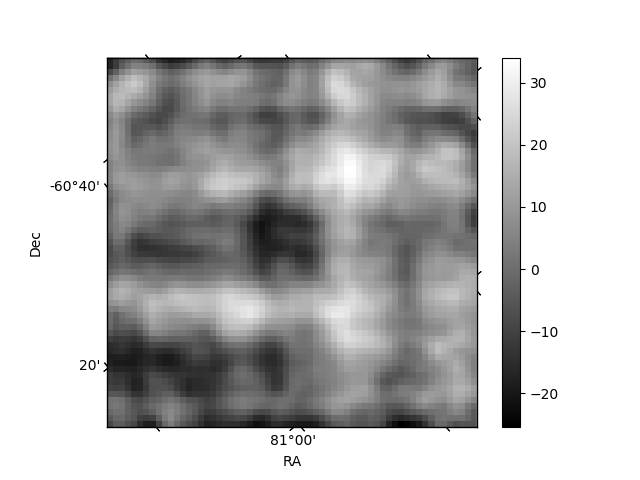
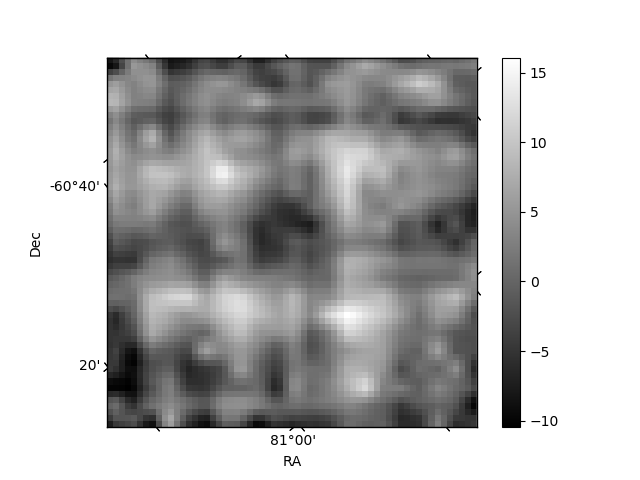
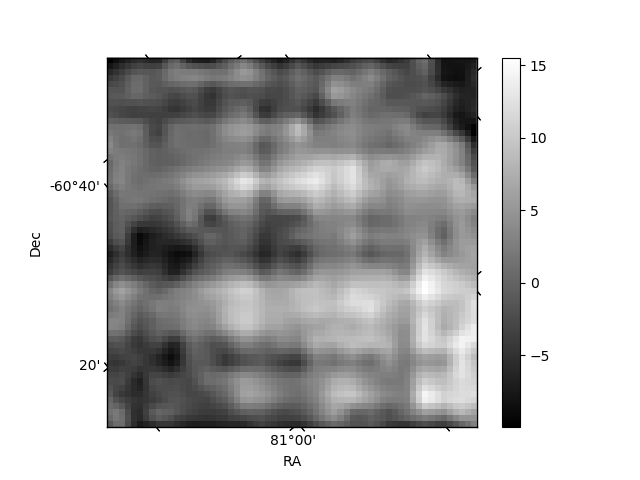
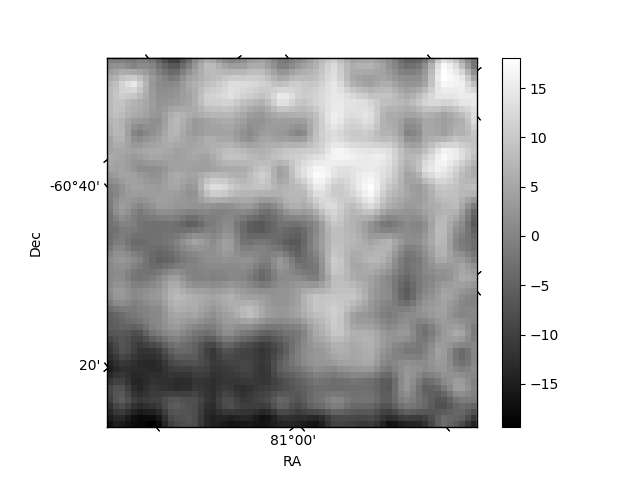
Histogram calculated using DETX and DETY for each event in the final _common_clean file
| Quadrant A | 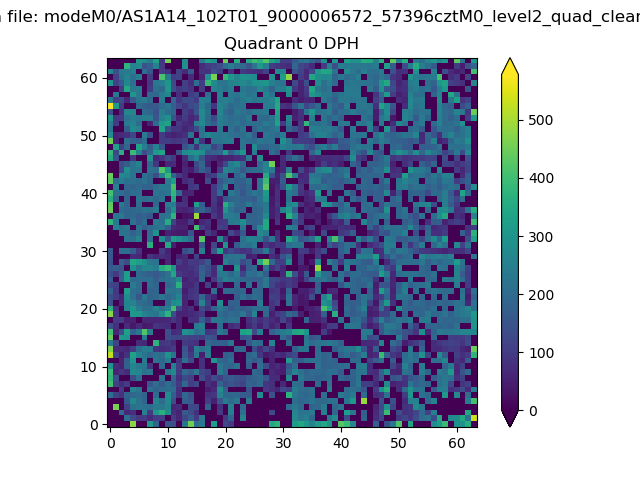 |
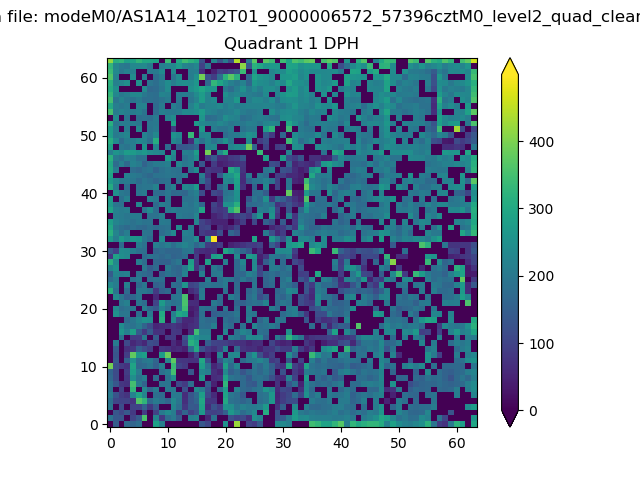 |
Quadrant B |
|---|---|---|---|
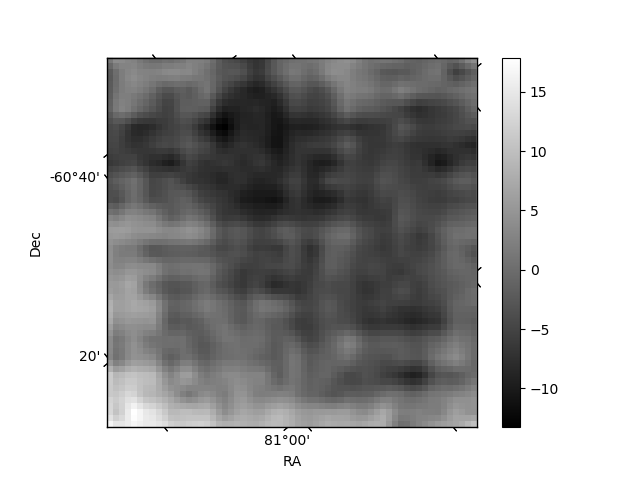
| Quadrant D | 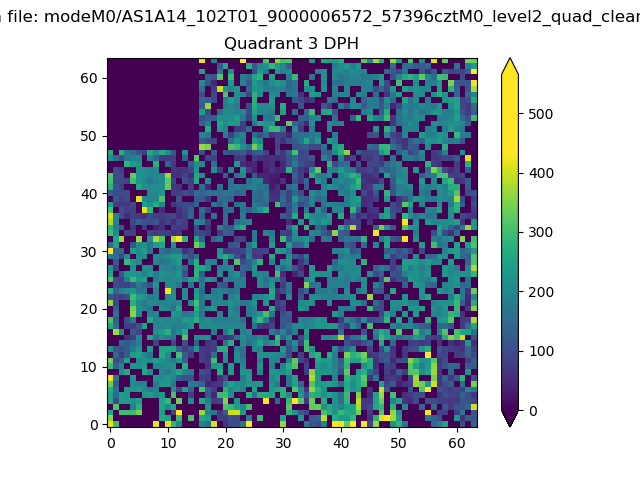 |
 |
Quadrant C |
| Plot type | Count rate plots | Images |
|---|---|---|
| Comparison with Poisson distribution Blue bars denote a histogram of data divided into 1 sec bins. Red curve is a Poisson curve with rate = median count rate of data. |
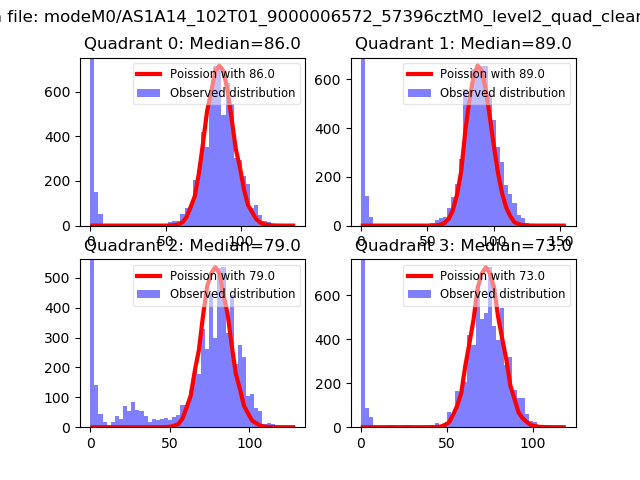 |
 |
| Quadrant-wise count rates Data is divided into 100 sec bins |
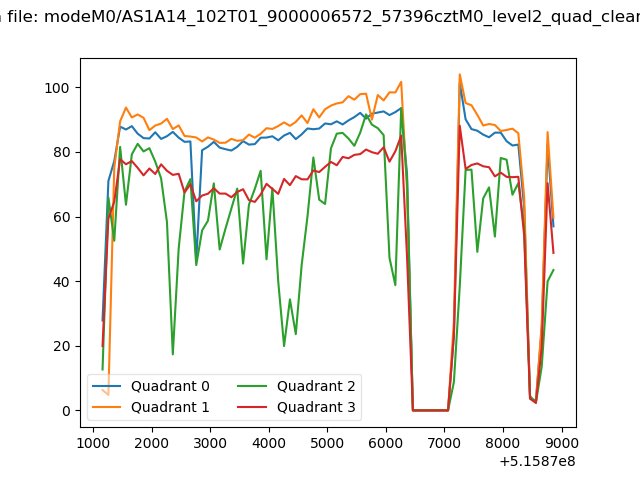 |
|
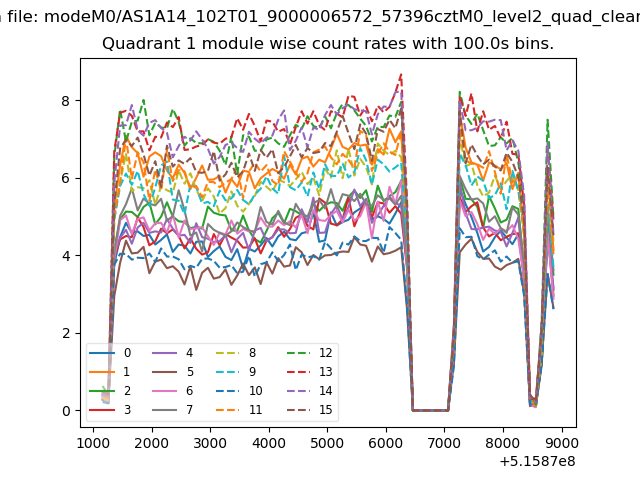
| Module-wise count rates for Quadrant A Data is divided into 100 sec bins |
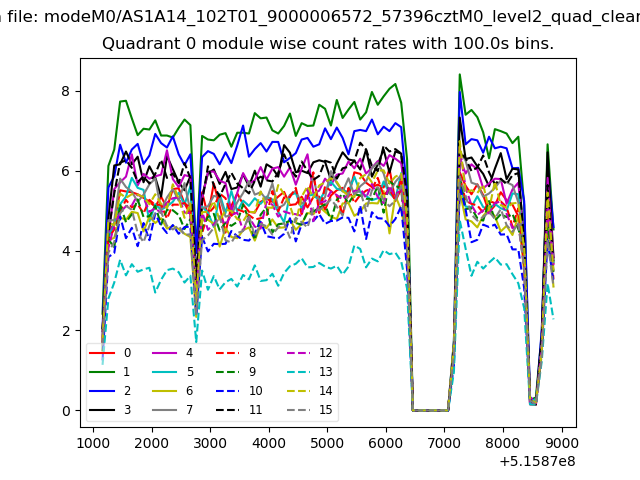 |
 |
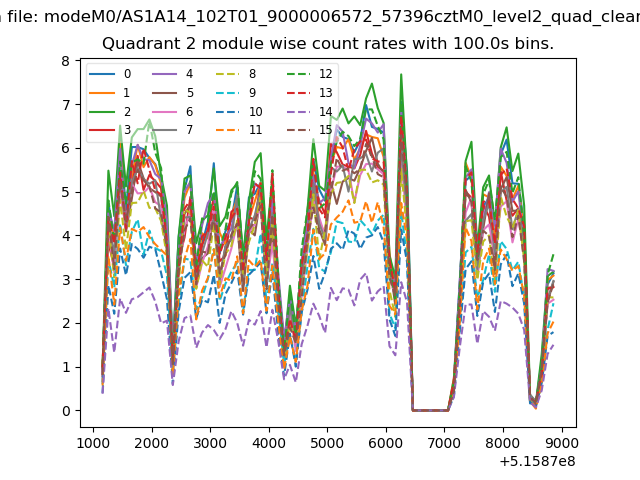
| Module-wise count rates for Quadrant B Data is divided into 100 sec bins |
 |
 |
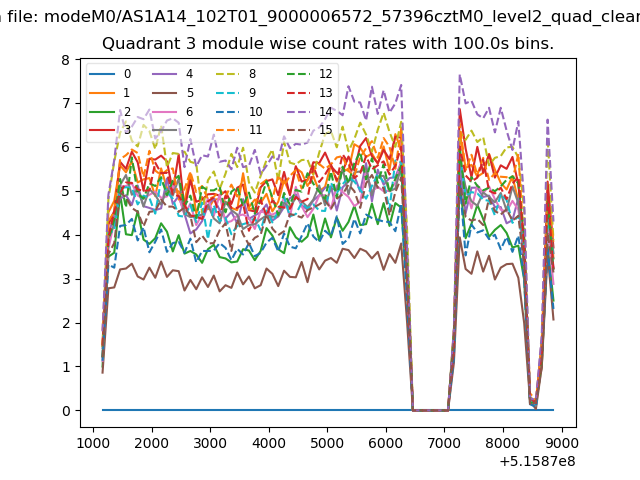
| Module-wise count rates for Quadrant C Data is divided into 100 sec bins |
 |
 |
| Module-wise count rates for Quadrant D Data is divided into 100 sec bins |
 |
 |
| Parameter | Plot |
|---|---|
| CZT HV Monitor | 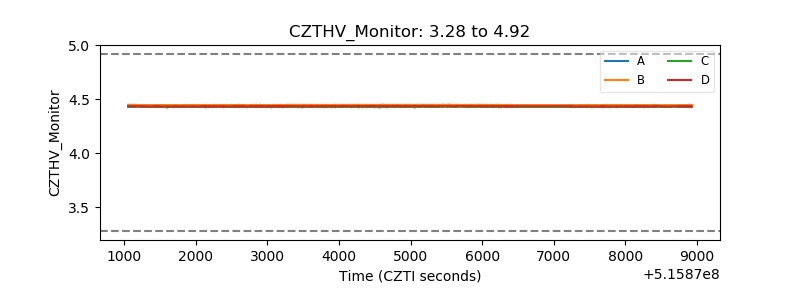 |
| D_VDD | 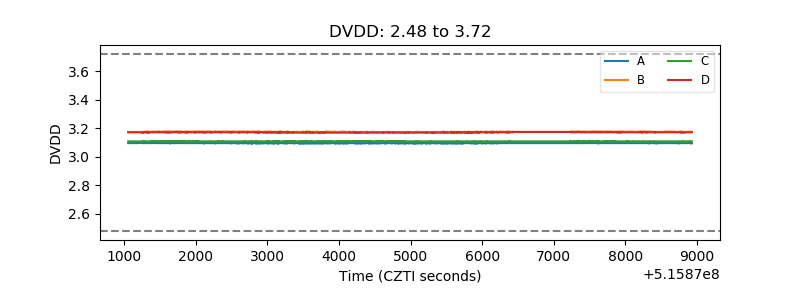 |
| Temperature 1 | 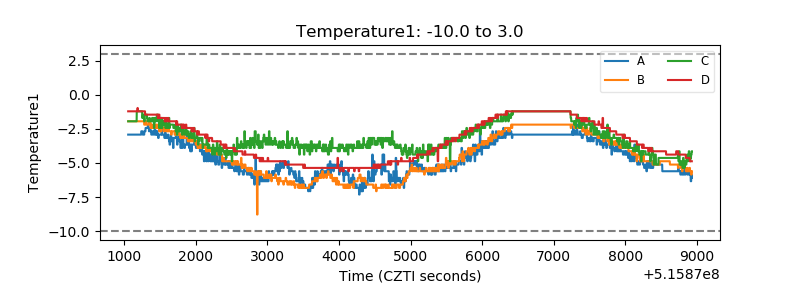 |
| Veto HV Monitor | 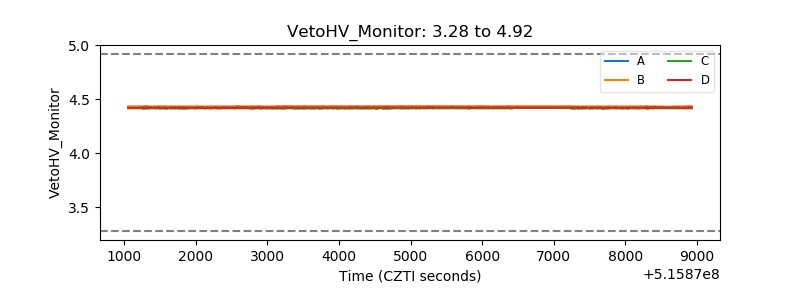 |
| Veto LLD | 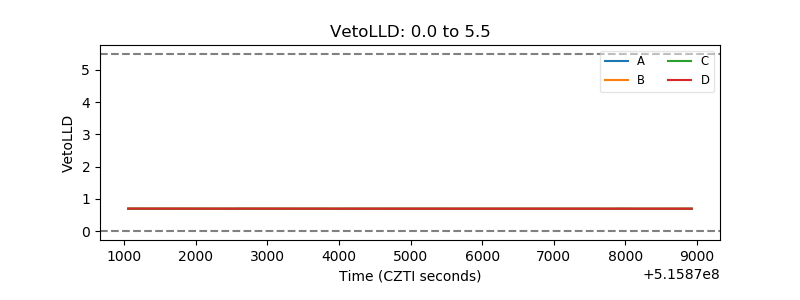 |
| Alpha Counter | 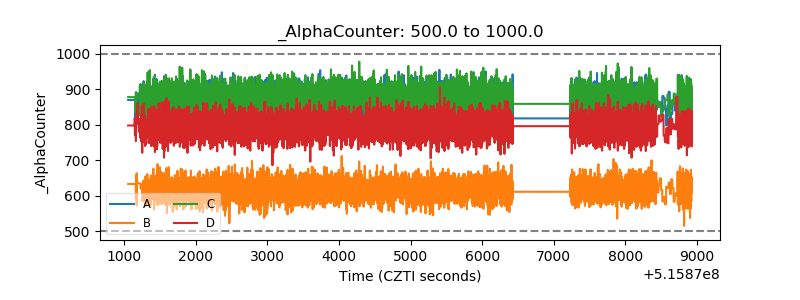 |
| _CPM_Rate | 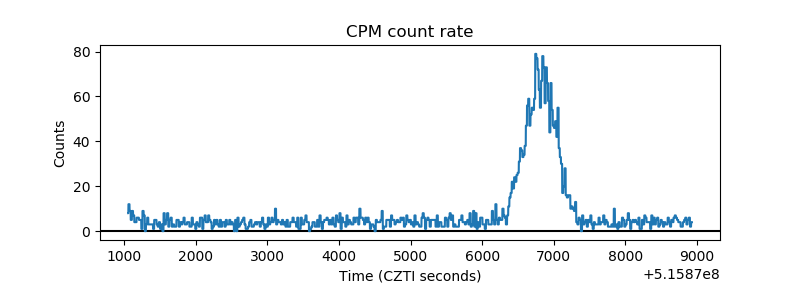 |
| CZT Counter | 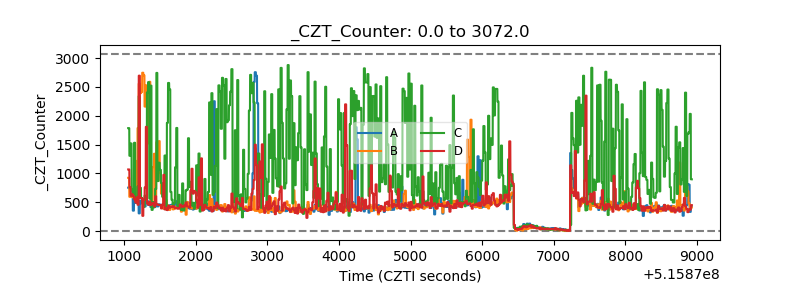 |
| +2.5 Volts monitor | 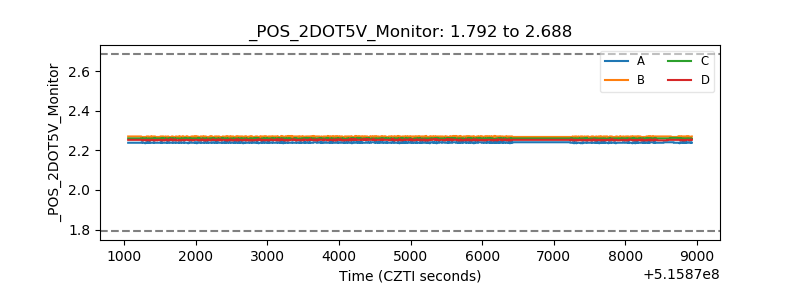 |
| +5 Volts monitor | 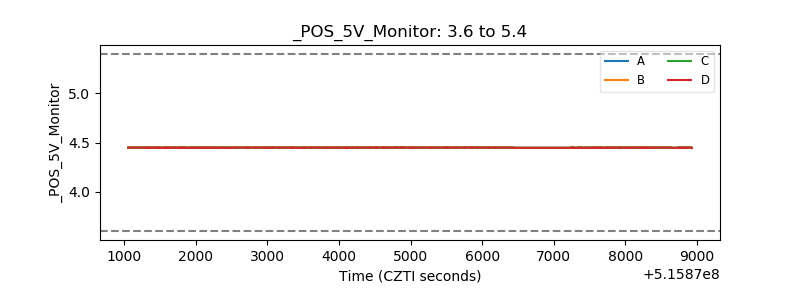 |
| _ROLL_ROT | 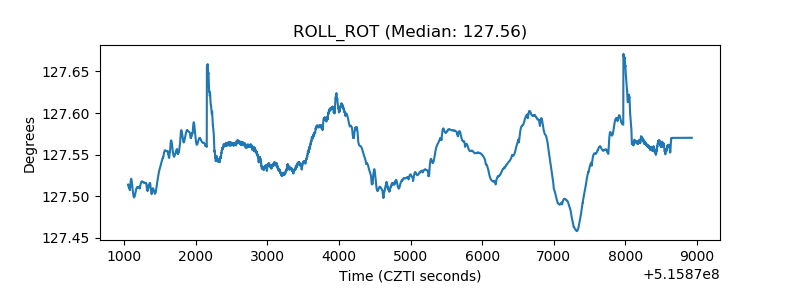 |
| _Roll_DEC | 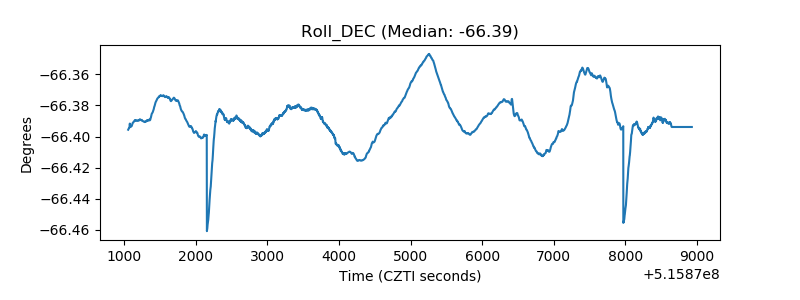 |
| _Roll_RA | 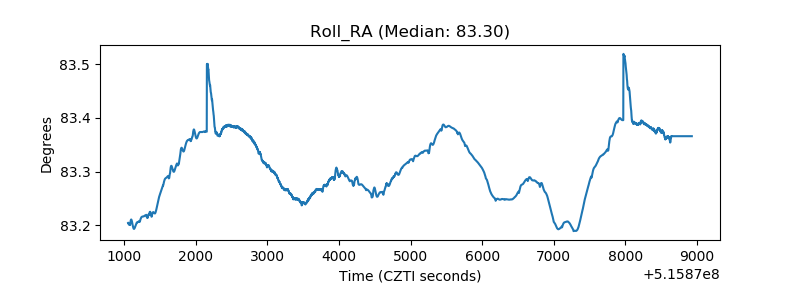 |
| Veto Counter | 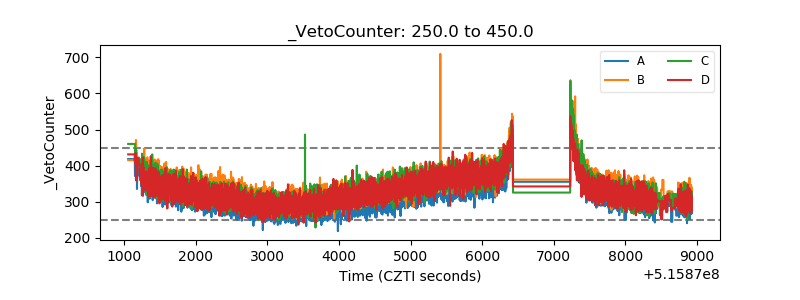 |