| Param | Original file | Final file |
|---|---|---|
| Filename | modeM0/AS1A14_102T01_9000006572_57397cztM0_level2.fits | modeM0/AS1A14_102T01_9000006572_57397cztM0_level2_quad_clean.evt |
| Size (bytes) | 567,305,280 | 92,039,040 |
| Size | 541.0 MB | 87.8 MB |
| Events in quadrant A | 3,493,426 | 620,278 |
| Events in quadrant B | 3,662,515 | 646,145 |
| Events in quadrant C | 9,102,592 | 467,553 |
| Events in quadrant D | 4,161,368 | 532,807 |
| Mode M0 | |||
|---|---|---|---|
| Quadrant | BADHDUFLAG | Total packets | Discarded packets |
| A | 0 | 15863 | 2 |
| B | 0 | 16387 | 2 |
| C | 0 | 32243 | 2 |
| D | 0 | 17872 | 2 |
| Mode M9 | |||
|---|---|---|---|
| Quadrant | BADHDUFLAG | Total packets | Discarded packets |
| A | 0 | 6 | 0 |
| B | 0 | 7 | 0 |
| C | 0 | 7 | 0 |
| D | 0 | 7 | 0 |
| Mode SS | |||
|---|---|---|---|
| Quadrant | BADHDUFLAG | Total packets | Discarded packets |
| A | 0 | 152 | 0 |
| B | 0 | 152 | 0 |
| C | 0 | 152 | 0 |
| D | 0 | 152 | 0 |
| Quadrant | Total seconds | Saturated seconds | Saturation percentage |
|---|---|---|---|
| A | 7463 | 116 | 1.554335% |
| B | 7463 | 181 | 2.425298% |
| C | 7463 | 1834 | 24.574568% |
| D | 7462 | 208 | 2.787456% |
Noise dominated data is calculated using 1-second bins in cleaned event files. If a bin has >2000 counts, and if more than 50% of those come from <1% of pixels, then it is considered to be noise-dominated and hence unusable.
| Quadrant | # 1 sec bins | Bins with >0 counts | Bins with >2000 counts | High rate bins dominated by noise | Noise dominated (total time) | Noise dominated (detector-on time) | Marked lightcurve |
|---|---|---|---|---|---|---|---|
| A | 7986 | 7742 | 24 | 24 | 0.30% | 0.31% | 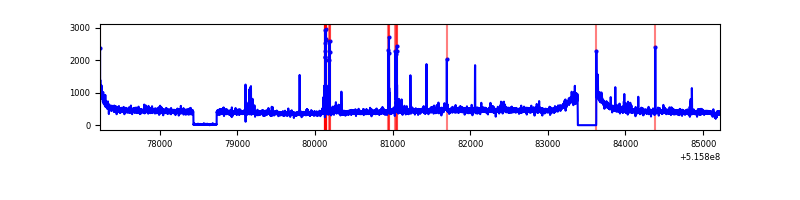 |
| B | 7986 | 7742 | 26 | 26 | 0.33% | 0.34% | 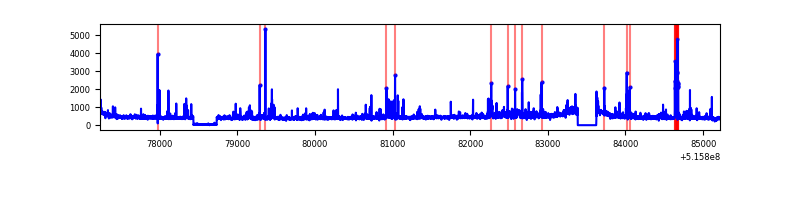 |
| C | 7986 | 7732 | 1343 | 1343 | 16.82% | 17.37% | 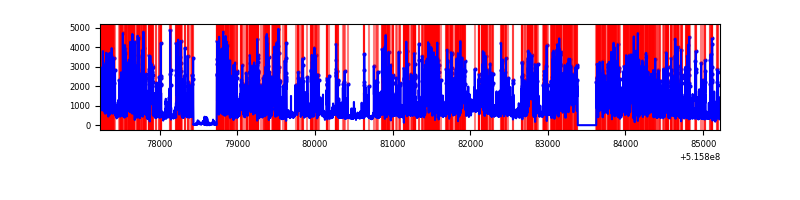 |
| D | 7985 | 7741 | 131 | 131 | 1.64% | 1.69% | 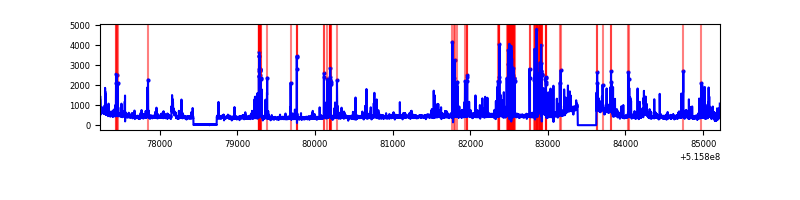 |
Top three noisy pixels from each quadrant. If the there are fewer than three noisy pixels in the level2.evt file, extra rows are filled as -1
| Pixel properties | Quadrant properties | ||||||
|---|---|---|---|---|---|---|---|
| Quadrant | DetID | PixID | Counts | Sigma | Mean | Median | Sigma |
| A | 3 | 14 | 96484 | 478.91 | 816 | 795 | 199.8 |
| A | 3 | 61 | 95377 | 473.37 | 816 | 795 | 199.8 |
| A | 0 | 12 | 76288 | 377.83 | 816 | 795 | 199.8 |
| B | 7 | 252 | 107818 | 616.74 | 802 | 774 | 173.6 |
| B | 5 | 185 | 96813 | 553.33 | 802 | 774 | 173.6 |
| B | 0 | 245 | 96167 | 549.61 | 802 | 774 | 173.6 |
| C | 15 | 224 | 5061096 | 26692.43 | 692 | 684 | 189.6 |
| C | 13 | 3 | 314477 | 1655.18 | 692 | 684 | 189.6 |
| C | 12 | 249 | 278613 | 1466.01 | 692 | 684 | 189.6 |
| D | 8 | 240 | 551691 | 2548.78 | 773 | 740 | 216.2 |
| D | 3 | 12 | 247157 | 1139.96 | 773 | 740 | 216.2 |
| D | 3 | 224 | 63826 | 291.85 | 773 | 740 | 216.2 |
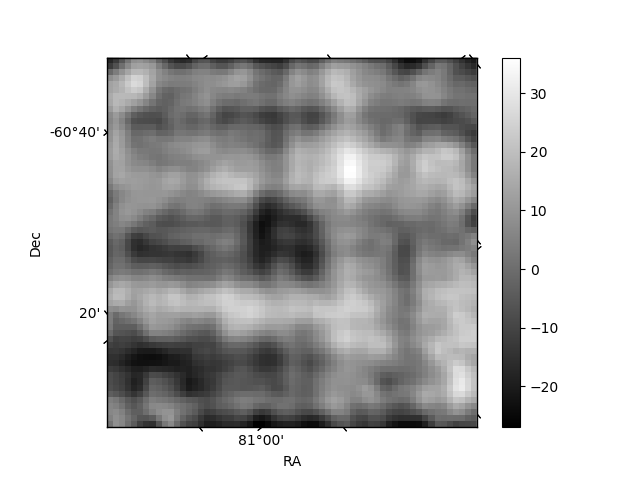
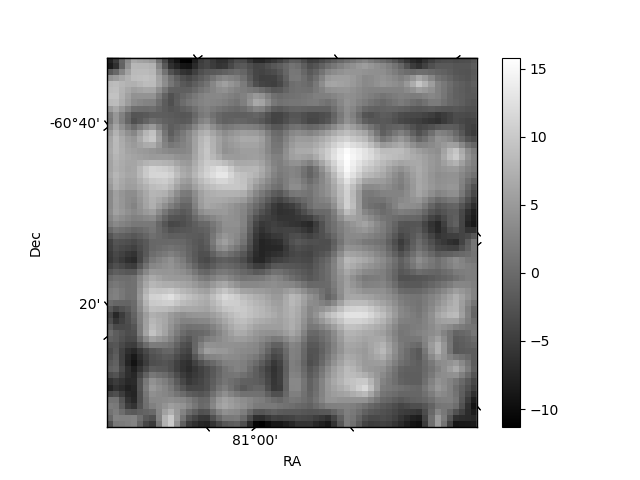
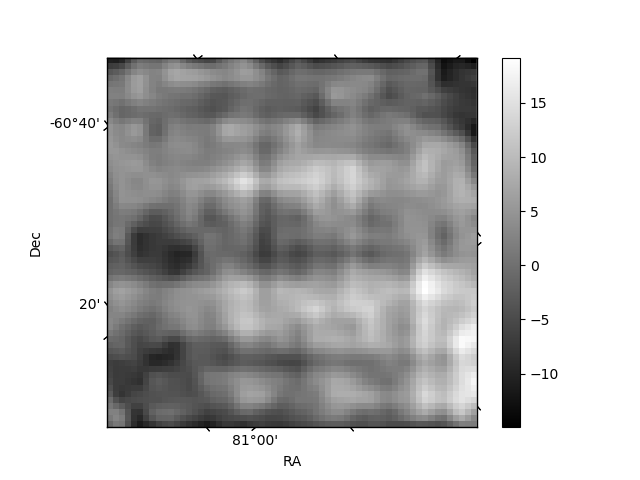
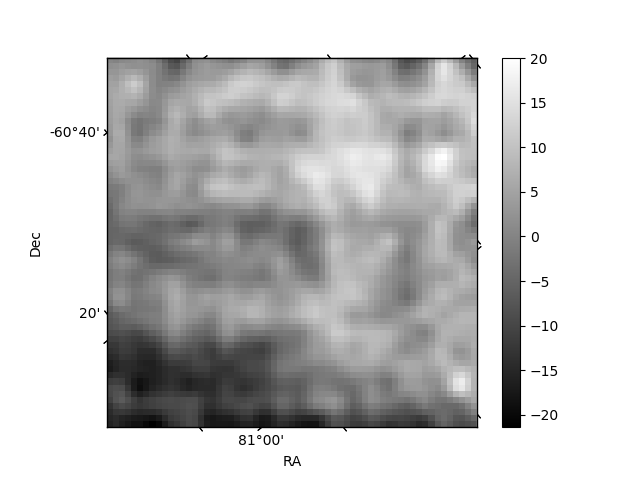
Histogram calculated using DETX and DETY for each event in the final _common_clean file
| Quadrant A | 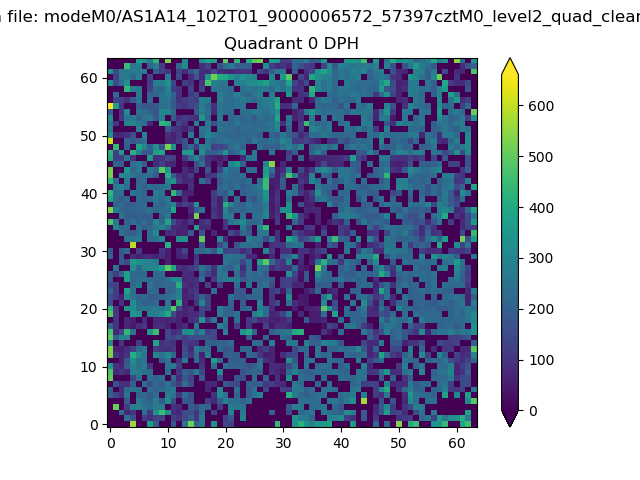 |
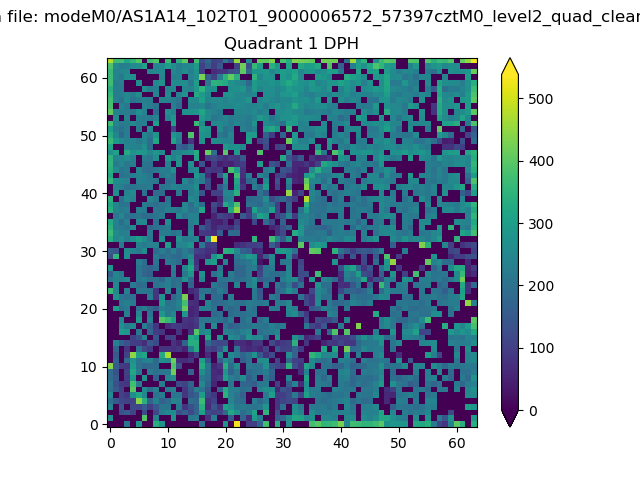 |
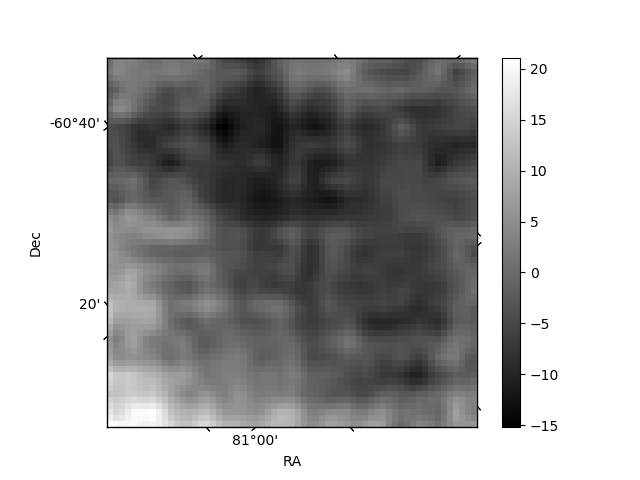
Quadrant B |
|---|---|---|---|
| Quadrant D | 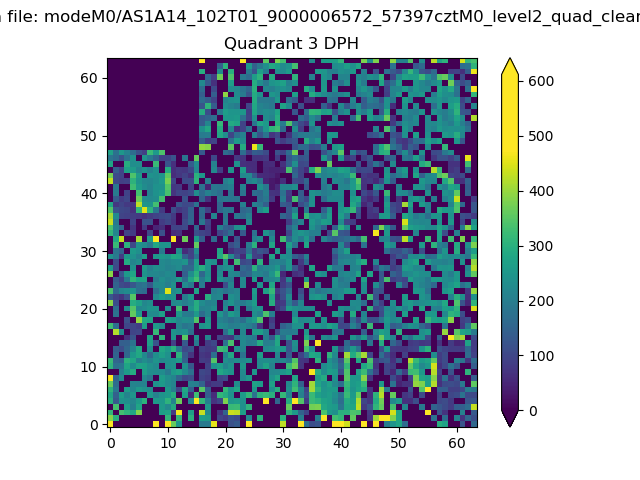 |
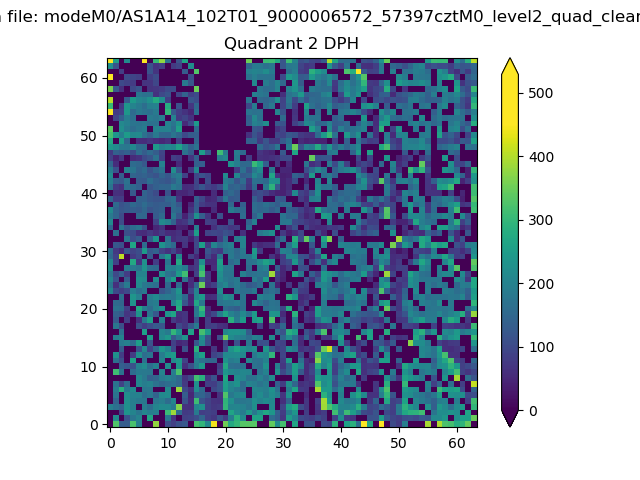 |
Quadrant C |
| Plot type | Count rate plots | Images |
|---|---|---|
| Comparison with Poisson distribution Blue bars denote a histogram of data divided into 1 sec bins. Red curve is a Poisson curve with rate = median count rate of data. |
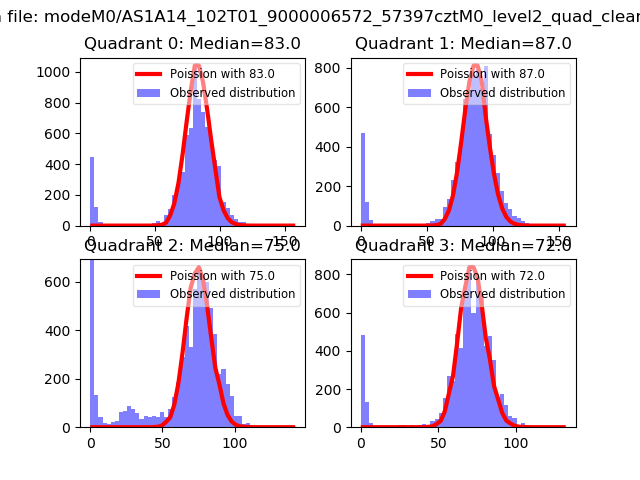 |
 |
| Quadrant-wise count rates Data is divided into 100 sec bins |
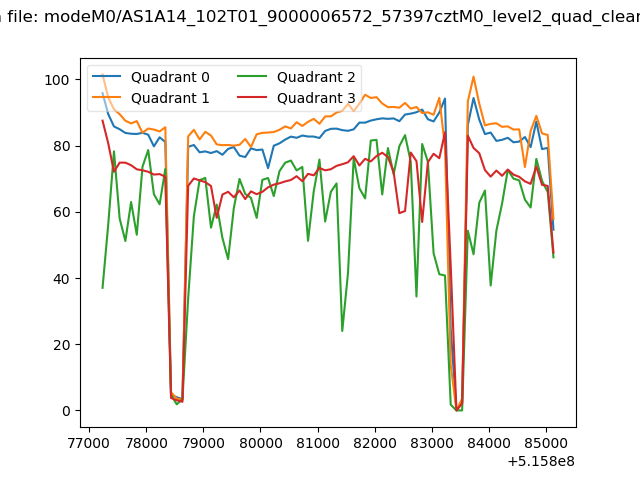 |
|
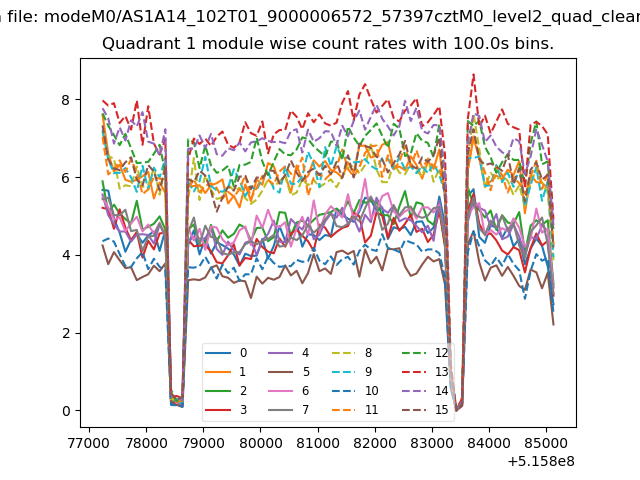
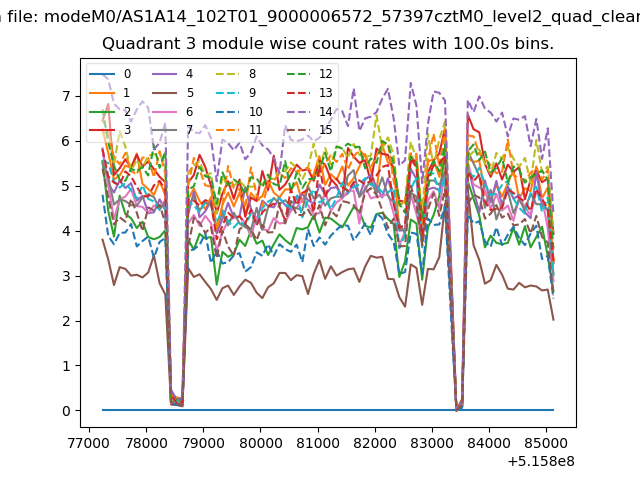
| Module-wise count rates for Quadrant A Data is divided into 100 sec bins |
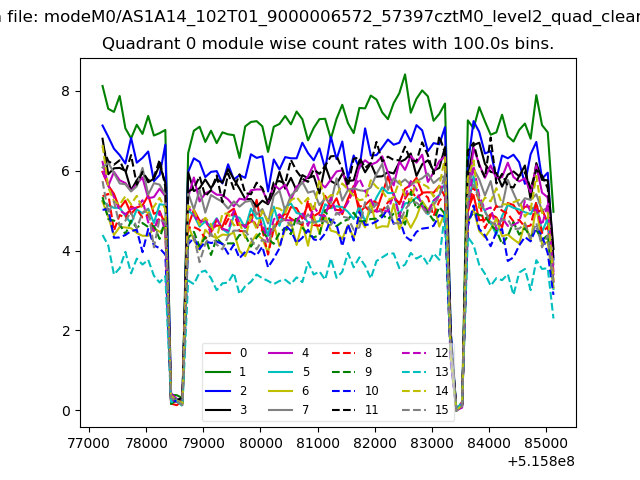 |
 |
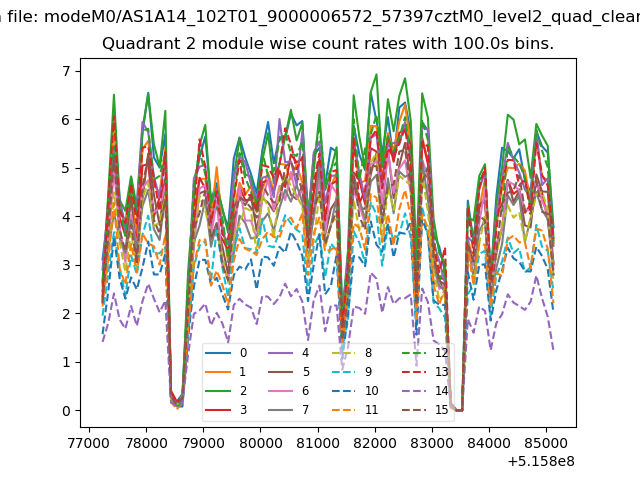
| Module-wise count rates for Quadrant B Data is divided into 100 sec bins |
 |
 |
| Module-wise count rates for Quadrant C Data is divided into 100 sec bins |
 |
 |
| Module-wise count rates for Quadrant D Data is divided into 100 sec bins |
 |
 |
| Parameter | Plot |
|---|---|
| CZT HV Monitor | 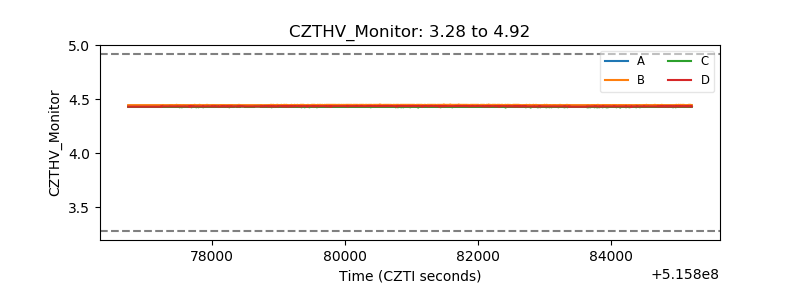 |
| D_VDD | 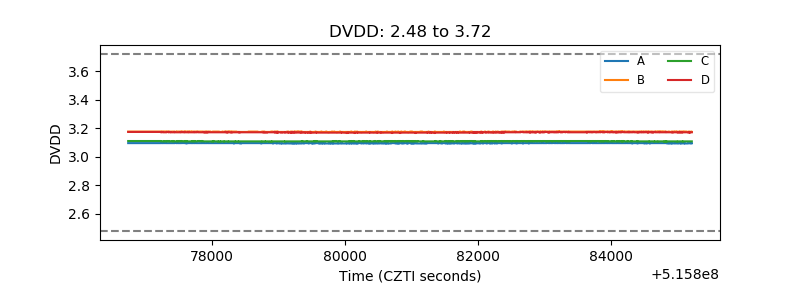 |
| Temperature 1 | 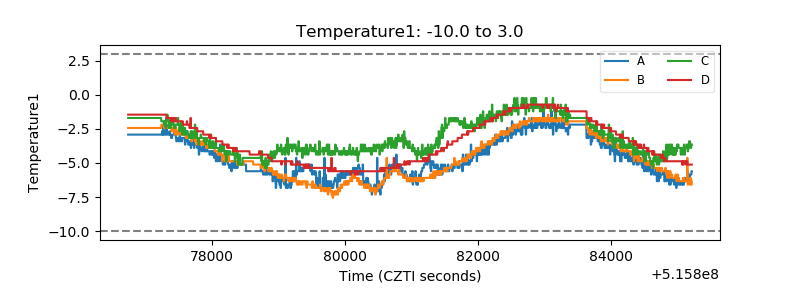 |
| Veto HV Monitor | 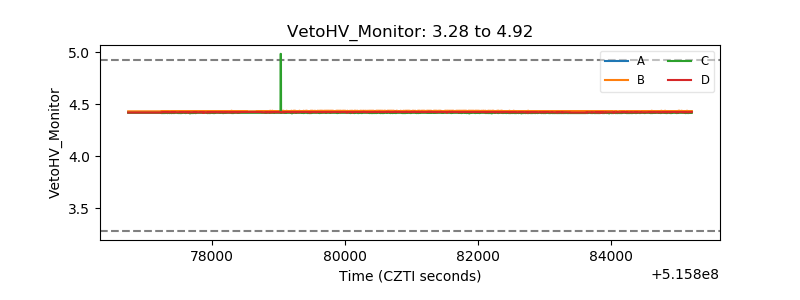 |
| Veto LLD | 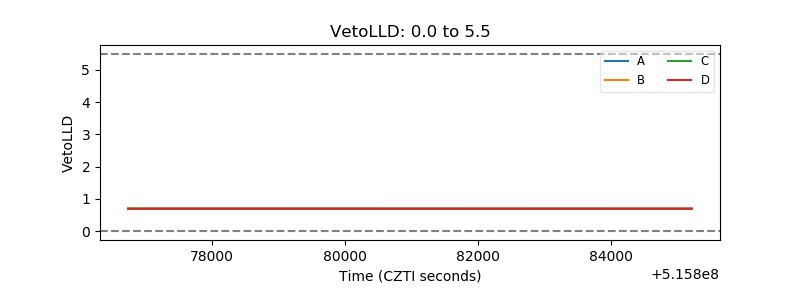 |
| Alpha Counter | 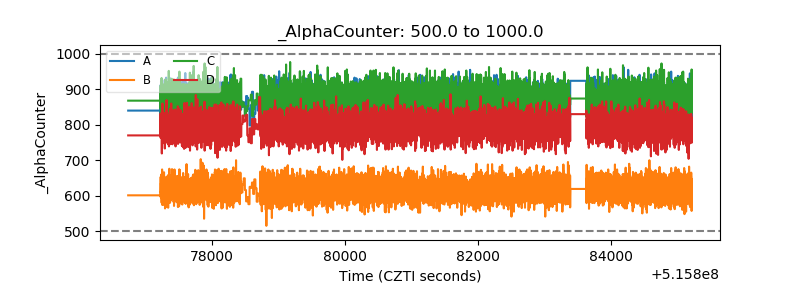 |
| _CPM_Rate | 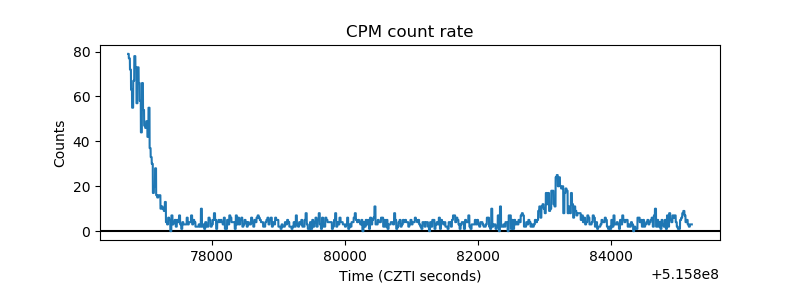 |
| CZT Counter | 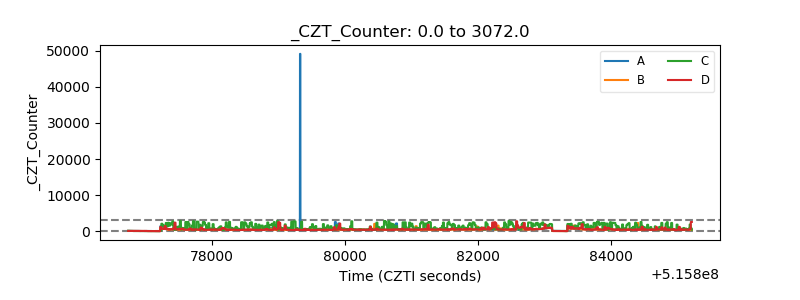 |
| +2.5 Volts monitor |  |
| +5 Volts monitor |  |
| _ROLL_ROT | 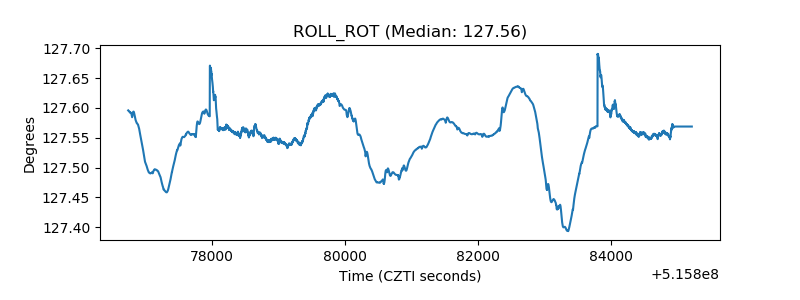 |
| _Roll_DEC | 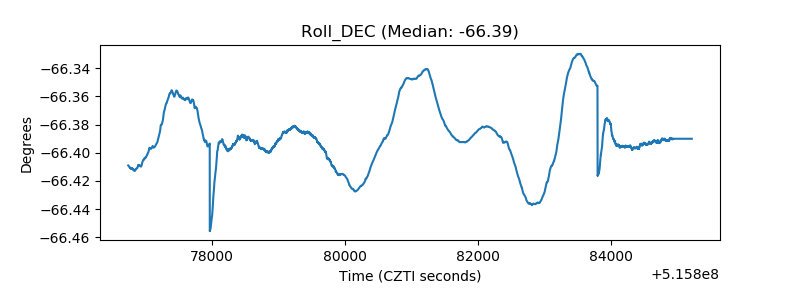 |
| _Roll_RA | 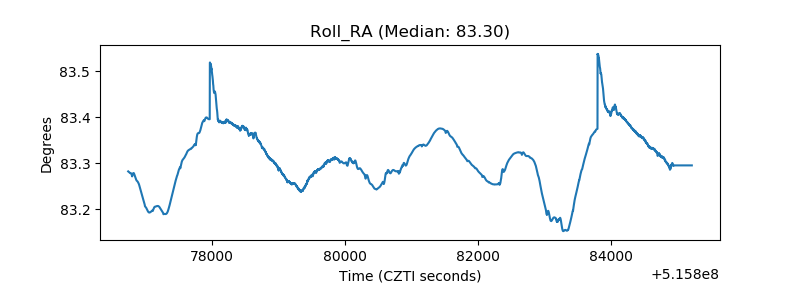 |
| Veto Counter | 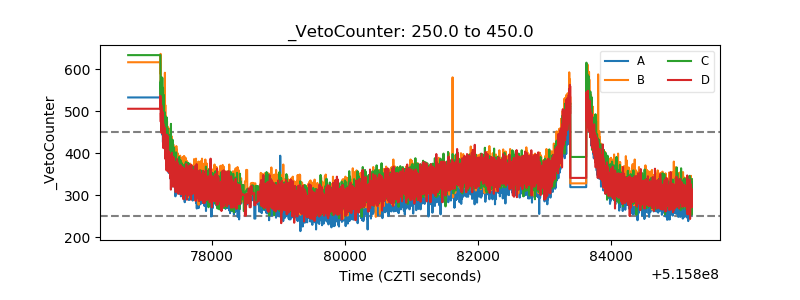 |