| Param | Original file | Final file |
|---|---|---|
| Filename | modeM0/AS1A14_102T01_9000006572_57398cztM0_level2.fits | modeM0/AS1A14_102T01_9000006572_57398cztM0_level2_quad_clean.evt |
| Size (bytes) | 654,491,520 | 105,091,200 |
| Size | 624.2 MB | 100.2 MB |
| Events in quadrant A | 3,858,180 | 700,799 |
| Events in quadrant B | 4,146,601 | 757,715 |
| Events in quadrant C | 9,994,329 | 554,389 |
| Events in quadrant D | 5,578,100 | 586,725 |
| Mode M0 | |||
|---|---|---|---|
| Quadrant | BADHDUFLAG | Total packets | Discarded packets |
| A | 0 | 17788 | 1 |
| B | 0 | 18549 | 1 |
| C | 0 | 35613 | 1 |
| D | 0 | 22508 | 1 |
| Mode M9 | |||
|---|---|---|---|
| Quadrant | BADHDUFLAG | Total packets | Discarded packets |
| A | 0 | 2 | 0 |
| B | 0 | 2 | 0 |
| C | 0 | 2 | 0 |
| D | 0 | 2 | 0 |
| Mode SS | |||
|---|---|---|---|
| Quadrant | BADHDUFLAG | Total packets | Discarded packets |
| A | 0 | 170 | 0 |
| B | 0 | 170 | 0 |
| C | 0 | 170 | 0 |
| D | 0 | 170 | 0 |
| Quadrant | Total seconds | Saturated seconds | Saturation percentage |
|---|---|---|---|
| A | 8375 | 97 | 1.158209% |
| B | 8374 | 214 | 2.555529% |
| C | 8374 | 1952 | 23.310246% |
| D | 8374 | 437 | 5.218534% |
Noise dominated data is calculated using 1-second bins in cleaned event files. If a bin has >2000 counts, and if more than 50% of those come from <1% of pixels, then it is considered to be noise-dominated and hence unusable.
| Quadrant | # 1 sec bins | Bins with >0 counts | Bins with >2000 counts | High rate bins dominated by noise | Noise dominated (total time) | Noise dominated (detector-on time) | Marked lightcurve |
|---|---|---|---|---|---|---|---|
| A | 8887 | 8648 | 11 | 11 | 0.12% | 0.13% |  |
| B | 8886 | 8647 | 53 | 53 | 0.60% | 0.61% |  |
| C | 8886 | 8647 | 1447 | 1447 | 16.28% | 16.73% |  |
| D | 8886 | 8647 | 297 | 297 | 3.34% | 3.43% |  |
Top three noisy pixels from each quadrant. If the there are fewer than three noisy pixels in the level2.evt file, extra rows are filled as -1
| Pixel properties | Quadrant properties | ||||||
|---|---|---|---|---|---|---|---|
| Quadrant | DetID | PixID | Counts | Sigma | Mean | Median | Sigma |
| A | 3 | 14 | 87071 | 382.87 | 923 | 900 | 225.1 |
| A | 0 | 12 | 72640 | 318.75 | 923 | 900 | 225.1 |
| A | 4 | 3 | 41432 | 180.09 | 923 | 900 | 225.1 |
| B | 7 | 252 | 160976 | 817.88 | 911 | 877 | 195.7 |
| B | 10 | 247 | 115641 | 586.28 | 911 | 877 | 195.7 |
| B | 5 | 185 | 79243 | 400.34 | 911 | 877 | 195.7 |
| C | 15 | 224 | 5216772 | 24093.04 | 793 | 782 | 216.5 |
| C | 6 | 223 | 458789 | 2115.57 | 793 | 782 | 216.5 |
| C | 14 | 246 | 378395 | 1744.22 | 793 | 782 | 216.5 |
| D | 7 | 96 | 1007750 | 4150.3 | 865 | 825 | 242.6 |
| D | 8 | 240 | 358853 | 1475.7 | 865 | 825 | 242.6 |
| D | 3 | 12 | 231738 | 951.77 | 865 | 825 | 242.6 |
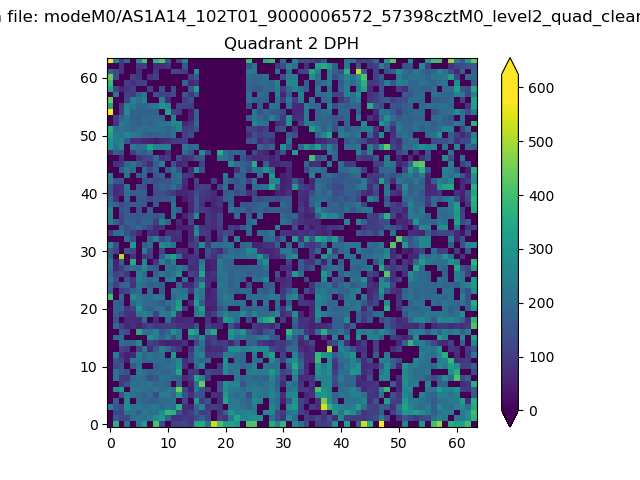
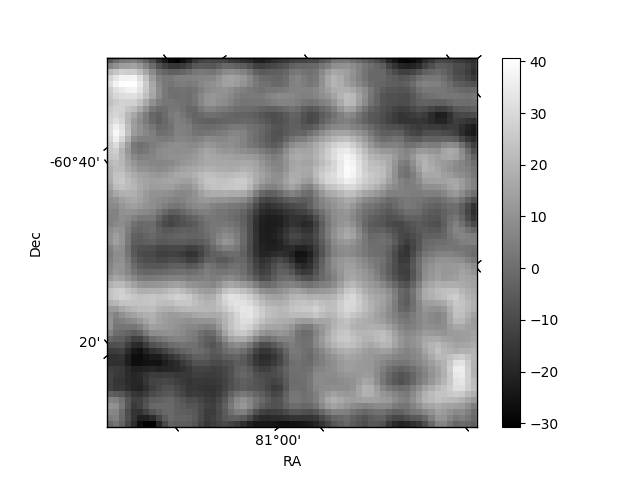
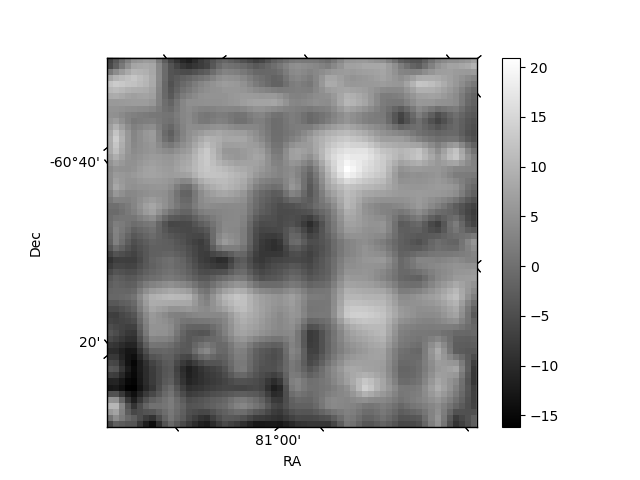
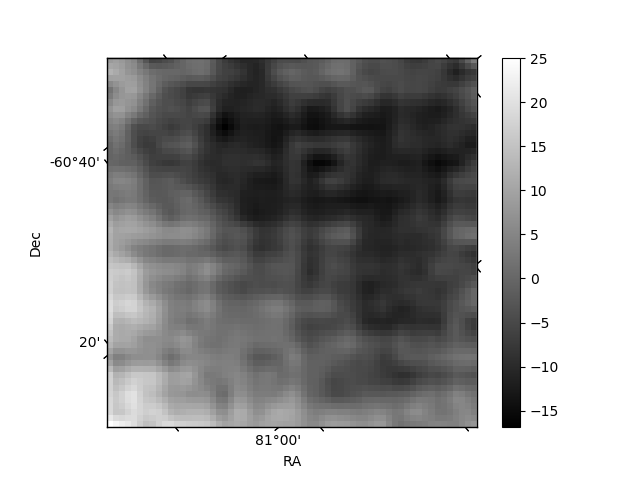
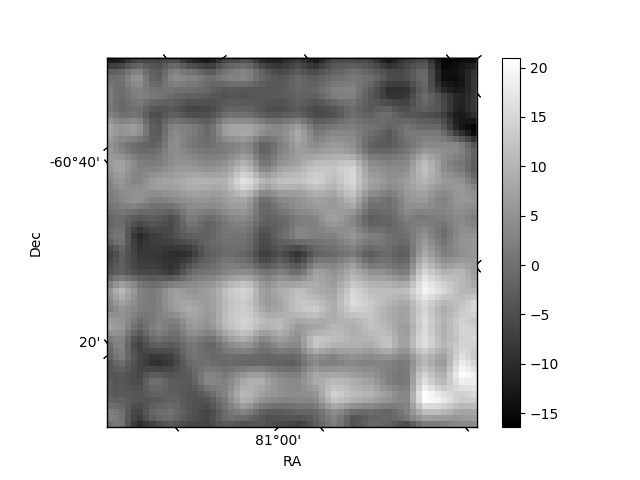
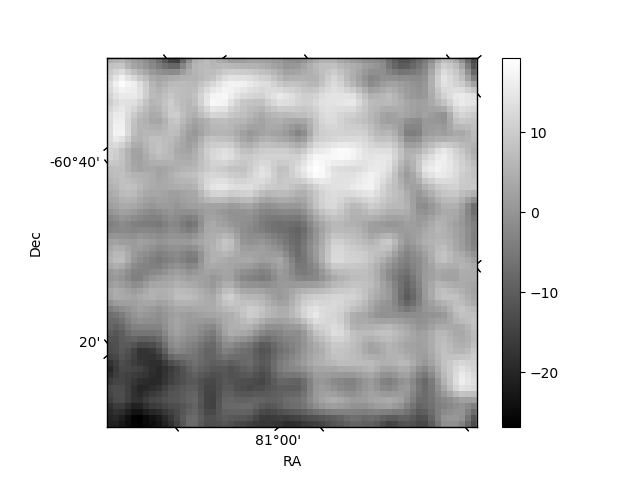
Histogram calculated using DETX and DETY for each event in the final _common_clean file
| Quadrant A | 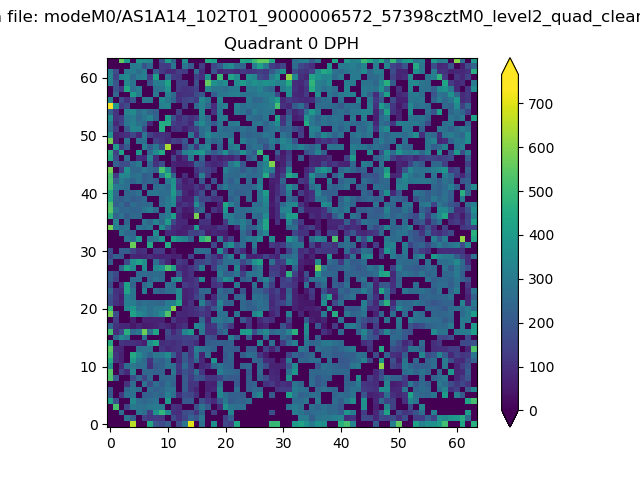 |
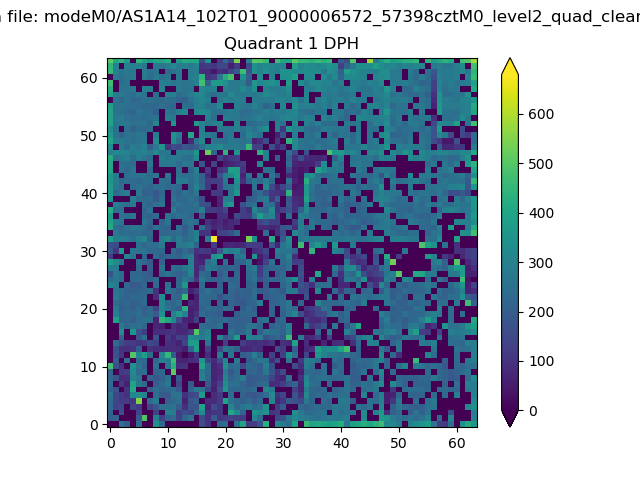 |
Quadrant B |
|---|---|---|---|
| Quadrant D | 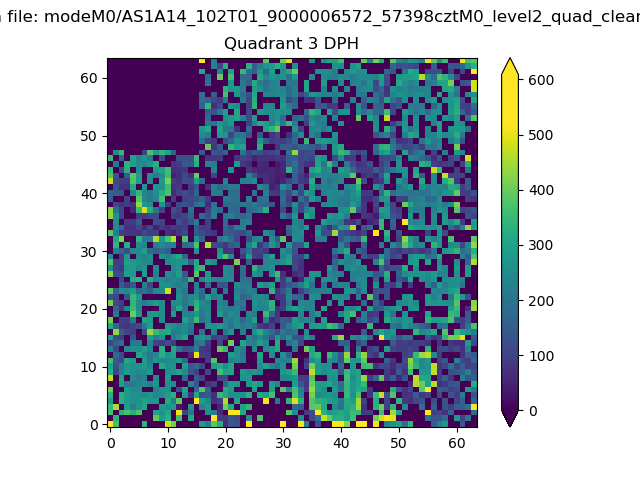 |
 |
Quadrant C |
| Plot type | Count rate plots | Images |
|---|---|---|
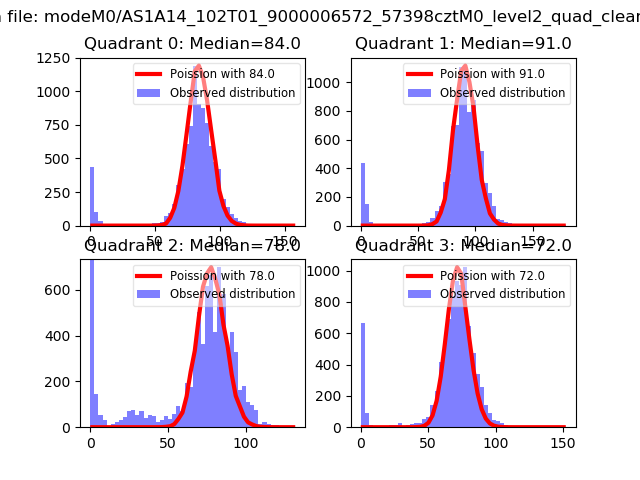
| Comparison with Poisson distribution Blue bars denote a histogram of data divided into 1 sec bins. Red curve is a Poisson curve with rate = median count rate of data. |
 |
 |
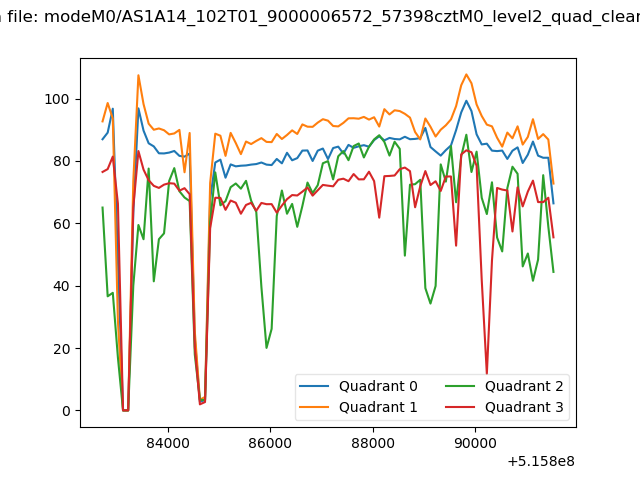
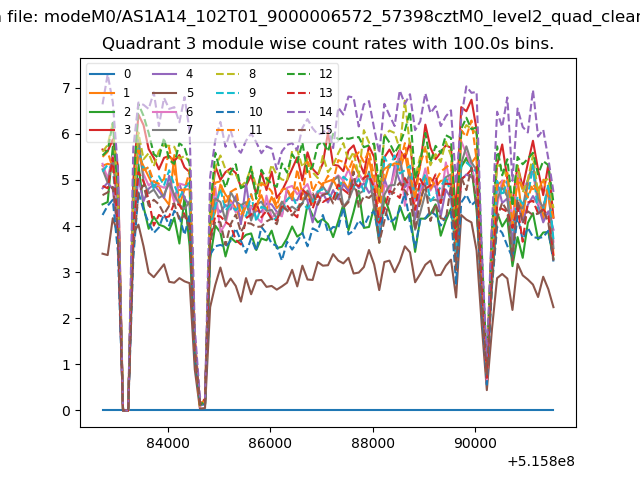
| Quadrant-wise count rates Data is divided into 100 sec bins |
 |
|
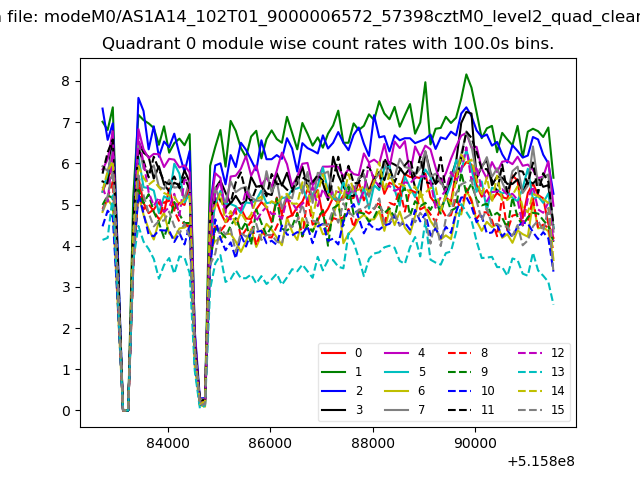
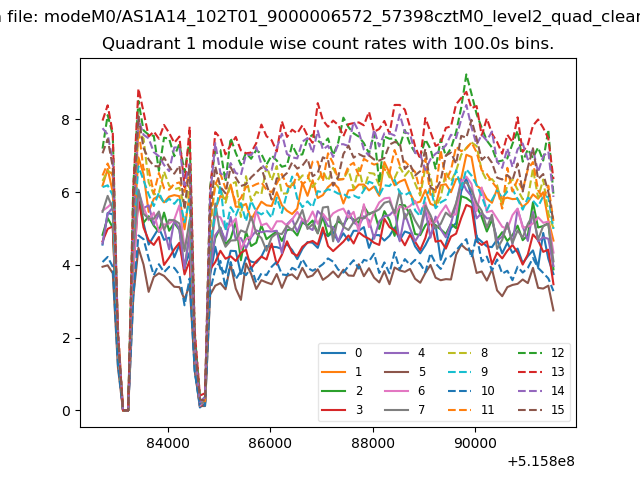
| Module-wise count rates for Quadrant A Data is divided into 100 sec bins |
 |
 |
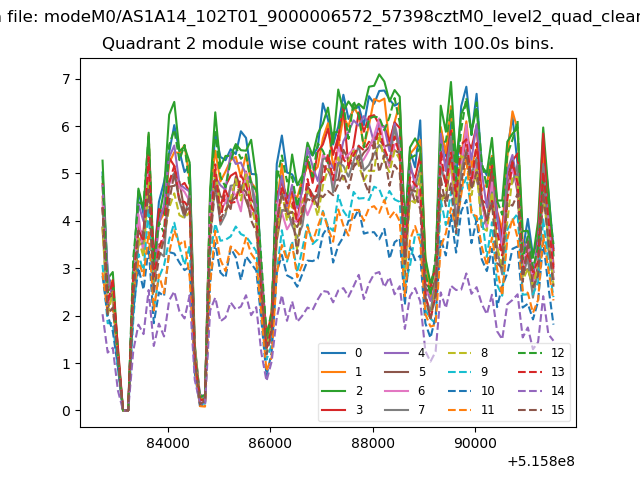
| Module-wise count rates for Quadrant B Data is divided into 100 sec bins |
 |
 |
| Module-wise count rates for Quadrant C Data is divided into 100 sec bins |
 |
 |
| Module-wise count rates for Quadrant D Data is divided into 100 sec bins |
 |
 |
| Parameter | Plot |
|---|---|
| CZT HV Monitor | 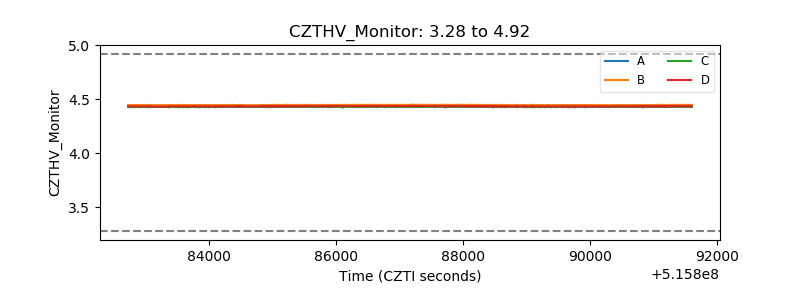 |
| D_VDD | 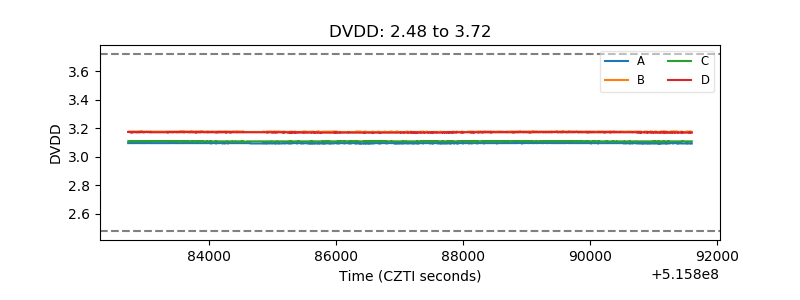 |
| Temperature 1 | 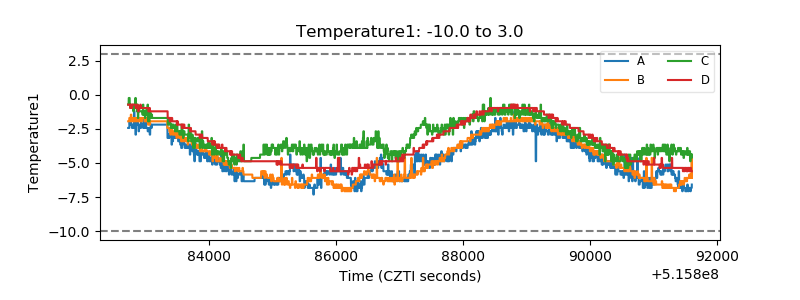 |
| Veto HV Monitor | 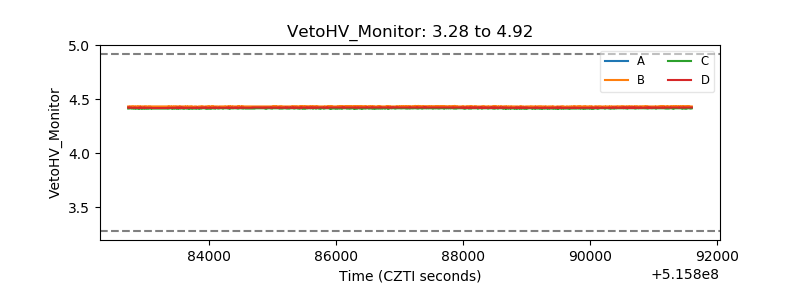 |
| Veto LLD | 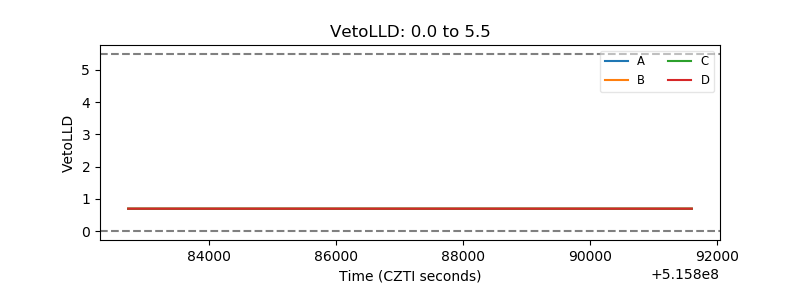 |
| Alpha Counter | 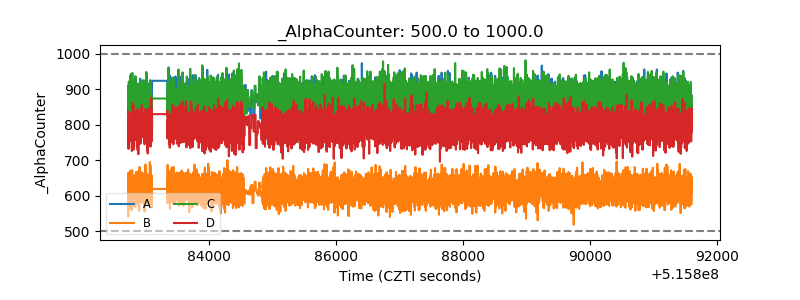 |
| _CPM_Rate | 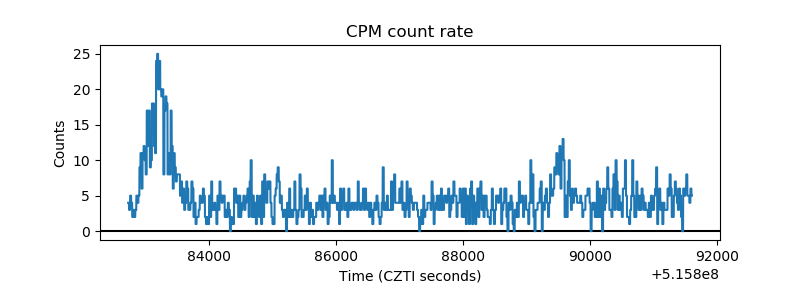 |
| CZT Counter | 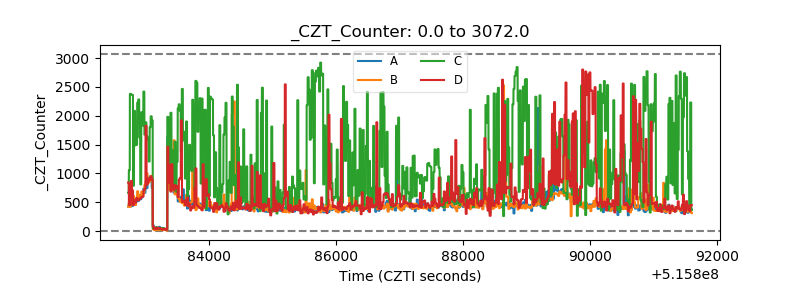 |
| +2.5 Volts monitor | 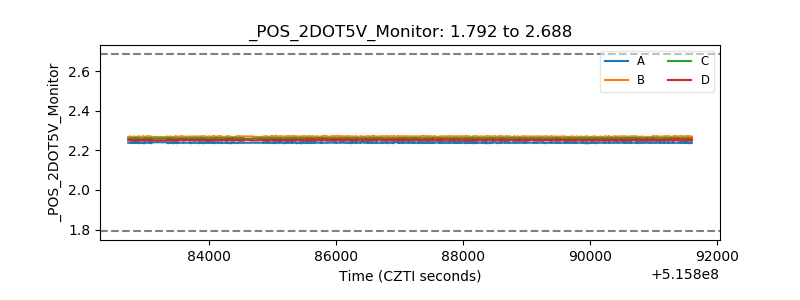 |
| +5 Volts monitor | 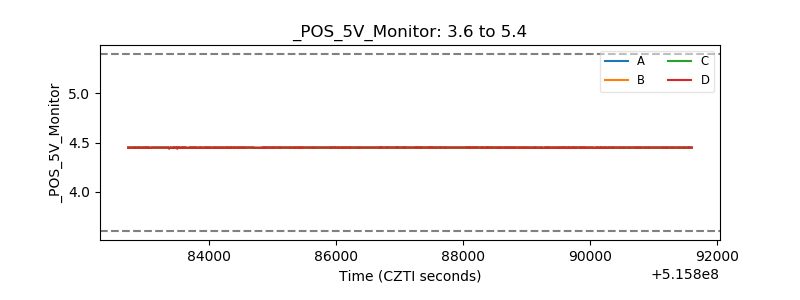 |
| _ROLL_ROT | 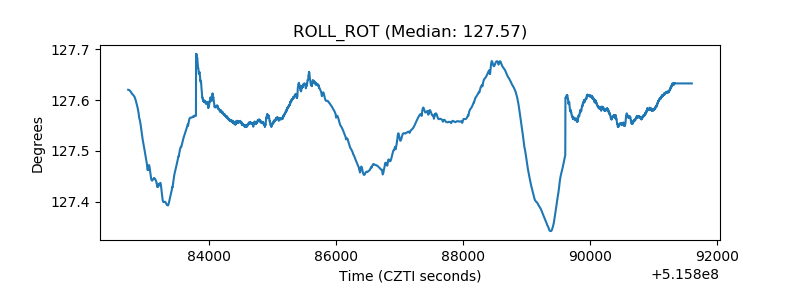 |
| _Roll_DEC | 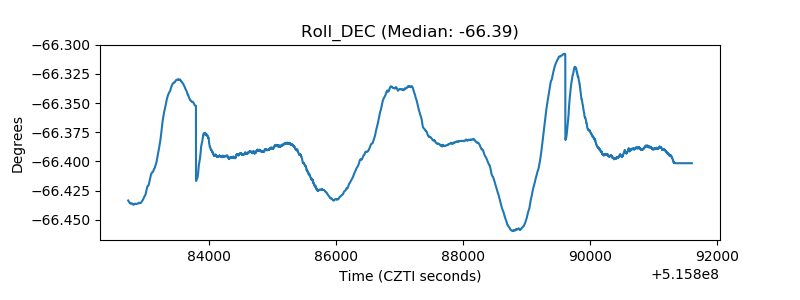 |
| _Roll_RA | 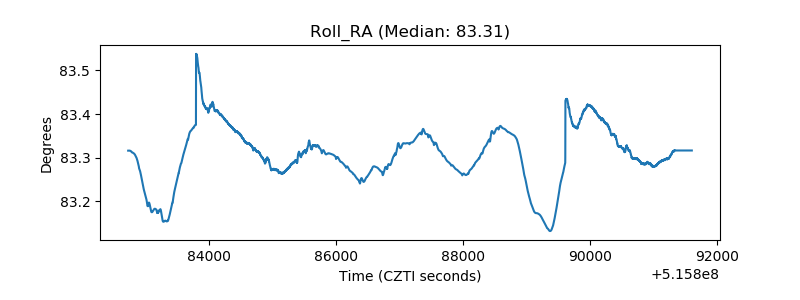 |
| Veto Counter | 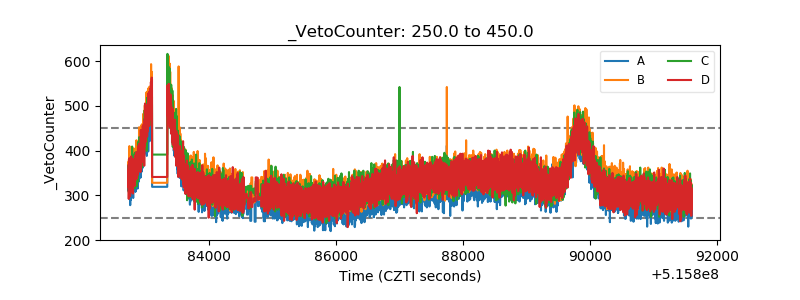 |