| Param | Original file | Final file |
|---|---|---|
| Filename | modeM0/AS1A14_102T01_9000006572_57399cztM0_level2.fits | modeM0/AS1A14_102T01_9000006572_57399cztM0_level2_quad_clean.evt |
| Size (bytes) | 668,638,080 | 99,319,680 |
| Size | 637.7 MB | 94.7 MB |
| Events in quadrant A | 4,130,584 | 677,536 |
| Events in quadrant B | 3,782,697 | 712,161 |
| Events in quadrant C | 11,140,232 | 481,379 |
| Events in quadrant D | 5,062,808 | 567,512 |
| Mode M0 | |||
|---|---|---|---|
| Quadrant | BADHDUFLAG | Total packets | Discarded packets |
| A | 0 | 18127 | 0 |
| B | 0 | 17429 | 0 |
| C | 0 | 38776 | 7 |
| D | 0 | 20827 | 0 |
| Mode SS | |||
|---|---|---|---|
| Quadrant | BADHDUFLAG | Total packets | Discarded packets |
| A | 0 | 164 | 0 |
| B | 0 | 164 | 0 |
| C | 0 | 164 | 0 |
| D | 0 | 164 | 0 |
| Quadrant | Total seconds | Saturated seconds | Saturation percentage |
|---|---|---|---|
| A | 8174 | 36 | 0.440421% |
| B | 8174 | 61 | 0.746269% |
| C | 8173 | 2663 | 32.582895% |
| D | 8174 | 317 | 3.878150% |
Noise dominated data is calculated using 1-second bins in cleaned event files. If a bin has >2000 counts, and if more than 50% of those come from <1% of pixels, then it is considered to be noise-dominated and hence unusable.
| Quadrant | # 1 sec bins | Bins with >0 counts | Bins with >2000 counts | High rate bins dominated by noise | Noise dominated (total time) | Noise dominated (detector-on time) | Marked lightcurve |
|---|---|---|---|---|---|---|---|
| A | 8446 | 8446 | 15 | 15 | 0.18% | 0.18% | 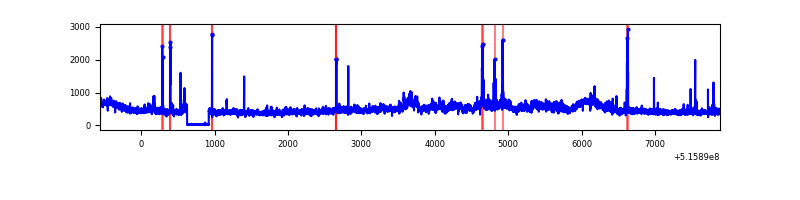 |
| B | 8446 | 8446 | 12 | 12 | 0.14% | 0.14% | 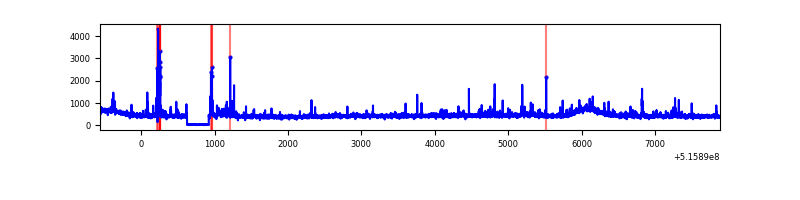 |
| C | 8445 | 8435 | 2004 | 2004 | 23.73% | 23.76% | 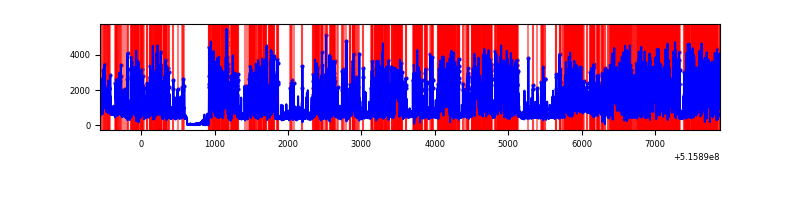 |
| D | 8446 | 8446 | 264 | 264 | 3.13% | 3.13% | 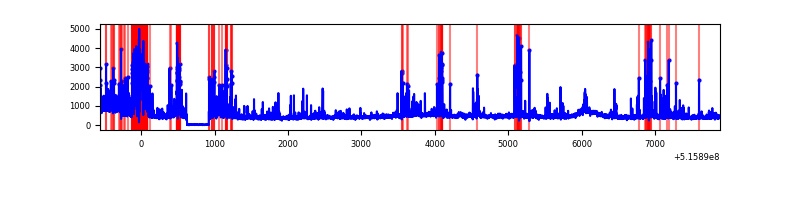 |
Top three noisy pixels from each quadrant. If the there are fewer than three noisy pixels in the level2.evt file, extra rows are filled as -1
| Pixel properties | Quadrant properties | ||||||
|---|---|---|---|---|---|---|---|
| Quadrant | DetID | PixID | Counts | Sigma | Mean | Median | Sigma |
| A | 3 | 14 | 419067 | 1918.76 | 889 | 867 | 218.0 |
| A | 0 | 12 | 137230 | 625.65 | 889 | 867 | 218.0 |
| A | 13 | 248 | 57160 | 258.28 | 889 | 867 | 218.0 |
| B | 7 | 252 | 92796 | 479.3 | 887 | 852 | 191.8 |
| B | 0 | 245 | 60939 | 313.23 | 887 | 852 | 191.8 |
| B | 5 | 185 | 48043 | 246.01 | 887 | 852 | 191.8 |
| C | 15 | 224 | 7056961 | 35899.37 | 730 | 722 | 196.6 |
| C | 6 | 223 | 808773 | 4111.05 | 730 | 722 | 196.6 |
| C | 14 | 254 | 126950 | 642.2 | 730 | 722 | 196.6 |
| D | 7 | 96 | 784921 | 3367.13 | 839 | 800 | 232.9 |
| D | 8 | 240 | 387641 | 1661.15 | 839 | 800 | 232.9 |
| D | 2 | 249 | 151802 | 648.42 | 839 | 800 | 232.9 |
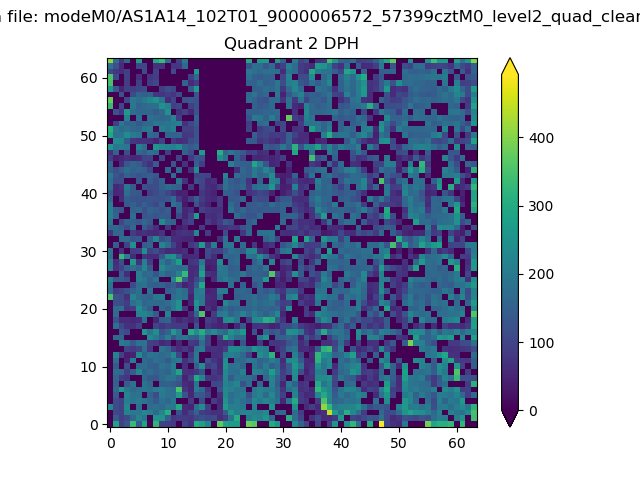
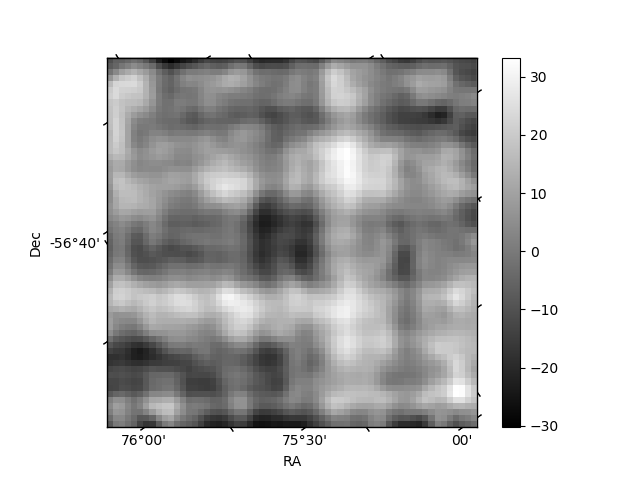
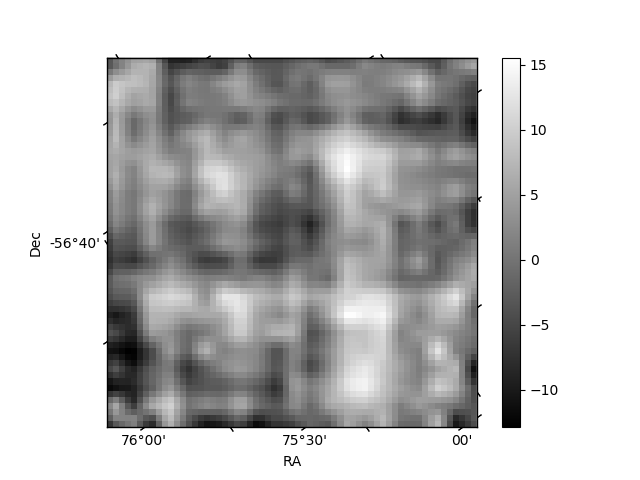
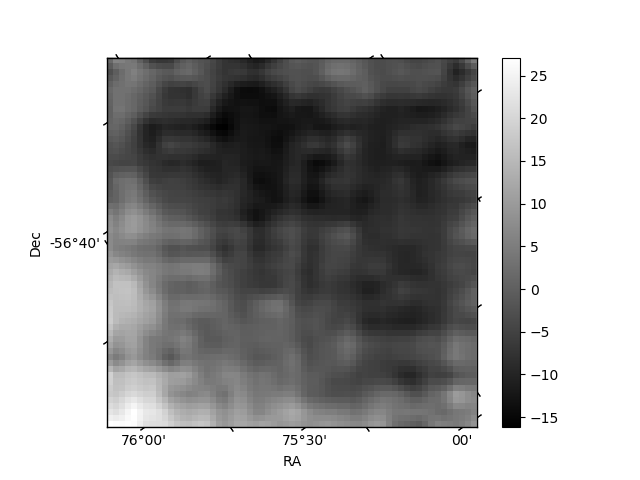
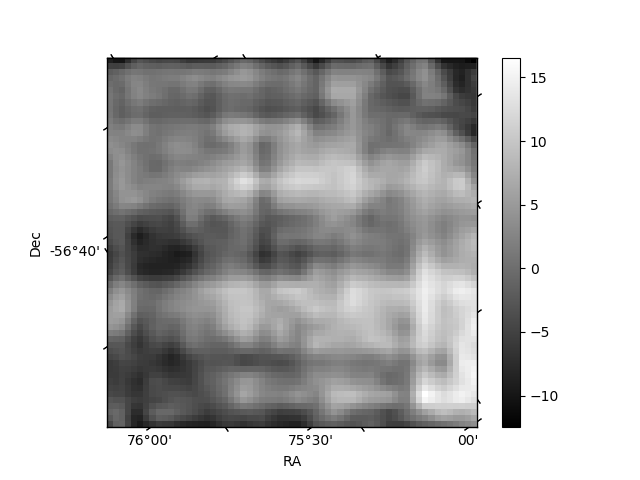
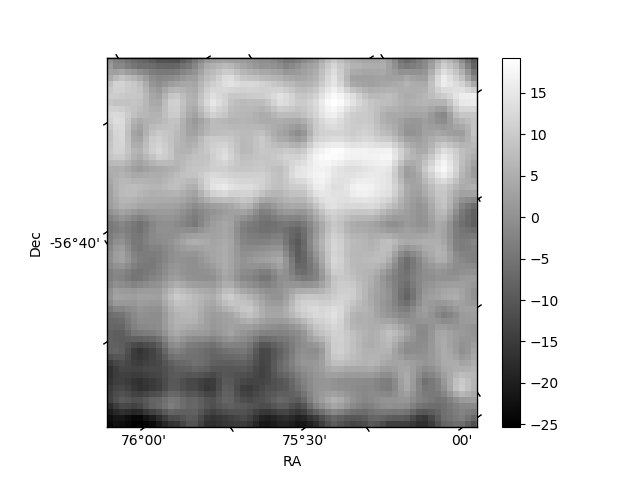
Histogram calculated using DETX and DETY for each event in the final _common_clean file
| Quadrant A | 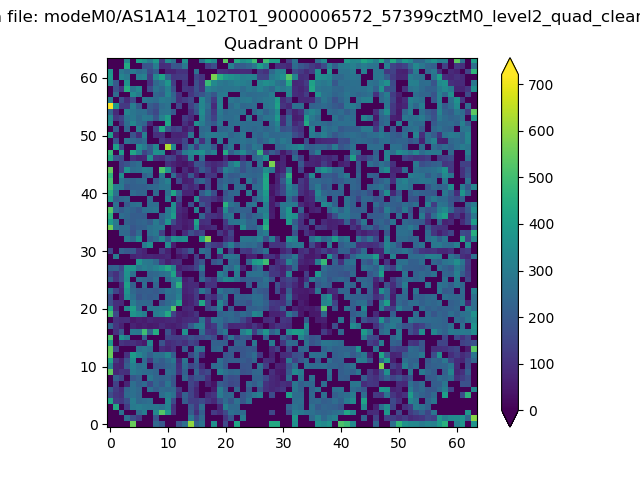 |
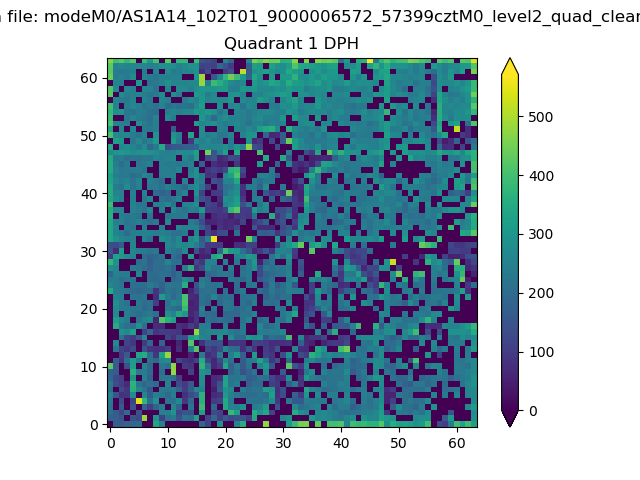 |
Quadrant B |
|---|---|---|---|
| Quadrant D | 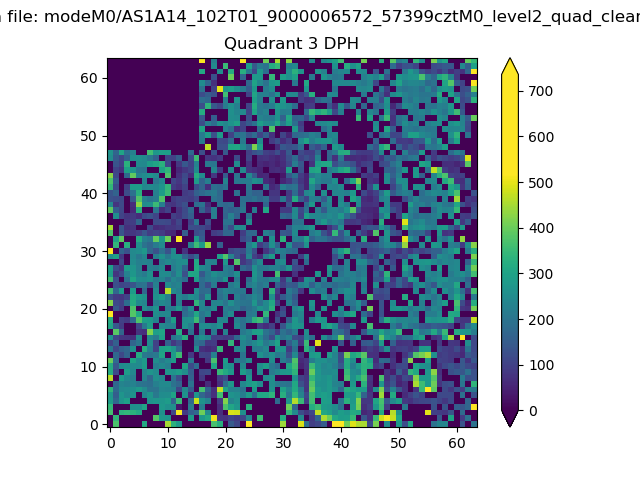 |
 |
Quadrant C |
| Plot type | Count rate plots | Images |
|---|---|---|
| Comparison with Poisson distribution Blue bars denote a histogram of data divided into 1 sec bins. Red curve is a Poisson curve with rate = median count rate of data. |
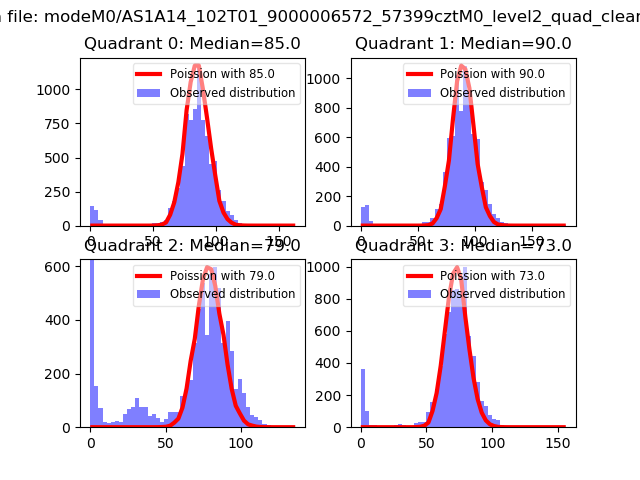 |
 |
| Quadrant-wise count rates Data is divided into 100 sec bins |
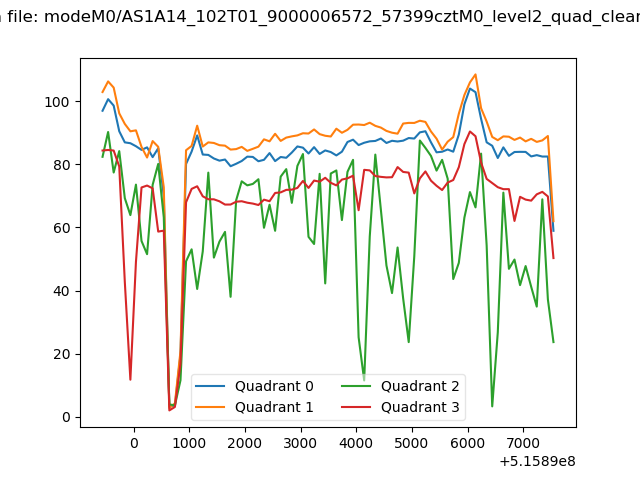 |
|
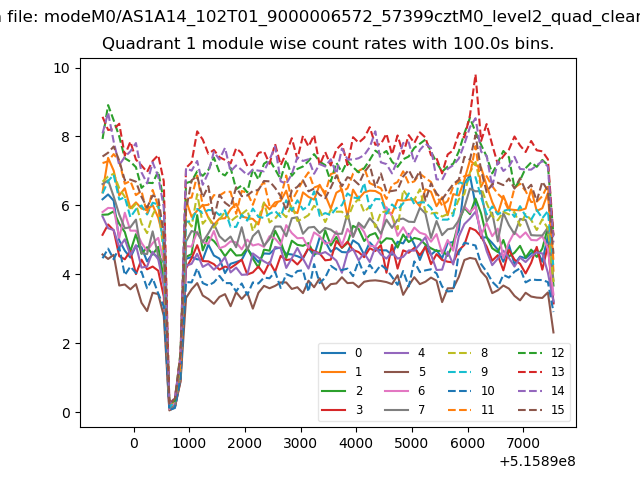
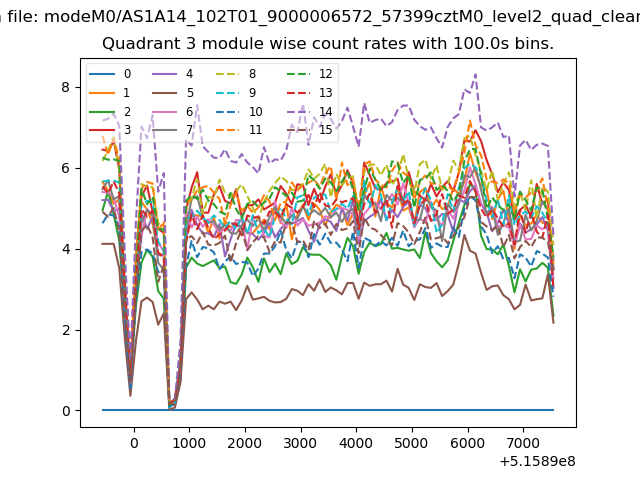
| Module-wise count rates for Quadrant A Data is divided into 100 sec bins |
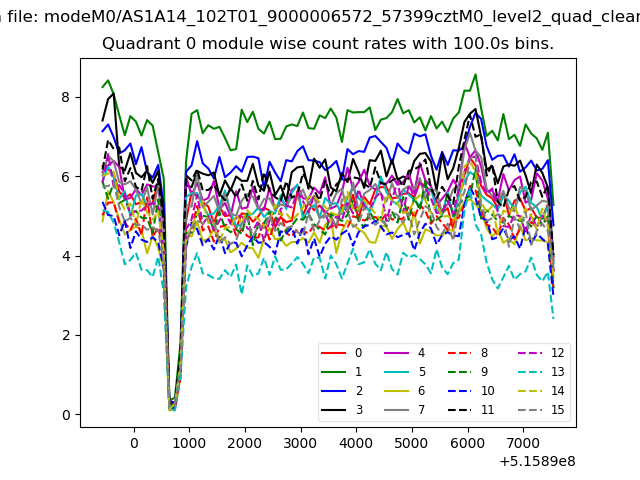 |
 |
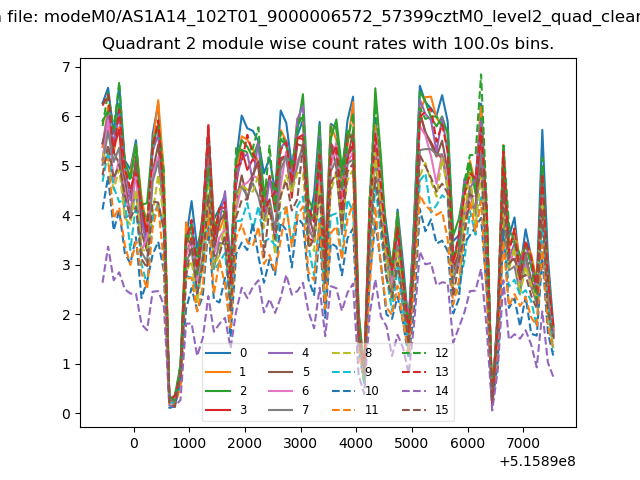
| Module-wise count rates for Quadrant B Data is divided into 100 sec bins |
 |
 |
| Module-wise count rates for Quadrant C Data is divided into 100 sec bins |
 |
 |
| Module-wise count rates for Quadrant D Data is divided into 100 sec bins |
 |
 |
| Parameter | Plot |
|---|---|
| CZT HV Monitor | 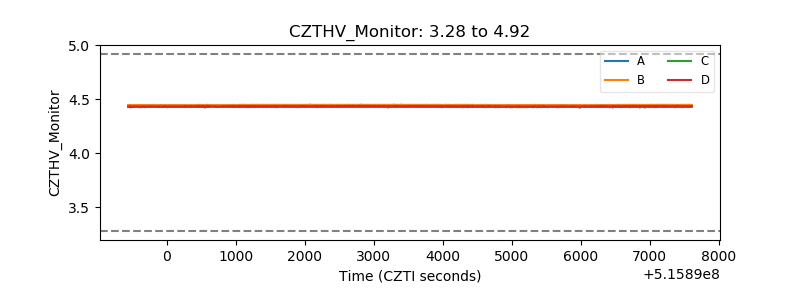 |
| D_VDD | 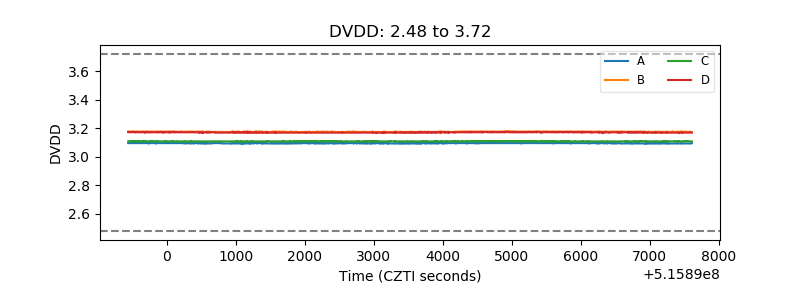 |
| Temperature 1 | 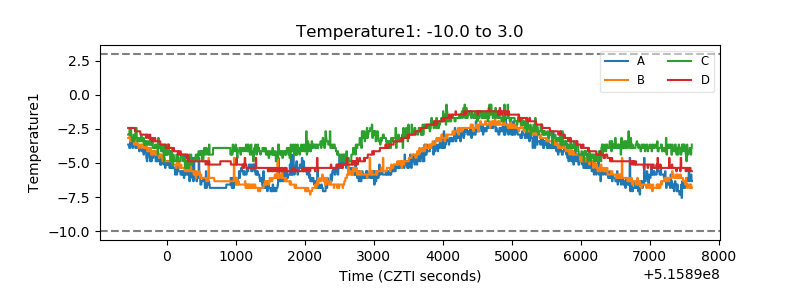 |
| Veto HV Monitor | 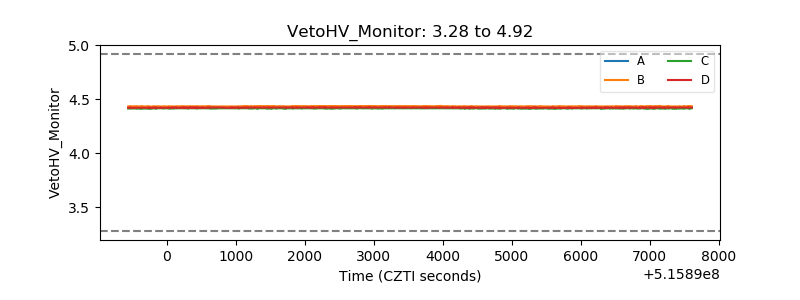 |
| Veto LLD | 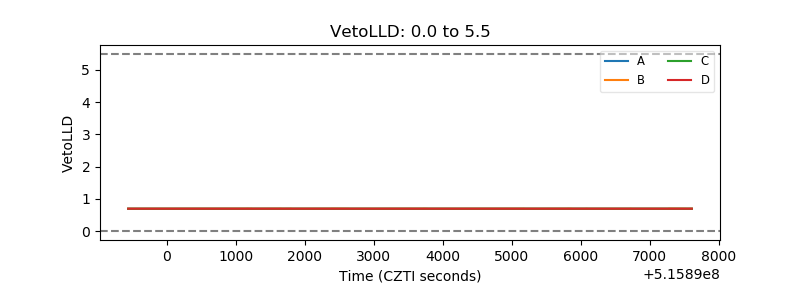 |
| Alpha Counter | 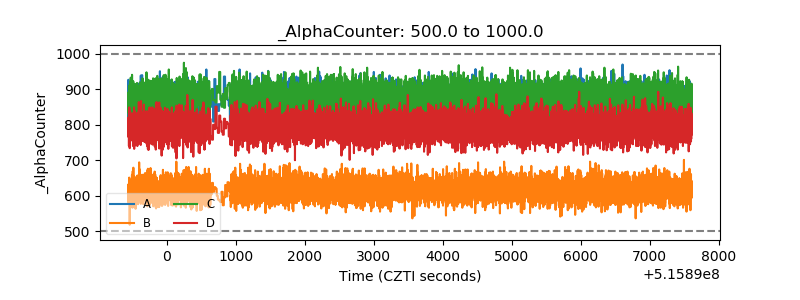 |
| _CPM_Rate | 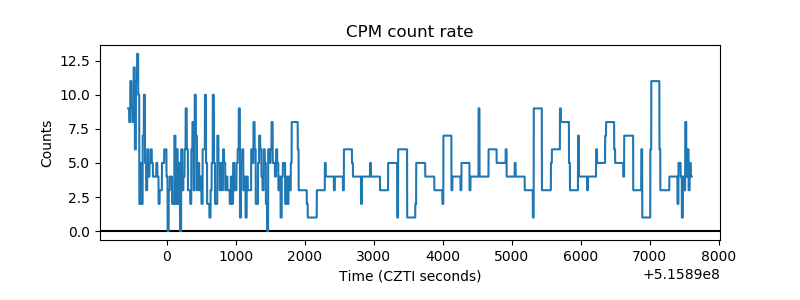 |
| CZT Counter | 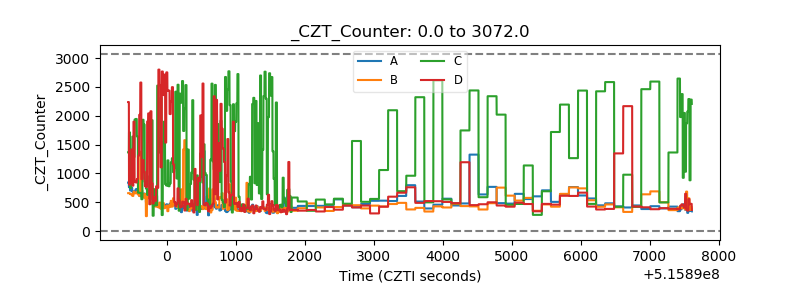 |
| +2.5 Volts monitor | 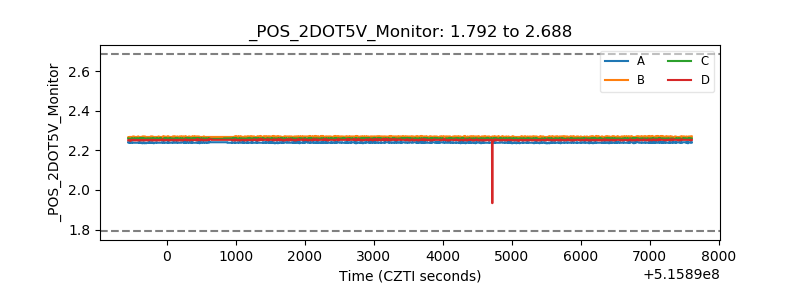 |
| +5 Volts monitor | 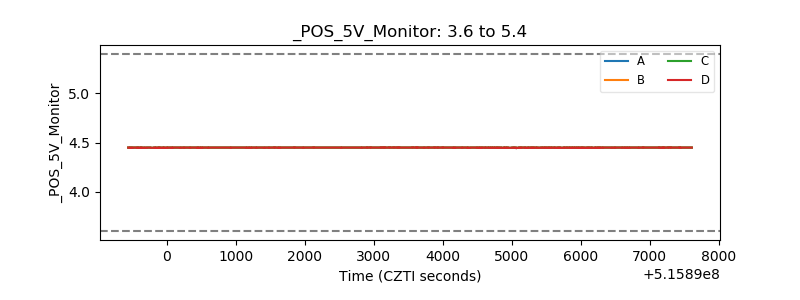 |
| _ROLL_ROT | 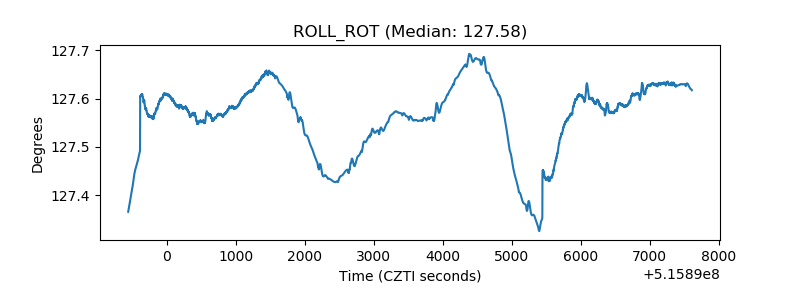 |
| _Roll_DEC | 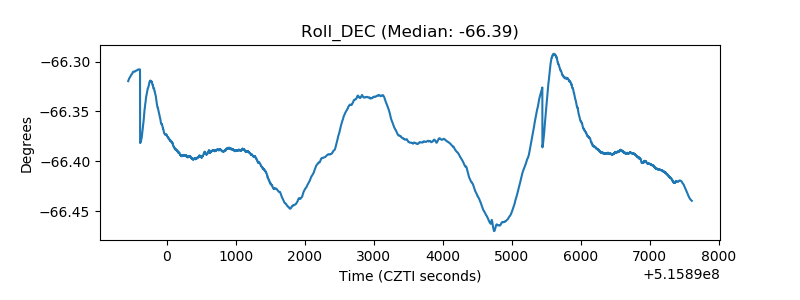 |
| _Roll_RA | 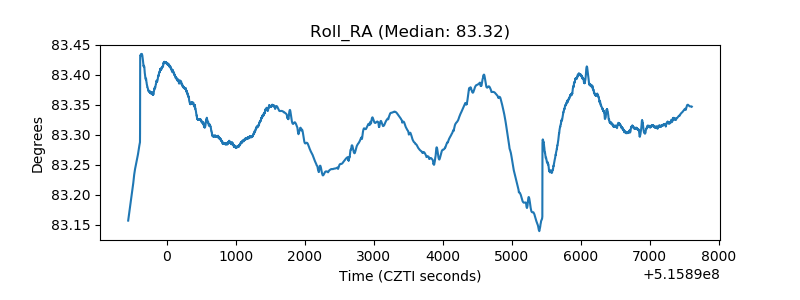 |
| Veto Counter | 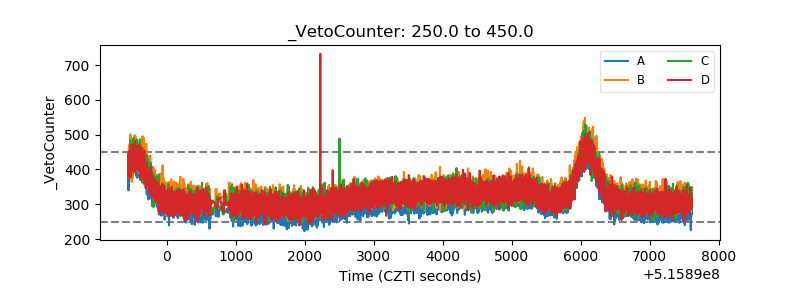 |