| Param | Original file | Final file |
|---|---|---|
| Filename | modeM0/AS1A14_102T01_9000006572_57402cztM0_level2.fits | modeM0/AS1A14_102T01_9000006572_57402cztM0_level2_quad_clean.evt |
| Size (bytes) | 1,517,829,120 | 272,462,400 |
| Size | 1.4 GB | 259.8 MB |
| Events in quadrant A | 10,169,644 | 1,855,668 |
| Events in quadrant B | 9,611,729 | 1,985,707 |
| Events in quadrant C | 23,656,106 | 1,378,795 |
| Events in quadrant D | 11,195,467 | 1,647,336 |
| Mode M0 | |||
|---|---|---|---|
| Quadrant | BADHDUFLAG | Total packets | Discarded packets |
| A | 0 | 44580 | 4 |
| B | 0 | 43203 | 4 |
| C | 0 | 84193 | 4 |
| D | 0 | 47544 | 4 |
| Mode M9 | |||
|---|---|---|---|
| Quadrant | BADHDUFLAG | Total packets | Discarded packets |
| A | 0 | 13 | 0 |
| B | 0 | 13 | 0 |
| C | 0 | 13 | 0 |
| D | 0 | 13 | 0 |
| Mode SS | |||
|---|---|---|---|
| Quadrant | BADHDUFLAG | Total packets | Discarded packets |
| A | 0 | 408 | 0 |
| B | 0 | 408 | 0 |
| C | 0 | 408 | 0 |
| D | 0 | 408 | 0 |
| Quadrant | Total seconds | Saturated seconds | Saturation percentage |
|---|---|---|---|
| A | 20058 | 304 | 1.515605% |
| B | 20059 | 391 | 1.949250% |
| C | 20059 | 4942 | 24.637320% |
| D | 20058 | 521 | 2.597467% |
Noise dominated data is calculated using 1-second bins in cleaned event files. If a bin has >2000 counts, and if more than 50% of those come from <1% of pixels, then it is considered to be noise-dominated and hence unusable.
| Quadrant | # 1 sec bins | Bins with >0 counts | Bins with >2000 counts | High rate bins dominated by noise | Noise dominated (total time) | Noise dominated (detector-on time) | Marked lightcurve |
|---|---|---|---|---|---|---|---|
| A | 21338 | 20063 | 75 | 75 | 0.35% | 0.37% | 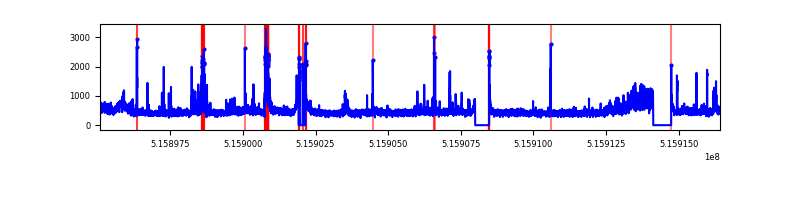 |
| B | 21339 | 20064 | 42 | 42 | 0.20% | 0.21% | 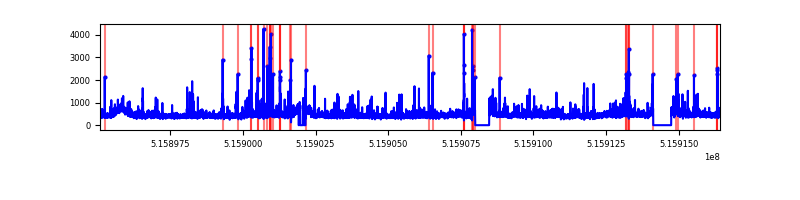 |
| C | 21339 | 20064 | 3643 | 3643 | 17.07% | 18.16% | 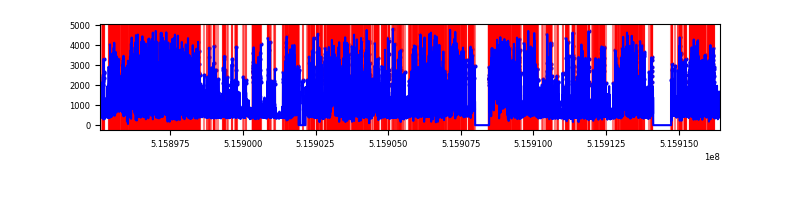 |
| D | 21338 | 20063 | 293 | 293 | 1.37% | 1.46% | 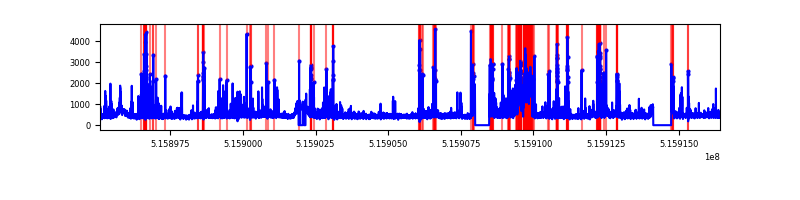 |
Top three noisy pixels from each quadrant. If the there are fewer than three noisy pixels in the level2.evt file, extra rows are filled as -1
| Pixel properties | Quadrant properties | ||||||
|---|---|---|---|---|---|---|---|
| Quadrant | DetID | PixID | Counts | Sigma | Mean | Median | Sigma |
| A | 0 | 12 | 717068 | 1345.63 | 2171 | 2115 | 531.3 |
| A | 8 | 227 | 559112 | 1048.34 | 2171 | 2115 | 531.3 |
| A | 3 | 14 | 276878 | 517.14 | 2171 | 2115 | 531.3 |
| B | 0 | 216 | 358439 | 770.26 | 2155 | 2067 | 462.7 |
| B | 0 | 245 | 134528 | 286.3 | 2155 | 2067 | 462.7 |
| B | 5 | 185 | 132649 | 282.24 | 2155 | 2067 | 462.7 |
| C | 15 | 224 | 14398107 | 28357.5 | 1883 | 1865 | 507.7 |
| C | 12 | 252 | 412800 | 809.45 | 1883 | 1865 | 507.7 |
| C | 6 | 223 | 411470 | 806.83 | 1883 | 1865 | 507.7 |
| D | 8 | 240 | 1011831 | 1731.13 | 2101 | 2010 | 583.3 |
| D | 7 | 96 | 650642 | 1111.95 | 2101 | 2010 | 583.3 |
| D | 2 | 249 | 260845 | 443.72 | 2101 | 2010 | 583.3 |
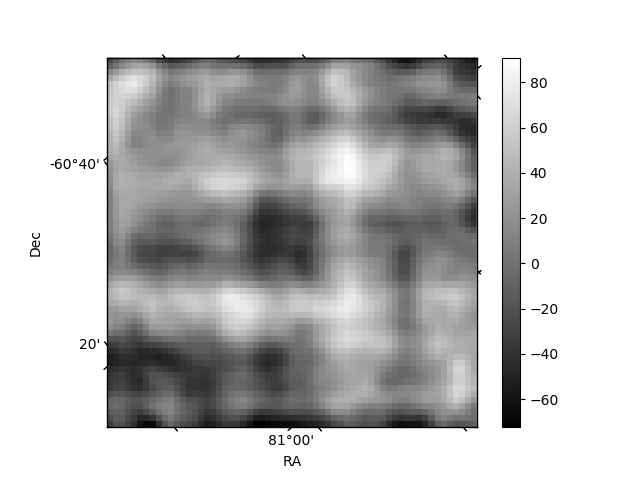
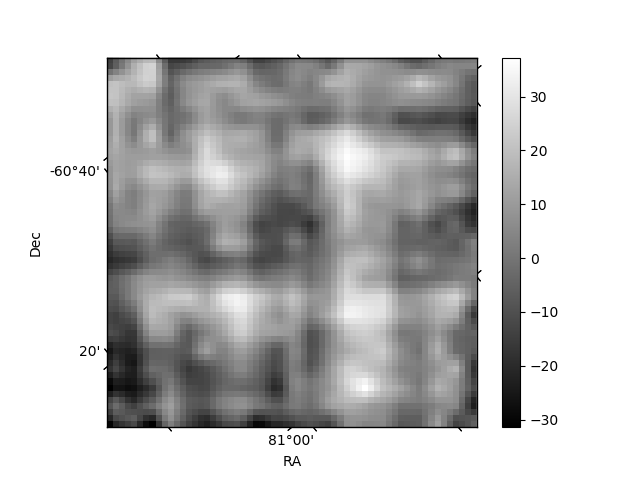
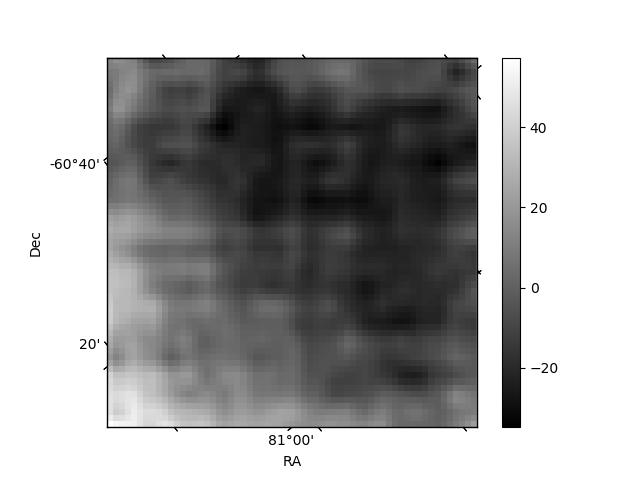
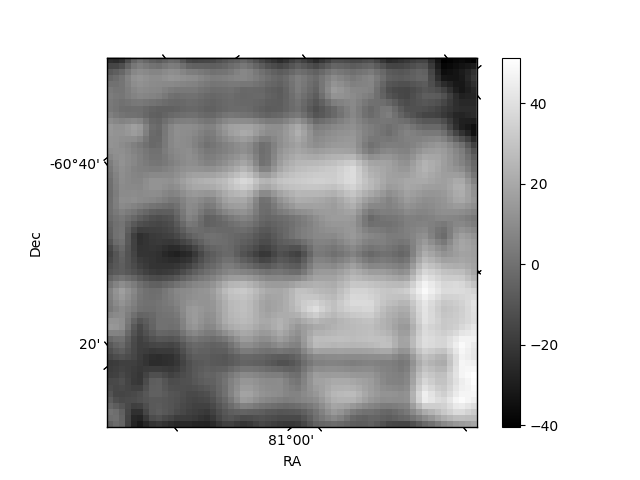
Histogram calculated using DETX and DETY for each event in the final _common_clean file
| Quadrant A | 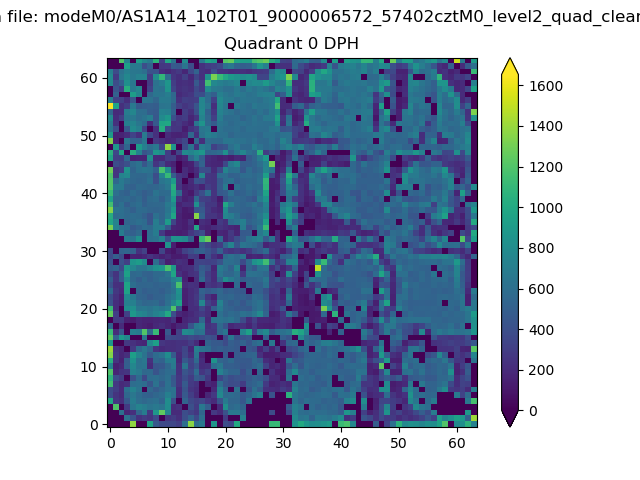 |
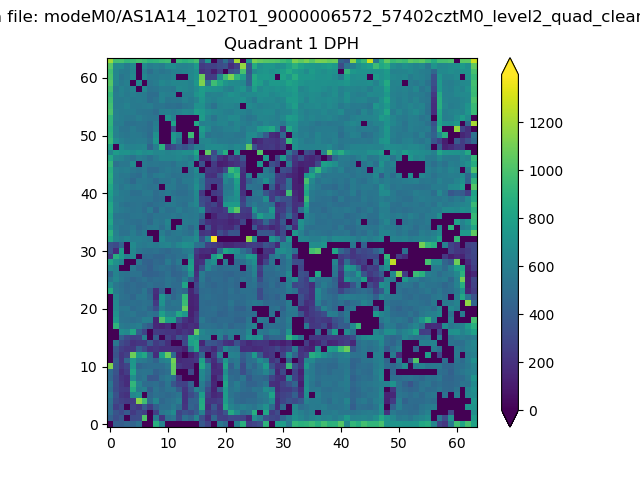 |
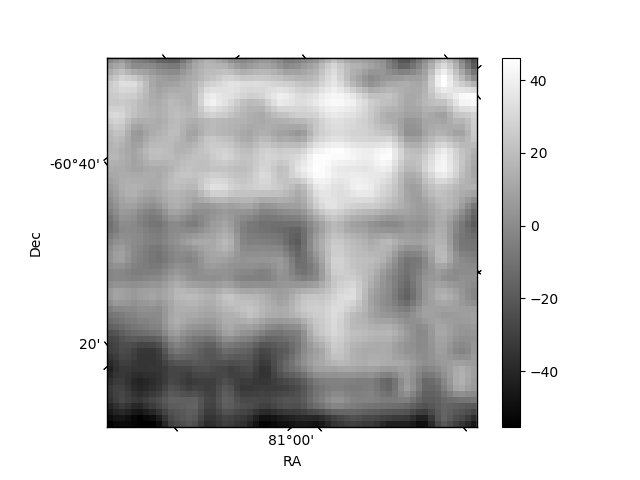
Quadrant B |
|---|---|---|---|
| Quadrant D | 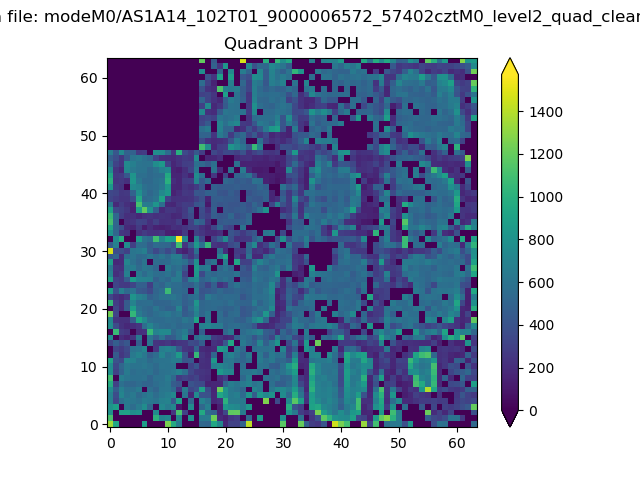 |
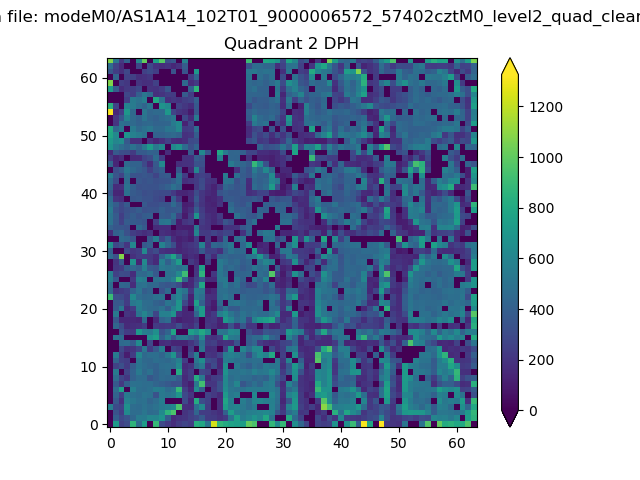 |
Quadrant C |
| Plot type | Count rate plots | Images |
|---|---|---|
| Comparison with Poisson distribution Blue bars denote a histogram of data divided into 1 sec bins. Red curve is a Poisson curve with rate = median count rate of data. |
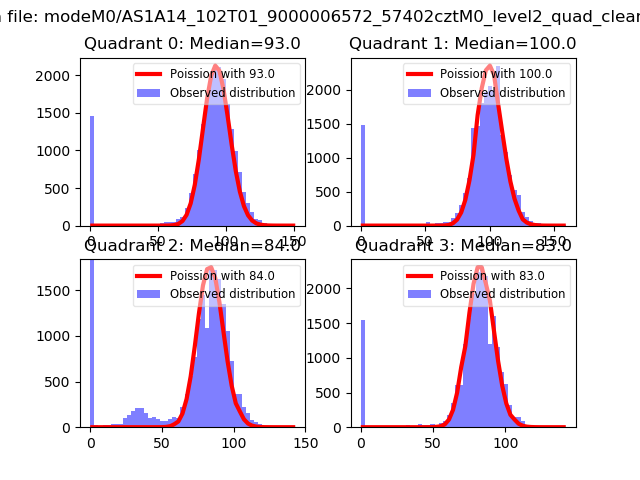 |
 |
| Quadrant-wise count rates Data is divided into 100 sec bins |
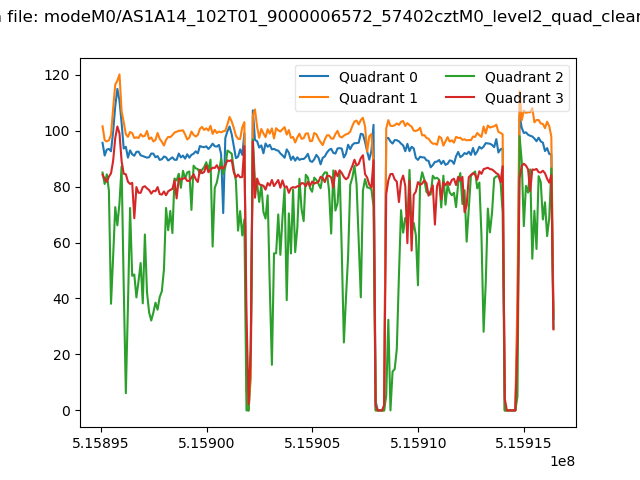 |
|
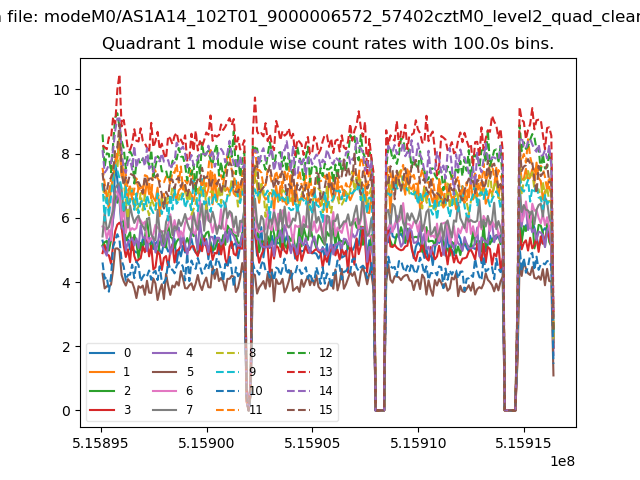
| Module-wise count rates for Quadrant A Data is divided into 100 sec bins |
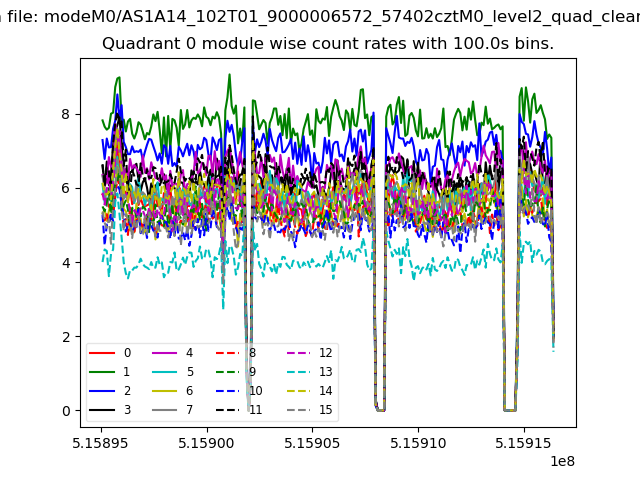 |
 |
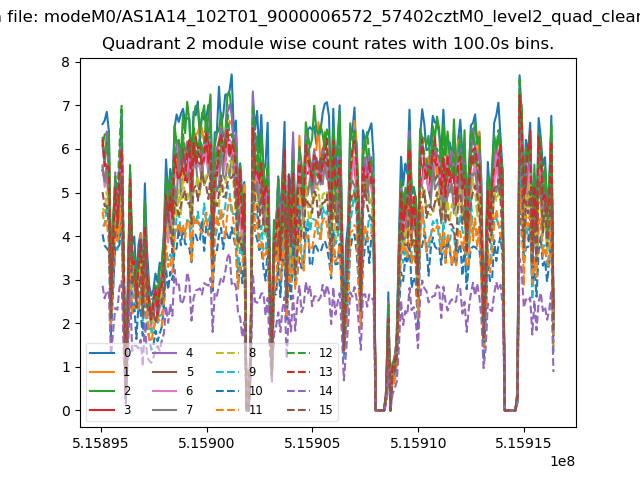
| Module-wise count rates for Quadrant B Data is divided into 100 sec bins |
 |
 |
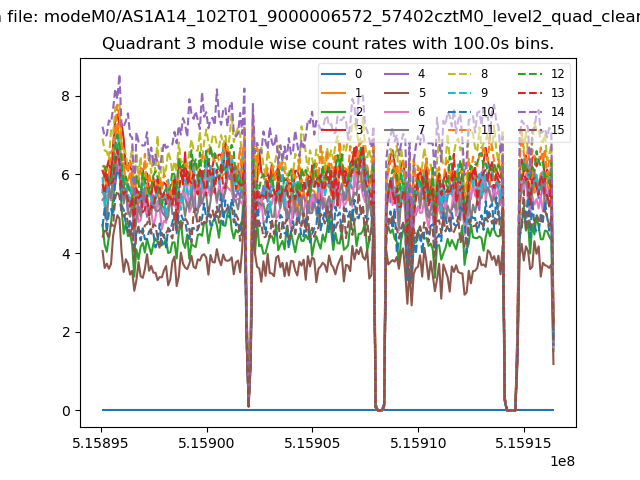
| Module-wise count rates for Quadrant C Data is divided into 100 sec bins |
 |
 |
| Module-wise count rates for Quadrant D Data is divided into 100 sec bins |
 |
 |
| Parameter | Plot |
|---|---|
| CZT HV Monitor | 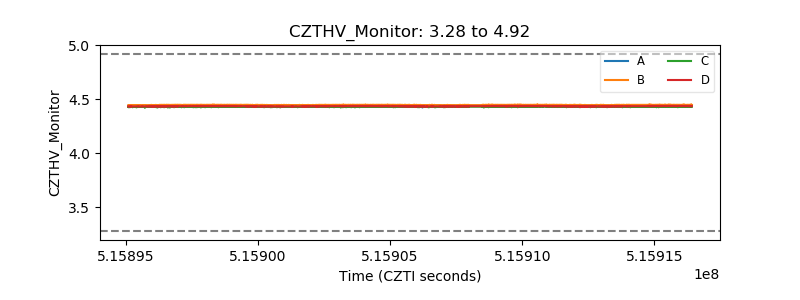 |
| D_VDD | 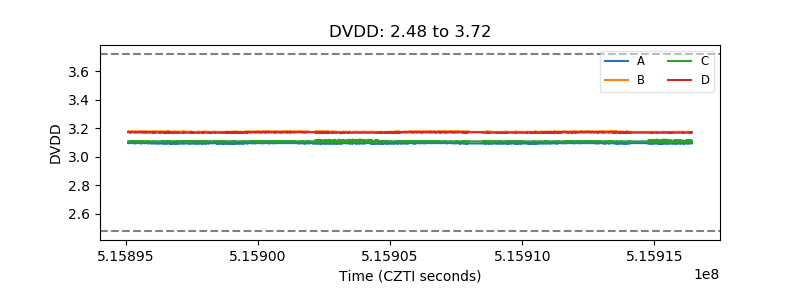 |
| Temperature 1 | 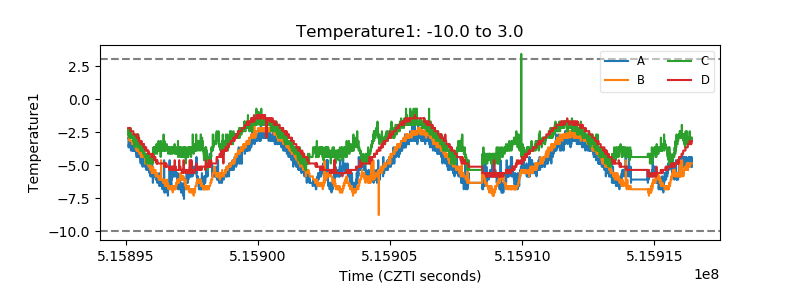 |
| Veto HV Monitor | 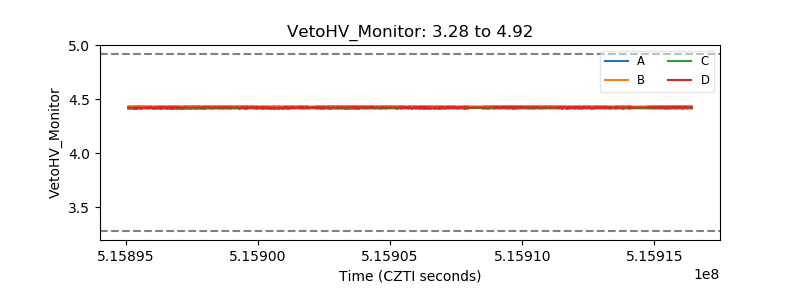 |
| Veto LLD | 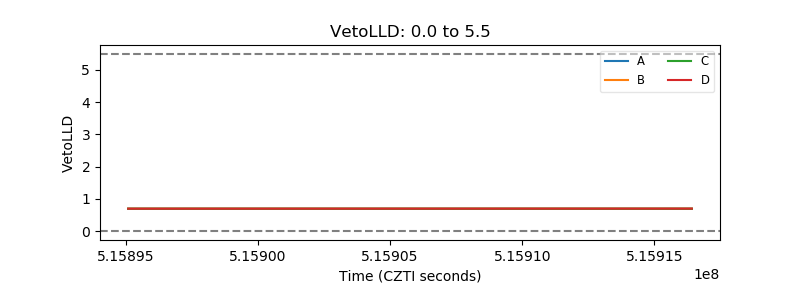 |
| Alpha Counter | 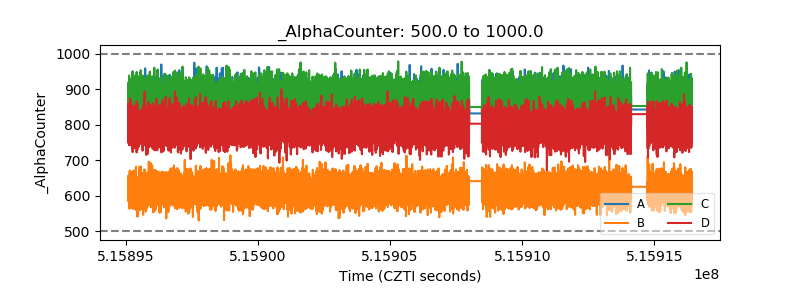 |
| _CPM_Rate | 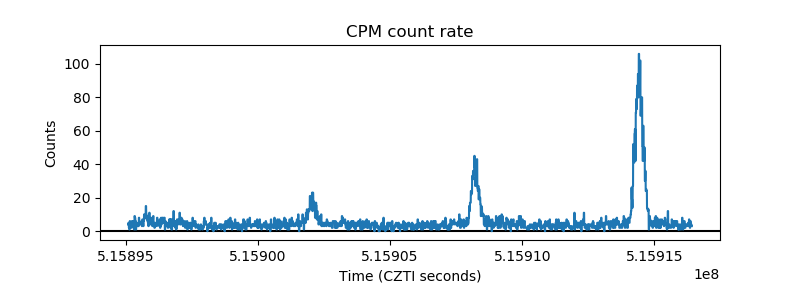 |
| CZT Counter | 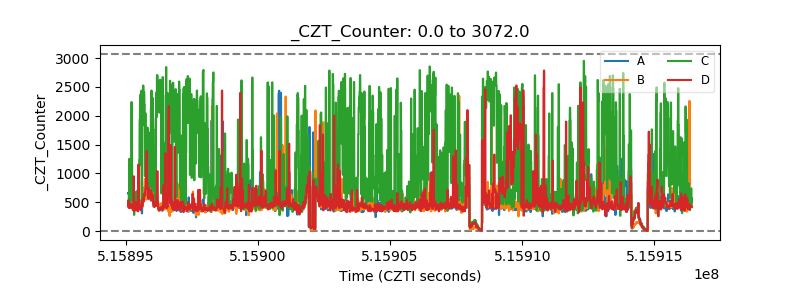 |
| +2.5 Volts monitor | 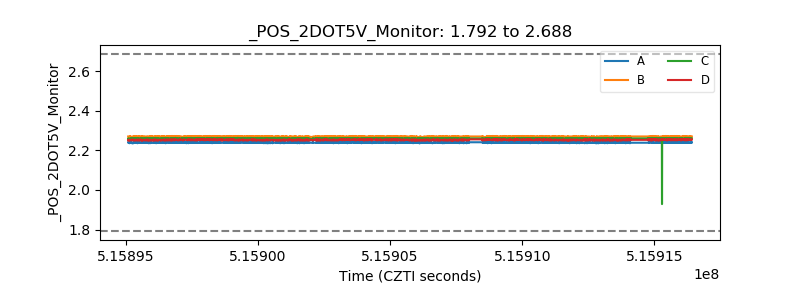 |
| +5 Volts monitor |  |
| _ROLL_ROT | 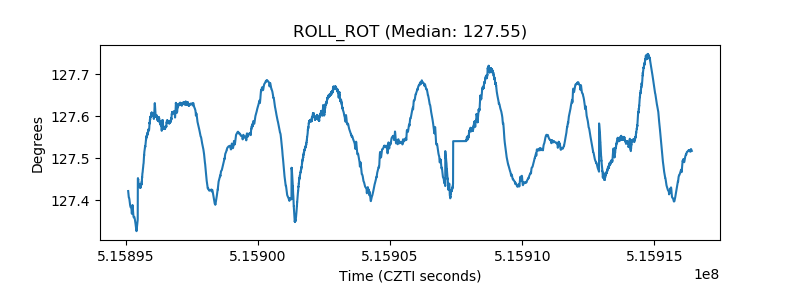 |
| _Roll_DEC | 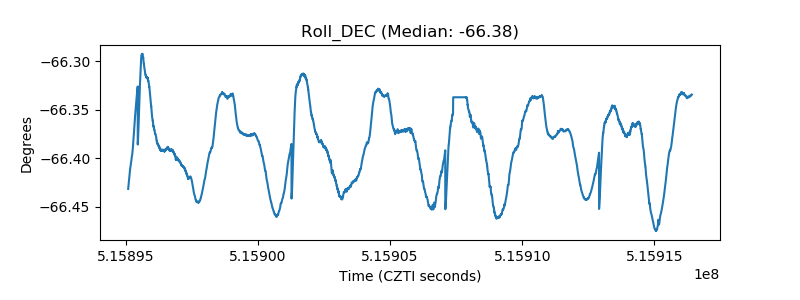 |
| _Roll_RA | 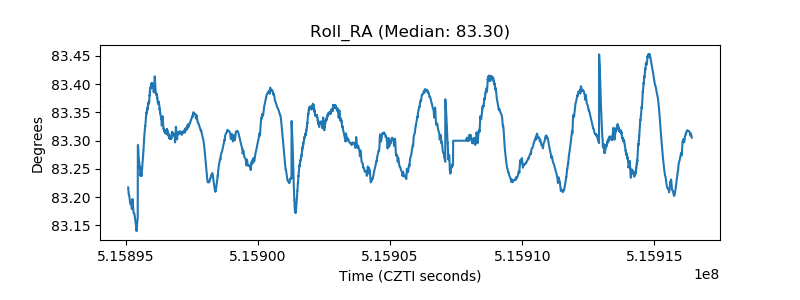 |
| Veto Counter | 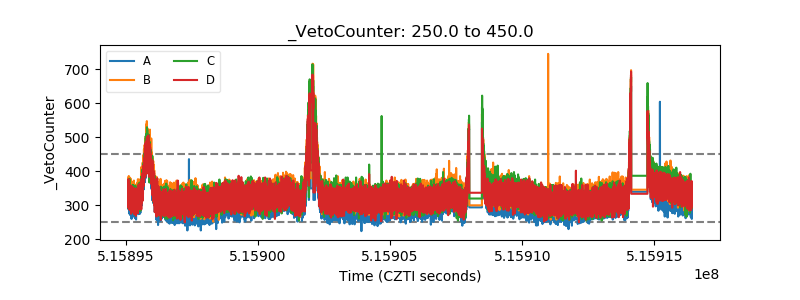 |