| Param | Original file | Final file |
|---|---|---|
| Filename | modeM0/AS1A14_102T01_9000006572_57407cztM0_level2.fits | modeM0/AS1A14_102T01_9000006572_57407cztM0_level2_quad_clean.evt |
| Size (bytes) | 524,010,240 | 89,910,720 |
| Size | 499.7 MB | 85.7 MB |
| Events in quadrant A | 6,662,399 | 594,172 |
| Events in quadrant B | 3,275,917 | 642,637 |
| Events in quadrant C | 5,734,367 | 518,063 |
| Events in quadrant D | 3,253,361 | 542,789 |
| Mode M0 | |||
|---|---|---|---|
| Quadrant | BADHDUFLAG | Total packets | Discarded packets |
| A | 0 | 24054 | 1 |
| B | 0 | 14121 | 1 |
| C | 0 | 21298 | 1 |
| D | 0 | 14004 | 1 |
| Mode M9 | |||
|---|---|---|---|
| Quadrant | BADHDUFLAG | Total packets | Discarded packets |
| A | 0 | 11 | 0 |
| B | 0 | 11 | 0 |
| C | 0 | 11 | 0 |
| D | 0 | 11 | 0 |
| Mode SS | |||
|---|---|---|---|
| Quadrant | BADHDUFLAG | Total packets | Discarded packets |
| A | 0 | 124 | 0 |
| B | 0 | 124 | 0 |
| C | 0 | 124 | 0 |
| D | 0 | 124 | 0 |
| Quadrant | Total seconds | Saturated seconds | Saturation percentage |
|---|---|---|---|
| A | 6082 | 262 | 4.307793% |
| B | 6082 | 93 | 1.529102% |
| C | 6081 | 811 | 13.336622% |
| D | 6082 | 117 | 1.923709% |
Noise dominated data is calculated using 1-second bins in cleaned event files. If a bin has >2000 counts, and if more than 50% of those come from <1% of pixels, then it is considered to be noise-dominated and hence unusable.
| Quadrant | # 1 sec bins | Bins with >0 counts | Bins with >2000 counts | High rate bins dominated by noise | Noise dominated (total time) | Noise dominated (detector-on time) | Marked lightcurve |
|---|---|---|---|---|---|---|---|
| A | 7212 | 6082 | 11 | 11 | 0.15% | 0.18% | 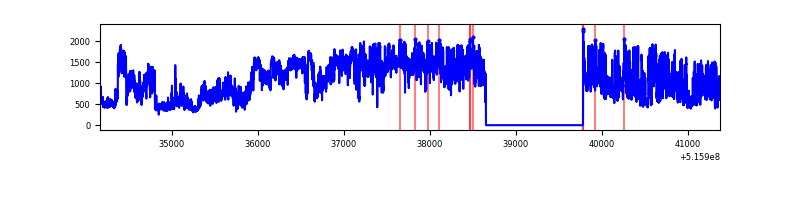 |
| B | 7212 | 6083 | 13 | 13 | 0.18% | 0.21% | 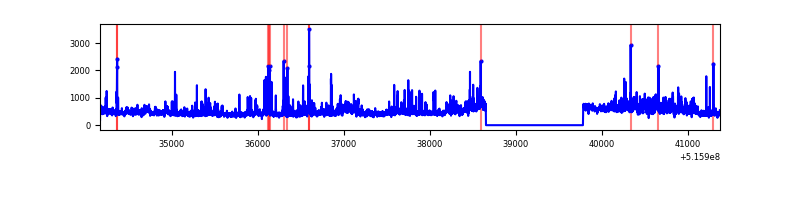 |
| C | 7211 | 6082 | 645 | 645 | 8.94% | 10.61% | 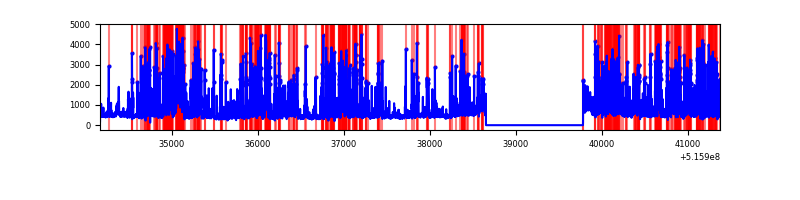 |
| D | 7212 | 6083 | 55 | 55 | 0.76% | 0.90% | 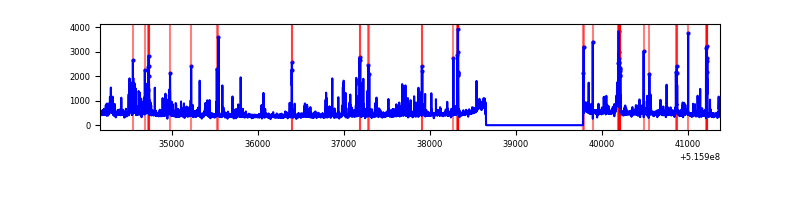 |
Top three noisy pixels from each quadrant. If the there are fewer than three noisy pixels in the level2.evt file, extra rows are filled as -1
| Pixel properties | Quadrant properties | ||||||
|---|---|---|---|---|---|---|---|
| Quadrant | DetID | PixID | Counts | Sigma | Mean | Median | Sigma |
| A | 0 | 12 | 4072442 | 24905.22 | 659 | 642 | 163.5 |
| A | 4 | 3 | 13315 | 77.51 | 659 | 642 | 163.5 |
| A | 3 | 14 | 11696 | 67.61 | 659 | 642 | 163.5 |
| B | 0 | 216 | 340485 | 2413.44 | 654 | 630 | 140.8 |
| B | 5 | 185 | 127003 | 897.42 | 654 | 630 | 140.8 |
| B | 0 | 245 | 64322 | 452.3 | 654 | 630 | 140.8 |
| C | 15 | 224 | 3058378 | 18421.79 | 603 | 598 | 166.0 |
| C | 14 | 254 | 139353 | 835.94 | 603 | 598 | 166.0 |
| C | 6 | 223 | 54693 | 325.9 | 603 | 598 | 166.0 |
| D | 2 | 249 | 177654 | 988.4 | 643 | 615 | 179.1 |
| D | 8 | 240 | 124459 | 691.41 | 643 | 615 | 179.1 |
| D | 15 | 142 | 85925 | 476.28 | 643 | 615 | 179.1 |
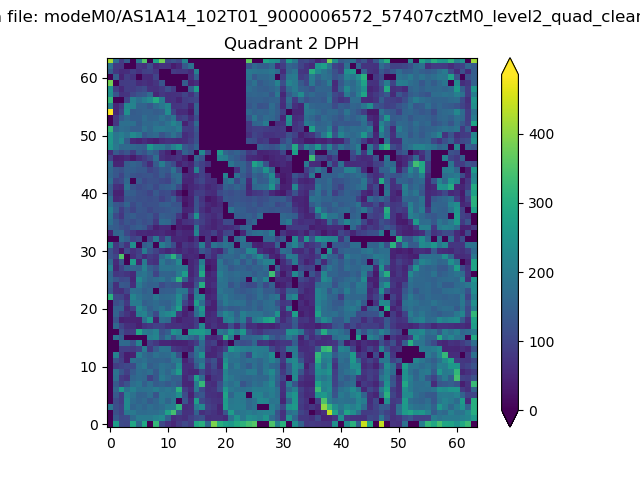
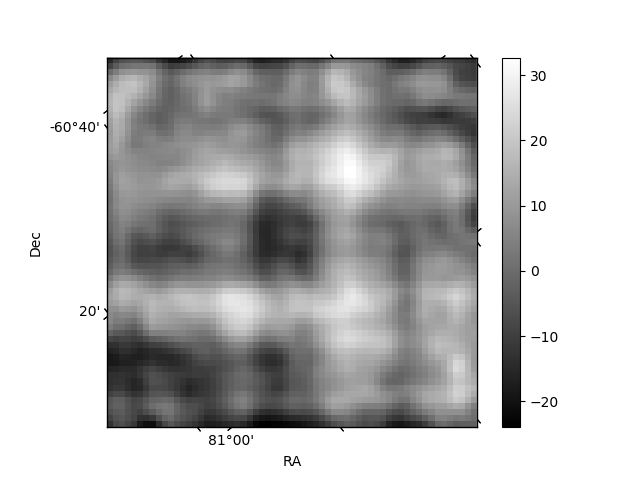
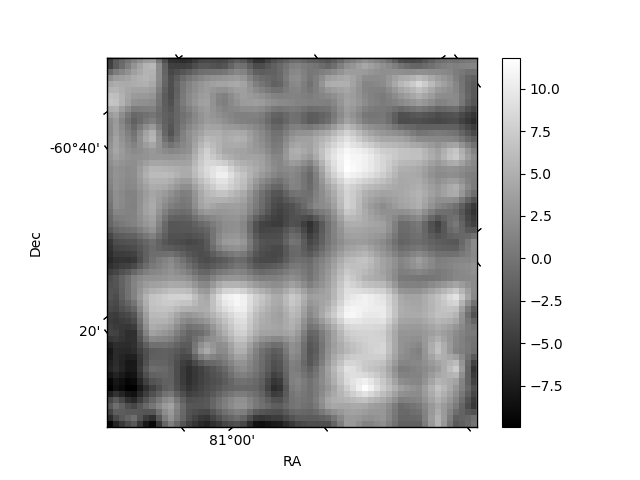
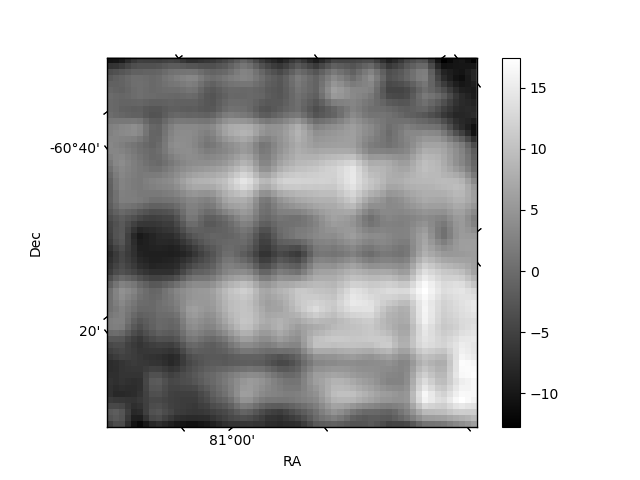
Histogram calculated using DETX and DETY for each event in the final _common_clean file
| Quadrant A | 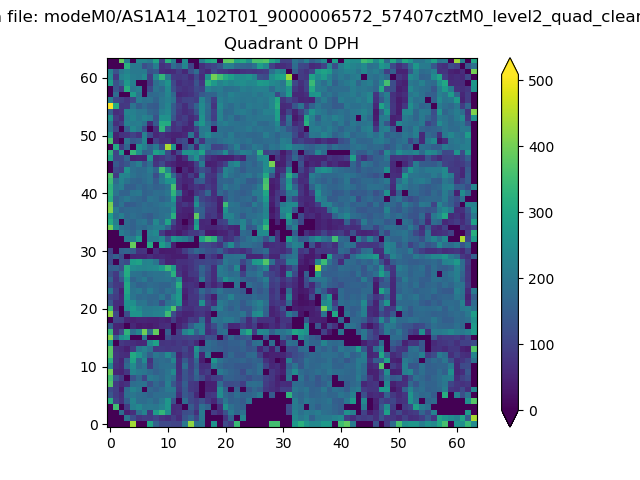 |
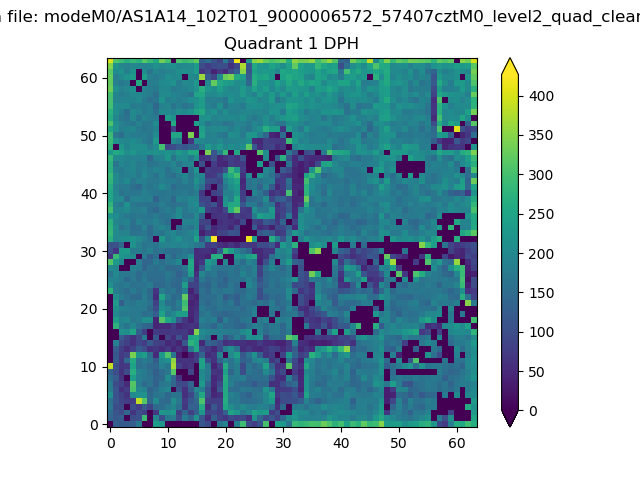 |
Quadrant B |
|---|---|---|---|
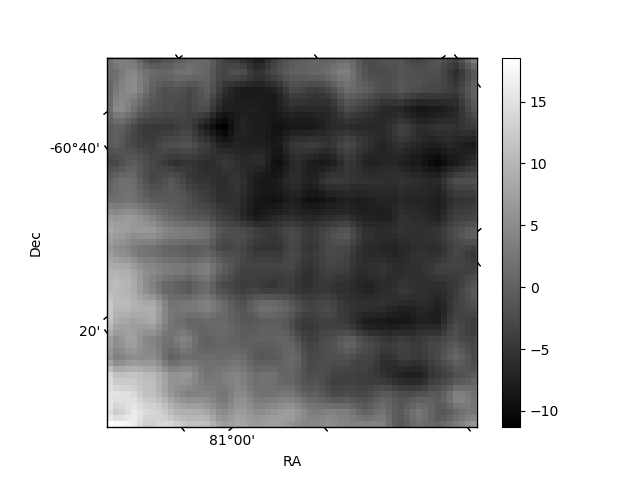
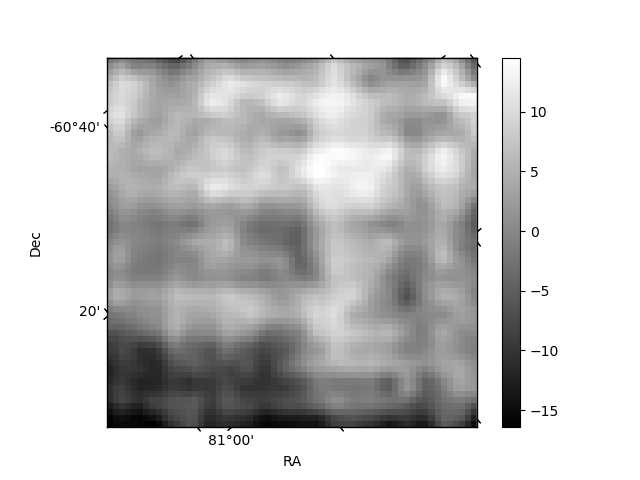
| Quadrant D | 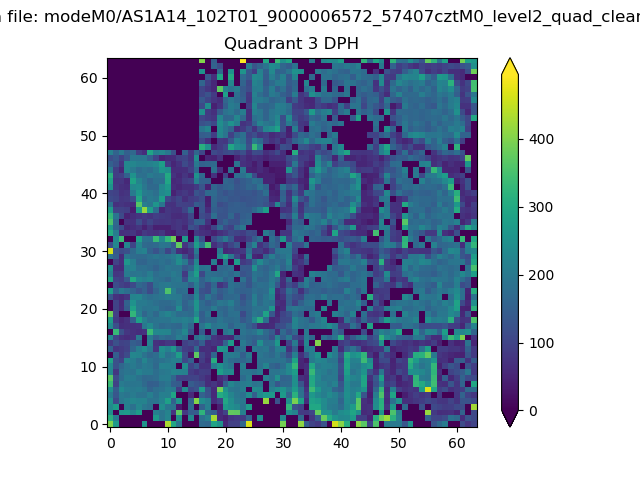 |
 |
Quadrant C |
| Plot type | Count rate plots | Images |
|---|---|---|
| Comparison with Poisson distribution Blue bars denote a histogram of data divided into 1 sec bins. Red curve is a Poisson curve with rate = median count rate of data. |
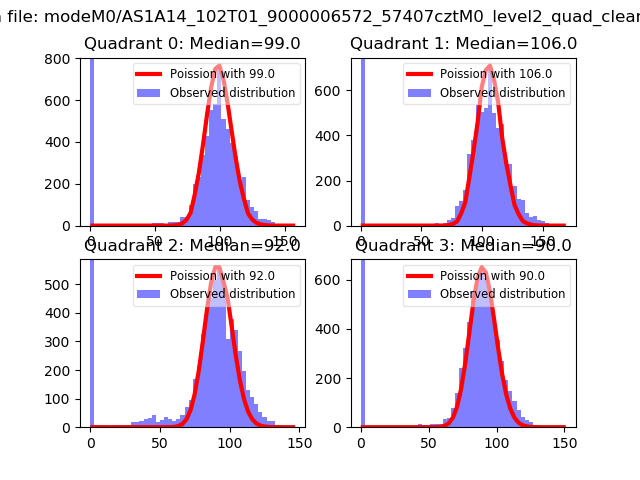 |
 |
| Quadrant-wise count rates Data is divided into 100 sec bins |
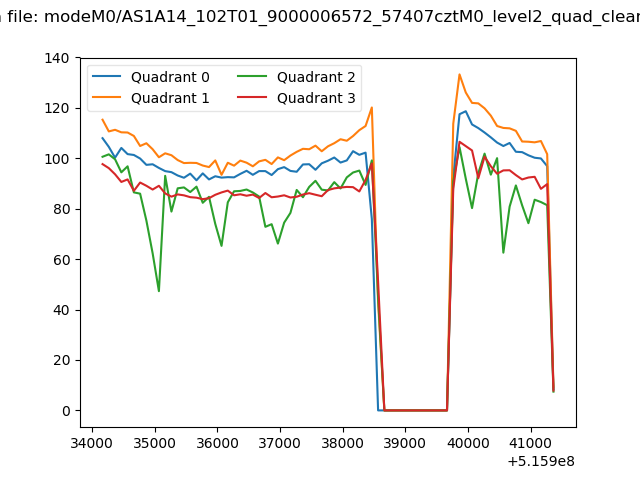 |
|
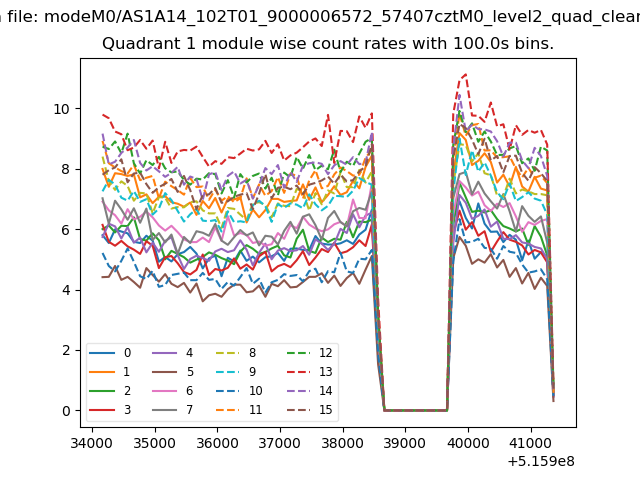
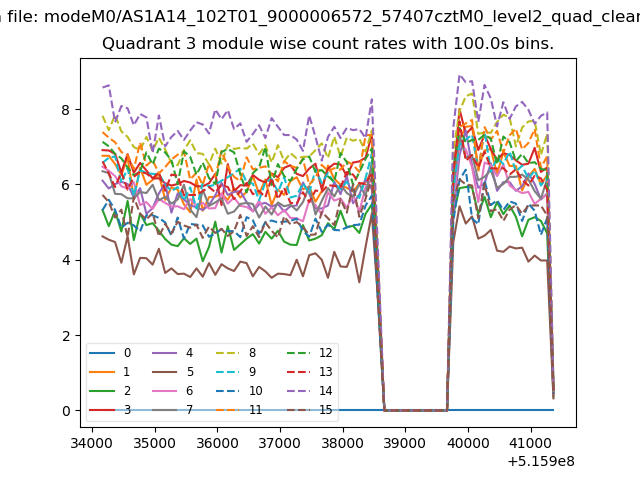
| Module-wise count rates for Quadrant A Data is divided into 100 sec bins |
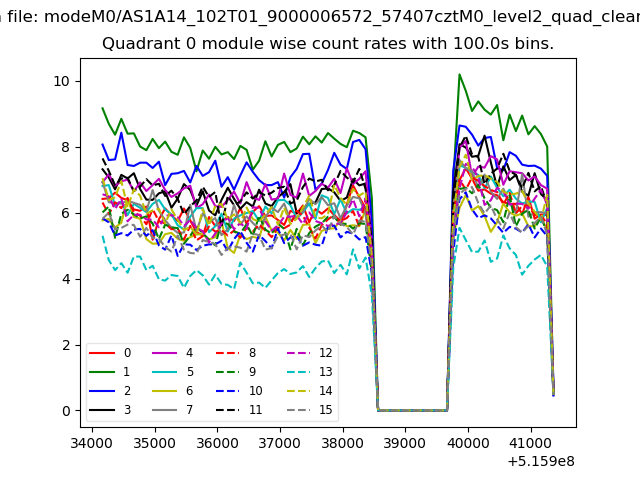 |
 |
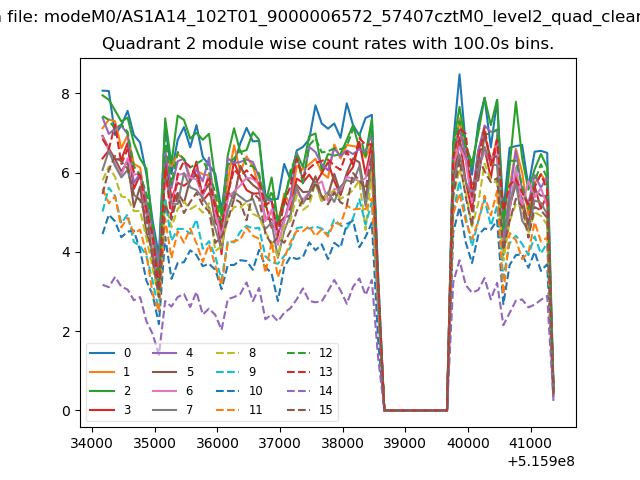
| Module-wise count rates for Quadrant B Data is divided into 100 sec bins |
 |
 |
| Module-wise count rates for Quadrant C Data is divided into 100 sec bins |
 |
 |
| Module-wise count rates for Quadrant D Data is divided into 100 sec bins |
 |
 |
| Parameter | Plot |
|---|---|
| CZT HV Monitor | 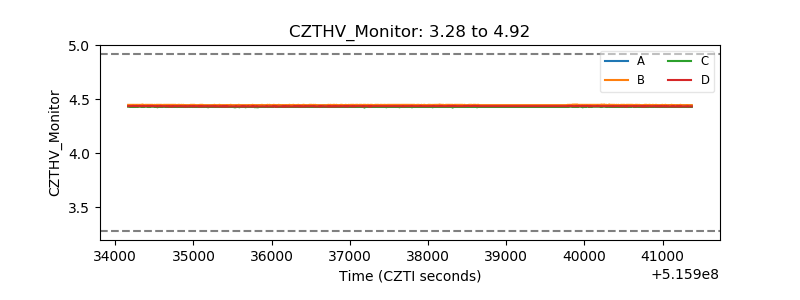 |
| D_VDD | 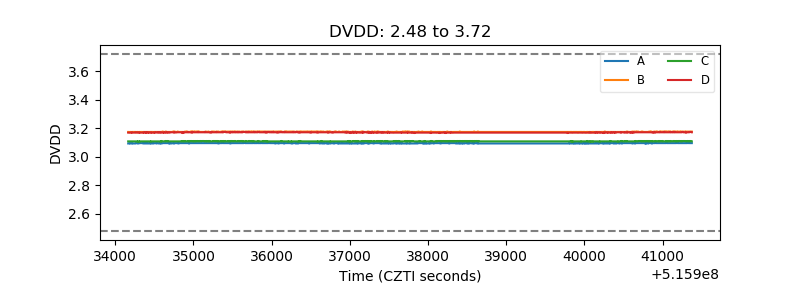 |
| Temperature 1 | 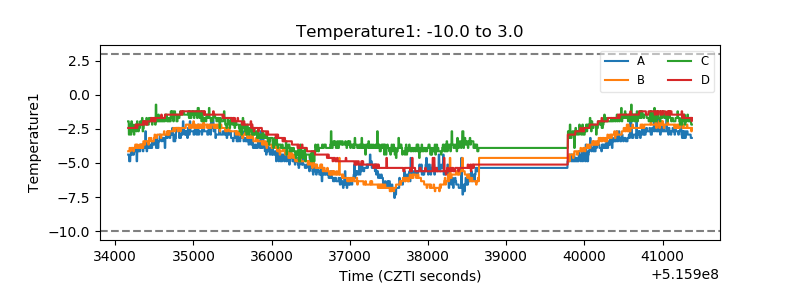 |
| Veto HV Monitor | 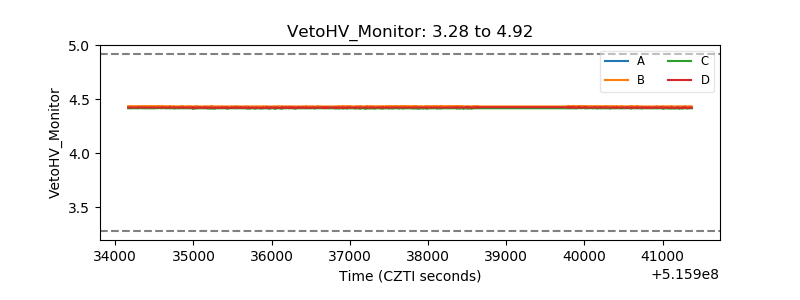 |
| Veto LLD | 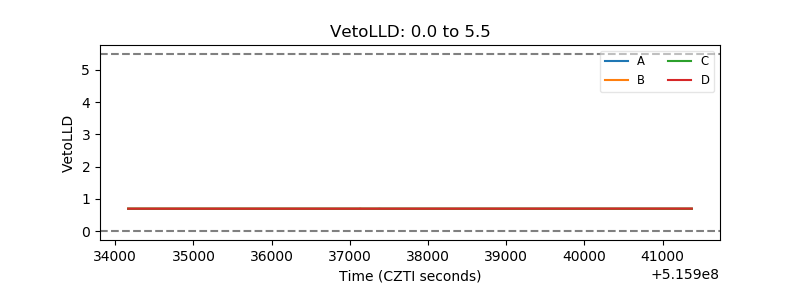 |
| Alpha Counter | 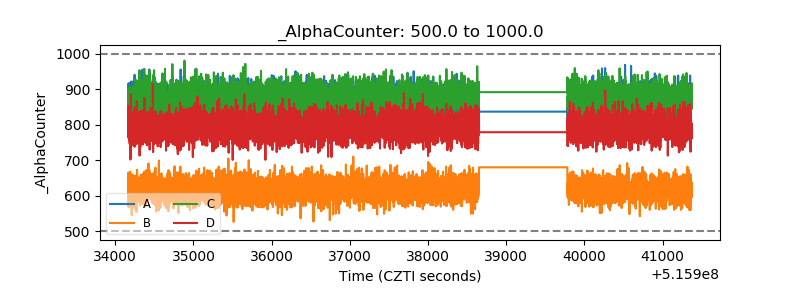 |
| _CPM_Rate | 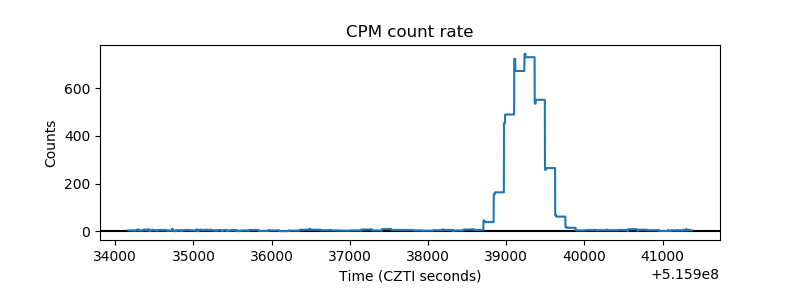 |
| CZT Counter | 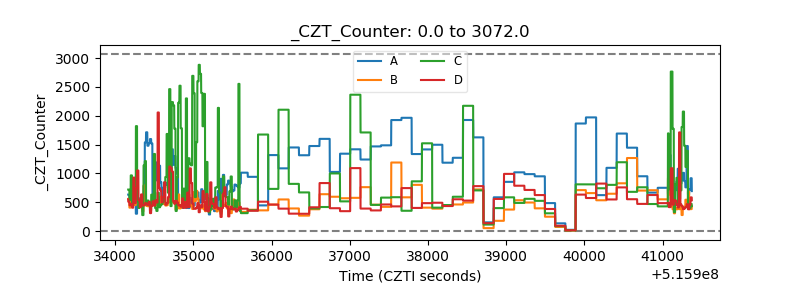 |
| +2.5 Volts monitor |  |
| +5 Volts monitor |  |
| _ROLL_ROT | 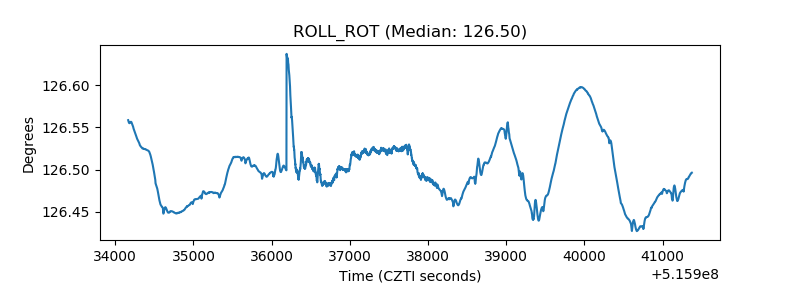 |
| _Roll_DEC | 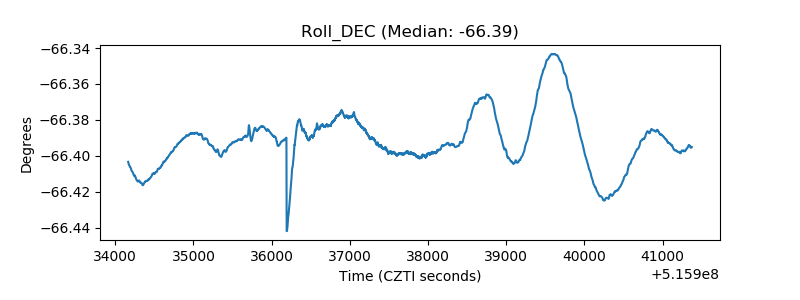 |
| _Roll_RA | 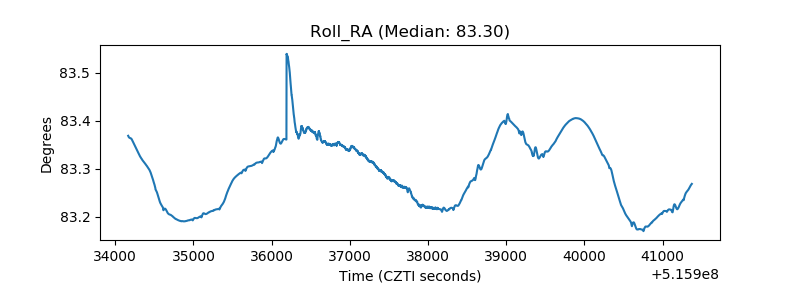 |
| Veto Counter | 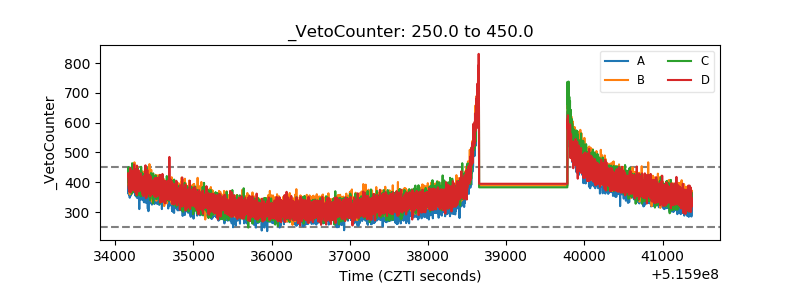 |