| Param | Original file | Final file |
|---|---|---|
| Filename | modeM0/AS1A14_102T01_9000006572_57408cztM0_level2.fits | modeM0/AS1A14_102T01_9000006572_57408cztM0_level2_quad_clean.evt |
| Size (bytes) | 509,065,920 | 92,779,200 |
| Size | 485.5 MB | 88.5 MB |
| Events in quadrant A | 4,726,662 | 628,350 |
| Events in quadrant B | 3,451,924 | 668,066 |
| Events in quadrant C | 6,554,691 | 519,311 |
| Events in quadrant D | 3,623,310 | 555,779 |
| Mode M0 | |||
|---|---|---|---|
| Quadrant | BADHDUFLAG | Total packets | Discarded packets |
| A | 0 | 18429 | 1 |
| B | 0 | 14832 | 1 |
| C | 0 | 23874 | 1 |
| D | 0 | 15297 | 2 |
| Mode M9 | |||
|---|---|---|---|
| Quadrant | BADHDUFLAG | Total packets | Discarded packets |
| A | 0 | 12 | 0 |
| B | 0 | 12 | 0 |
| C | 0 | 12 | 0 |
| D | 0 | 12 | 0 |
| Mode SS | |||
|---|---|---|---|
| Quadrant | BADHDUFLAG | Total packets | Discarded packets |
| A | 0 | 126 | 0 |
| B | 0 | 126 | 0 |
| C | 0 | 126 | 0 |
| D | 0 | 126 | 0 |
| Quadrant | Total seconds | Saturated seconds | Saturation percentage |
|---|---|---|---|
| A | 6279 | 118 | 1.879280% |
| B | 6280 | 100 | 1.592357% |
| C | 6280 | 1075 | 17.117834% |
| D | 6279 | 203 | 3.232999% |
Noise dominated data is calculated using 1-second bins in cleaned event files. If a bin has >2000 counts, and if more than 50% of those come from <1% of pixels, then it is considered to be noise-dominated and hence unusable.
| Quadrant | # 1 sec bins | Bins with >0 counts | Bins with >2000 counts | High rate bins dominated by noise | Noise dominated (total time) | Noise dominated (detector-on time) | Marked lightcurve |
|---|---|---|---|---|---|---|---|
| A | 7429 | 6280 | 1 | 1 | 0.01% | 0.02% | 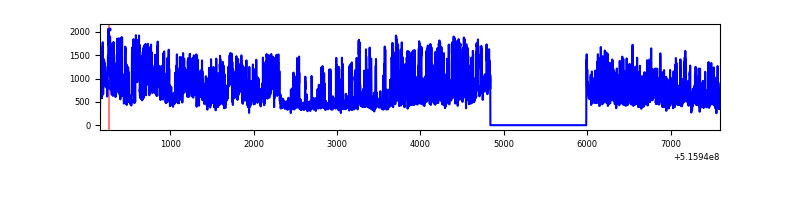 |
| B | 7430 | 6281 | 20 | 20 | 0.27% | 0.32% | 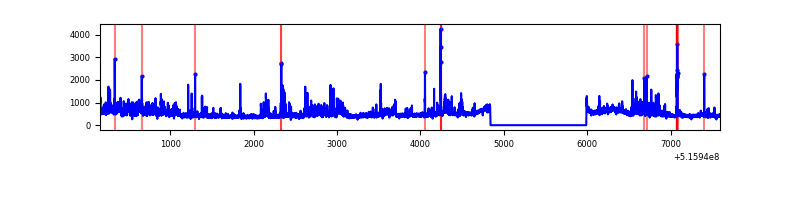 |
| C | 7430 | 6281 | 837 | 837 | 11.27% | 13.33% | 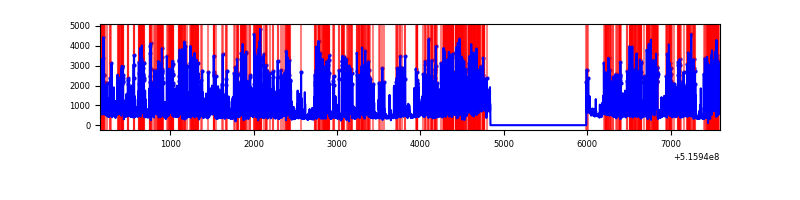 |
| D | 7429 | 6280 | 137 | 137 | 1.84% | 2.18% | 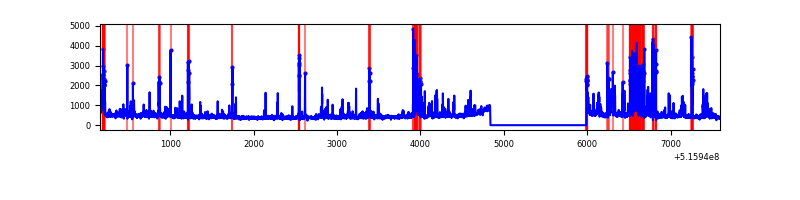 |
Top three noisy pixels from each quadrant. If the there are fewer than three noisy pixels in the level2.evt file, extra rows are filled as -1
| Pixel properties | Quadrant properties | ||||||
|---|---|---|---|---|---|---|---|
| Quadrant | DetID | PixID | Counts | Sigma | Mean | Median | Sigma |
| A | 0 | 12 | 1974479 | 11540.65 | 690 | 672 | 171.0 |
| A | 8 | 227 | 24417 | 138.83 | 690 | 672 | 171.0 |
| A | 4 | 3 | 20523 | 116.07 | 690 | 672 | 171.0 |
| B | 0 | 216 | 447044 | 3084.1 | 677 | 653 | 144.7 |
| B | 0 | 63 | 93448 | 641.12 | 677 | 653 | 144.7 |
| B | 5 | 185 | 73171 | 501.02 | 677 | 653 | 144.7 |
| C | 15 | 224 | 3927336 | 23465.54 | 609 | 603 | 167.3 |
| C | 14 | 254 | 93381 | 554.43 | 609 | 603 | 167.3 |
| C | 6 | 223 | 45438 | 267.93 | 609 | 603 | 167.3 |
| D | 8 | 240 | 297122 | 1597.09 | 659 | 630 | 185.6 |
| D | 15 | 142 | 164621 | 883.36 | 659 | 630 | 185.6 |
| D | 2 | 249 | 159537 | 855.97 | 659 | 630 | 185.6 |
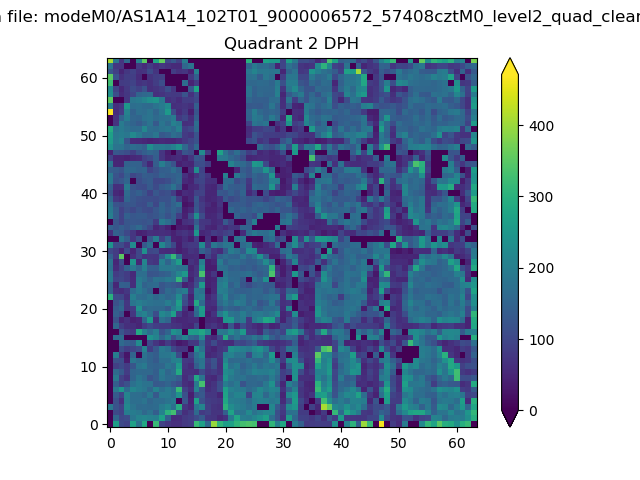
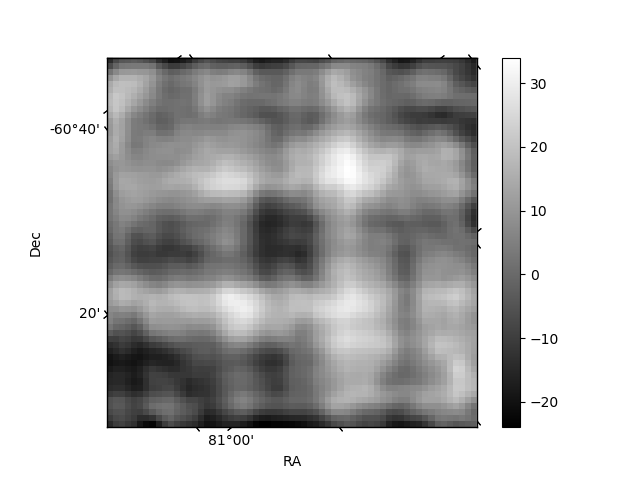
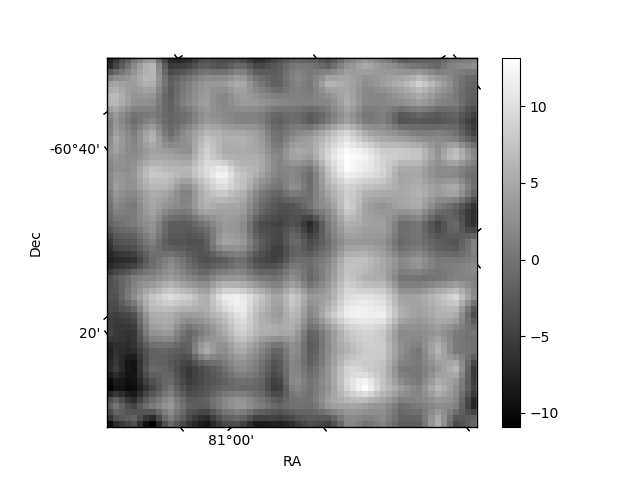
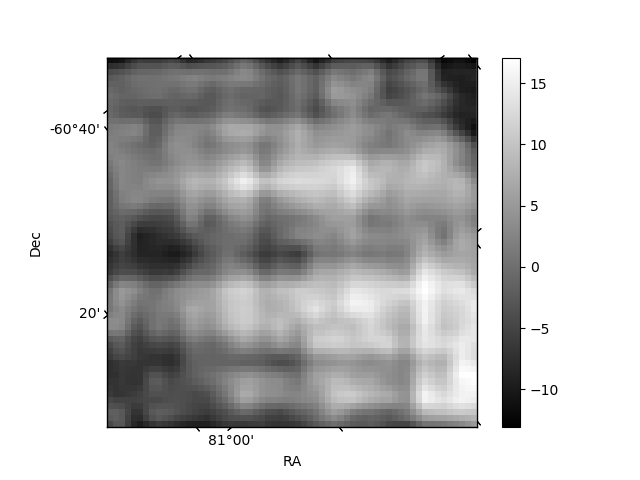
Histogram calculated using DETX and DETY for each event in the final _common_clean file
| Quadrant A | 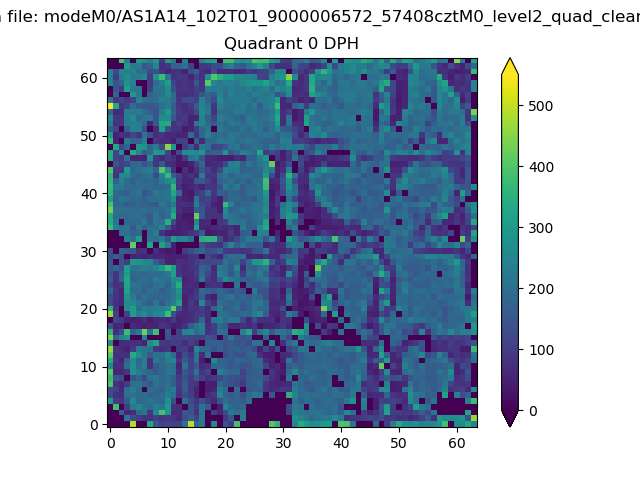 |
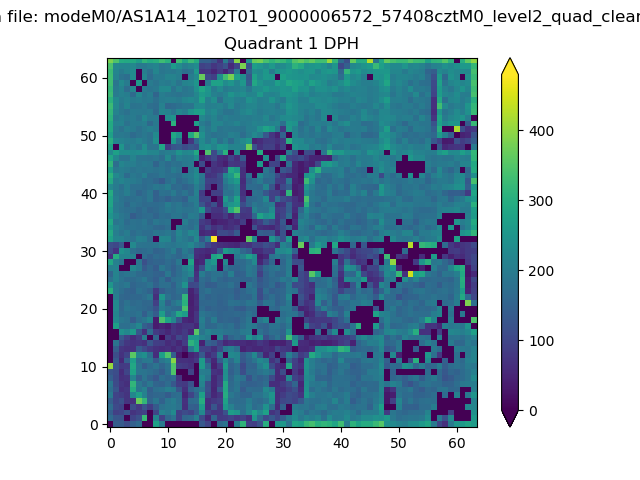 |
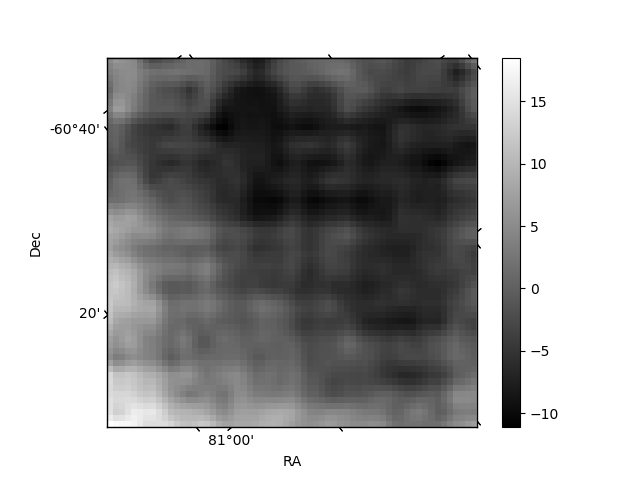
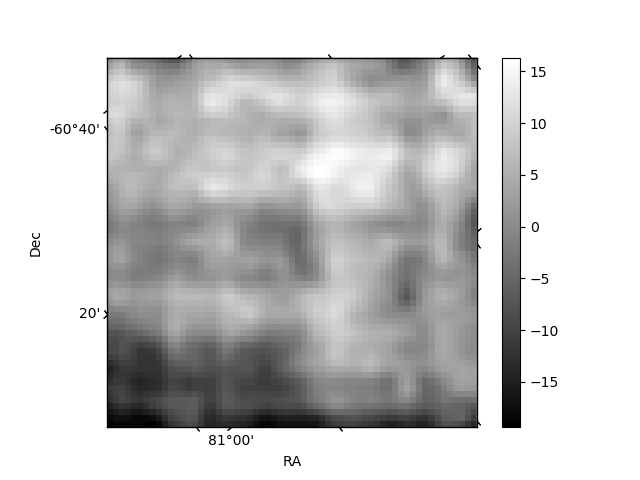
Quadrant B |
|---|---|---|---|
| Quadrant D | 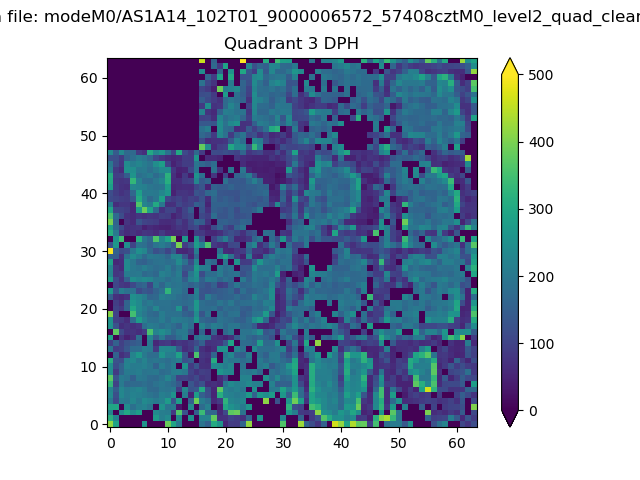 |
 |
Quadrant C |
| Plot type | Count rate plots | Images |
|---|---|---|
| Comparison with Poisson distribution Blue bars denote a histogram of data divided into 1 sec bins. Red curve is a Poisson curve with rate = median count rate of data. |
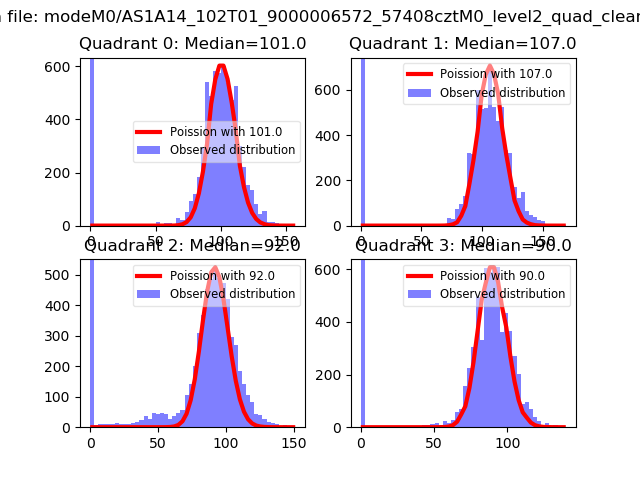 |
 |
| Quadrant-wise count rates Data is divided into 100 sec bins |
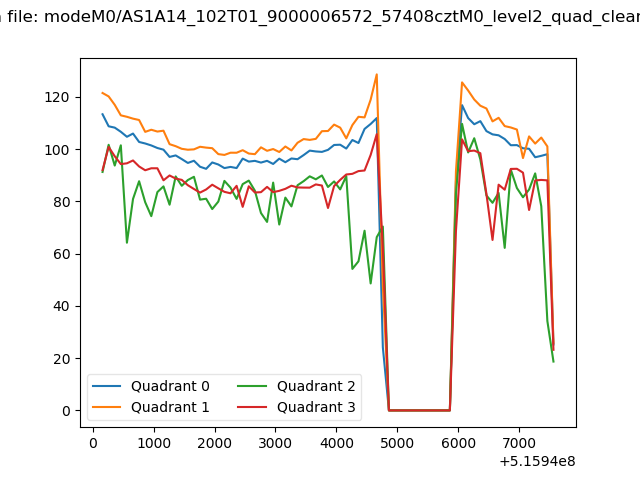 |
|
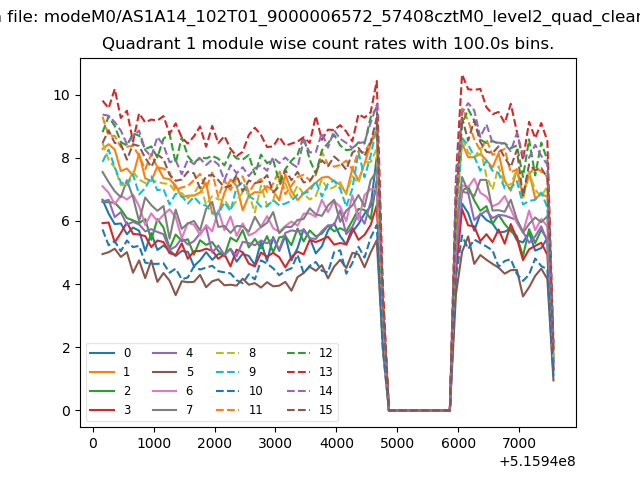
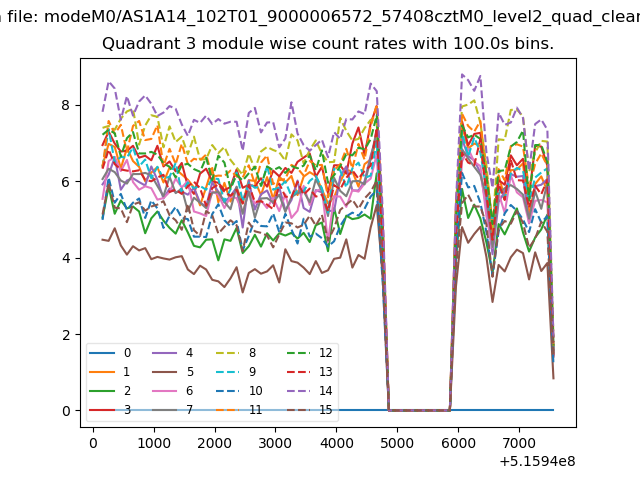
| Module-wise count rates for Quadrant A Data is divided into 100 sec bins |
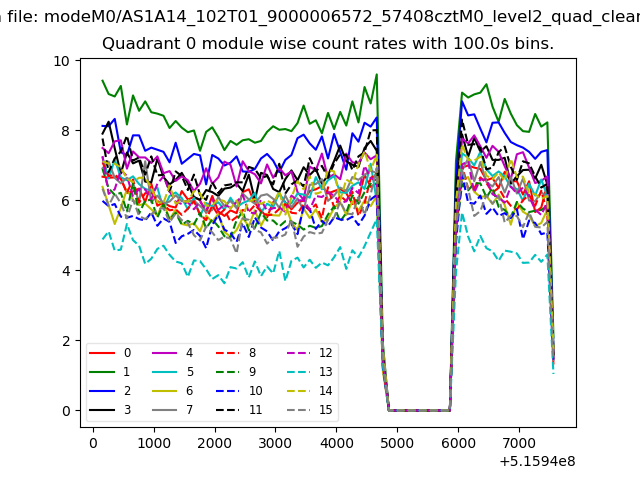 |
 |
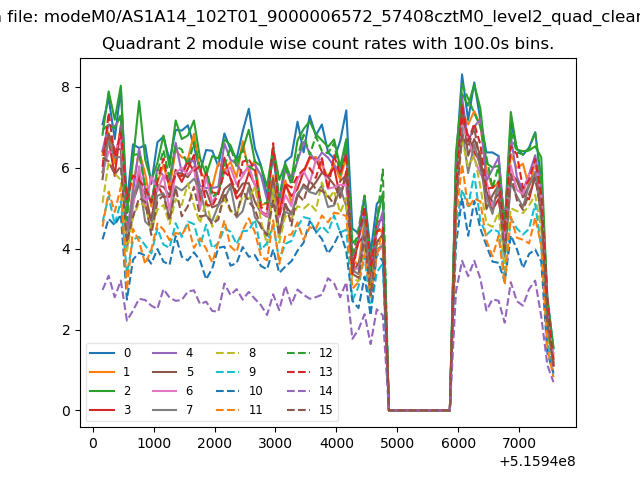
| Module-wise count rates for Quadrant B Data is divided into 100 sec bins |
 |
 |
| Module-wise count rates for Quadrant C Data is divided into 100 sec bins |
 |
 |
| Module-wise count rates for Quadrant D Data is divided into 100 sec bins |
 |
 |
| Parameter | Plot |
|---|---|
| CZT HV Monitor | 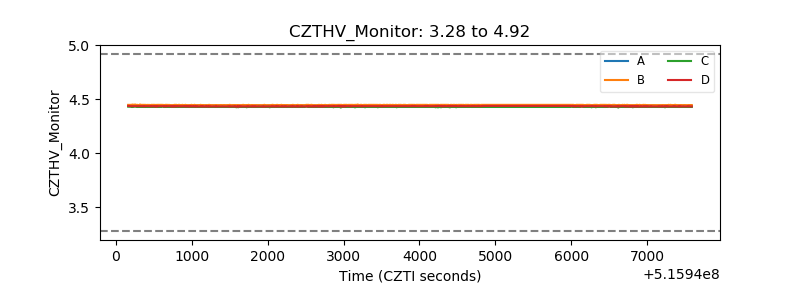 |
| D_VDD | 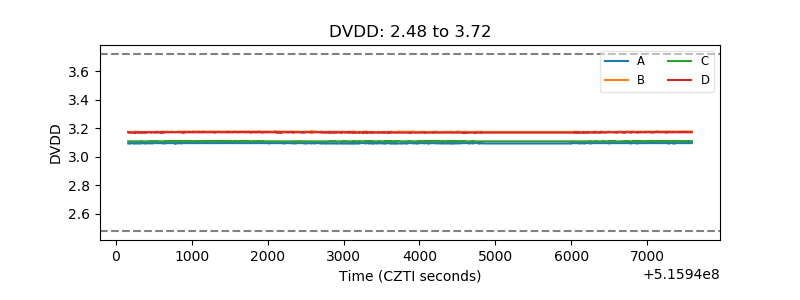 |
| Temperature 1 | 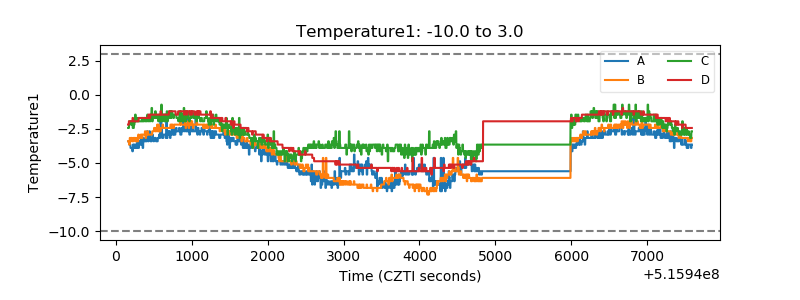 |
| Veto HV Monitor | 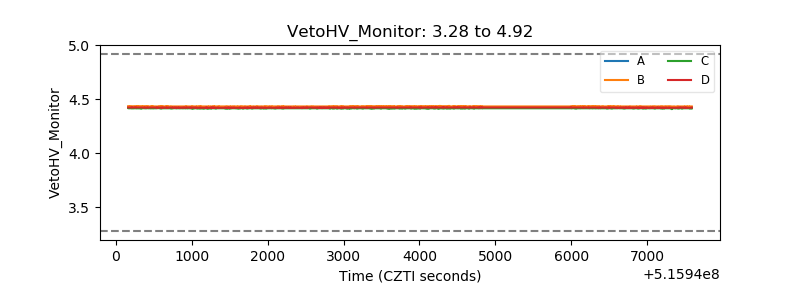 |
| Veto LLD | 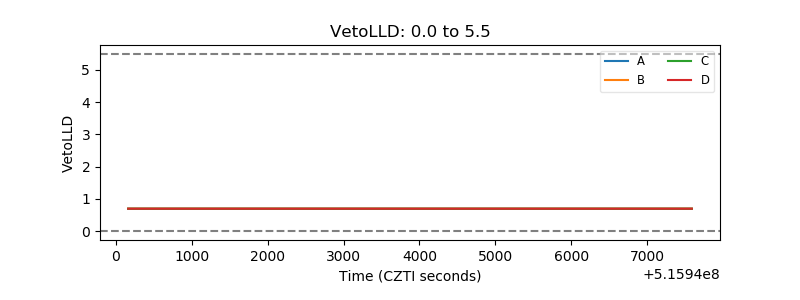 |
| Alpha Counter | 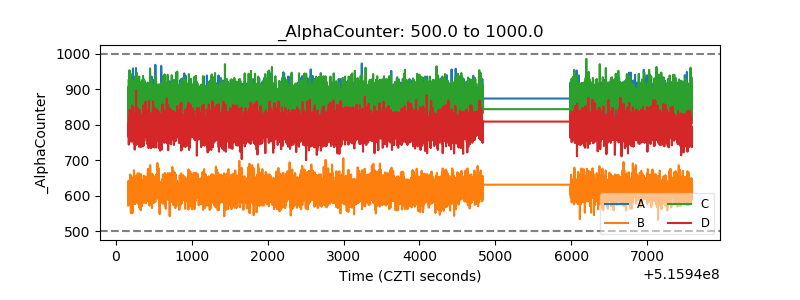 |
| _CPM_Rate | 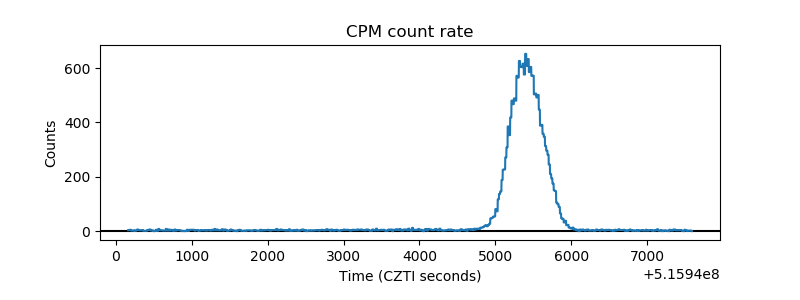 |
| CZT Counter | 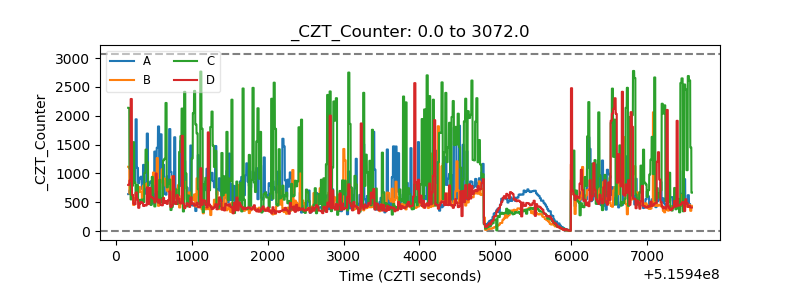 |
| +2.5 Volts monitor |  |
| +5 Volts monitor |  |
| _ROLL_ROT | 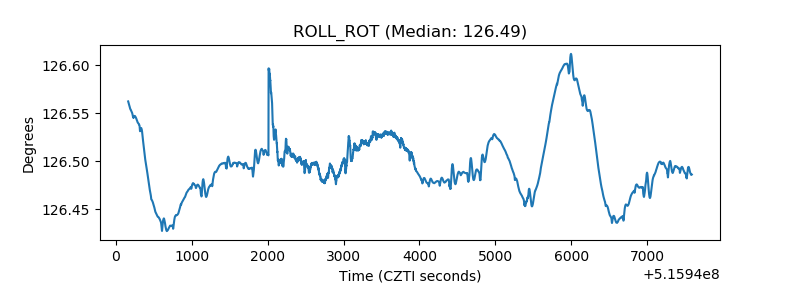 |
| _Roll_DEC | 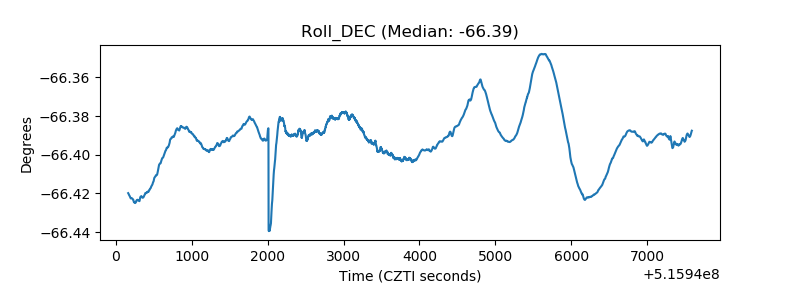 |
| _Roll_RA | 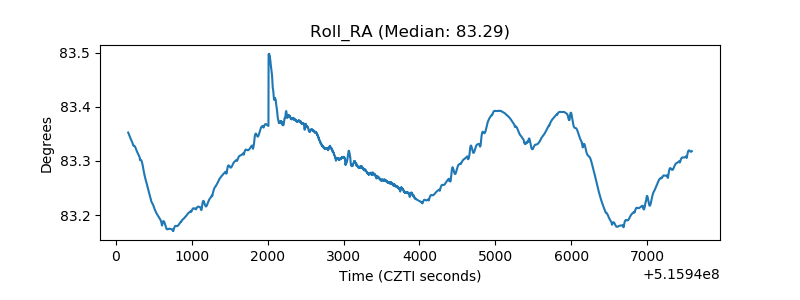 |
| Veto Counter | 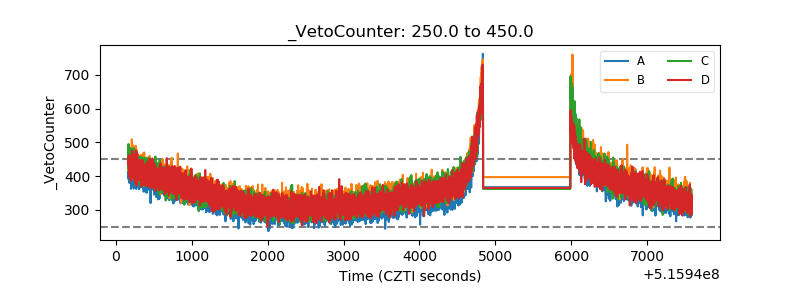 |