| Param | Original file | Final file |
|---|---|---|
| Filename | modeM0/AS1A14_102T01_9000006572_57410cztM0_level2.fits | modeM0/AS1A14_102T01_9000006572_57410cztM0_level2_quad_clean.evt |
| Size (bytes) | 551,623,680 | 86,417,280 |
| Size | 526.1 MB | 82.4 MB |
| Events in quadrant A | 4,712,991 | 579,331 |
| Events in quadrant B | 3,635,573 | 615,685 |
| Events in quadrant C | 7,418,744 | 453,695 |
| Events in quadrant D | 4,132,741 | 500,946 |
| Mode M0 | |||
|---|---|---|---|
| Quadrant | BADHDUFLAG | Total packets | Discarded packets |
| A | 0 | 18586 | 2 |
| B | 0 | 15429 | 2 |
| C | 0 | 26764 | 2 |
| D | 0 | 17104 | 2 |
| Mode M9 | |||
|---|---|---|---|
| Quadrant | BADHDUFLAG | Total packets | Discarded packets |
| A | 0 | 10 | 0 |
| B | 0 | 10 | 0 |
| C | 0 | 10 | 0 |
| D | 0 | 10 | 0 |
| Mode SS | |||
|---|---|---|---|
| Quadrant | BADHDUFLAG | Total packets | Discarded packets |
| A | 0 | 136 | 0 |
| B | 0 | 136 | 0 |
| C | 0 | 136 | 0 |
| D | 0 | 136 | 0 |
| Quadrant | Total seconds | Saturated seconds | Saturation percentage |
|---|---|---|---|
| A | 6692 | 71 | 1.060968% |
| B | 6693 | 79 | 1.180338% |
| C | 6693 | 1440 | 21.515016% |
| D | 6692 | 209 | 3.123132% |
Noise dominated data is calculated using 1-second bins in cleaned event files. If a bin has >2000 counts, and if more than 50% of those come from <1% of pixels, then it is considered to be noise-dominated and hence unusable.
| Quadrant | # 1 sec bins | Bins with >0 counts | Bins with >2000 counts | High rate bins dominated by noise | Noise dominated (total time) | Noise dominated (detector-on time) | Marked lightcurve |
|---|---|---|---|---|---|---|---|
| A | 7946 | 6967 | 14 | 14 | 0.18% | 0.20% | 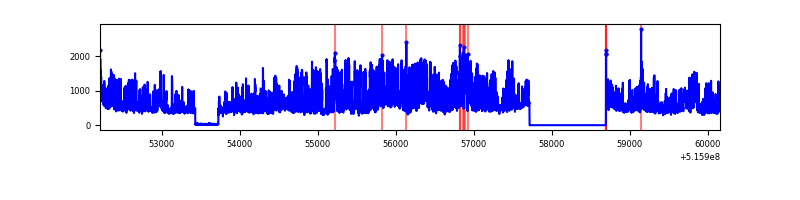 |
| B | 7947 | 6968 | 39 | 39 | 0.49% | 0.56% | 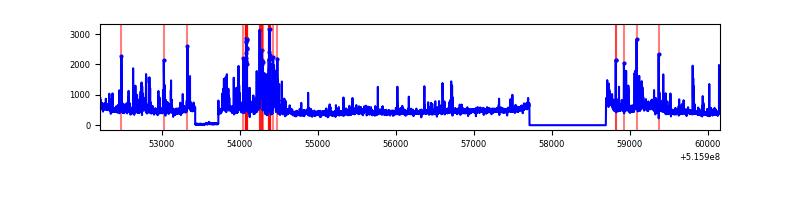 |
| C | 7947 | 6955 | 1197 | 1197 | 15.06% | 17.21% | 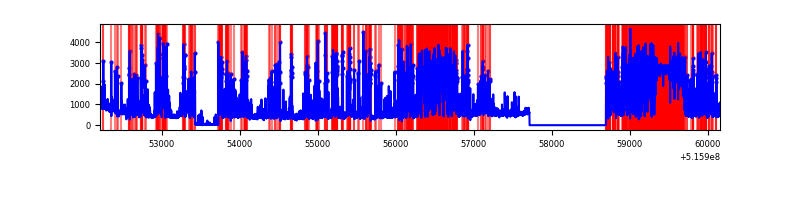 |
| D | 7946 | 6967 | 173 | 173 | 2.18% | 2.48% | 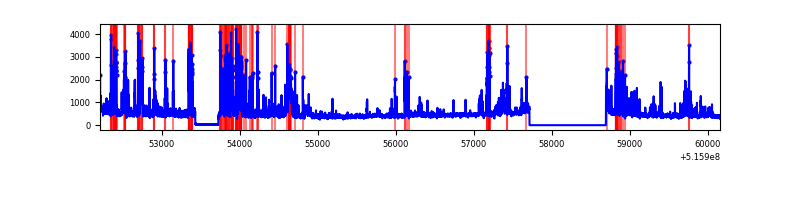 |
Top three noisy pixels from each quadrant. If the there are fewer than three noisy pixels in the level2.evt file, extra rows are filled as -1
| Pixel properties | Quadrant properties | ||||||
|---|---|---|---|---|---|---|---|
| Quadrant | DetID | PixID | Counts | Sigma | Mean | Median | Sigma |
| A | 0 | 12 | 1836863 | 10420.4 | 716 | 700 | 176.2 |
| A | 3 | 14 | 30607 | 169.73 | 716 | 700 | 176.2 |
| A | 4 | 3 | 23326 | 128.4 | 716 | 700 | 176.2 |
| B | 0 | 216 | 291034 | 1947.44 | 706 | 682 | 149.1 |
| B | 5 | 185 | 166677 | 1113.36 | 706 | 682 | 149.1 |
| B | 0 | 63 | 128098 | 854.6 | 706 | 682 | 149.1 |
| C | 15 | 224 | 3646298 | 21794.24 | 615 | 608 | 167.3 |
| C | 12 | 249 | 969214 | 5790.41 | 615 | 608 | 167.3 |
| C | 6 | 223 | 108994 | 647.94 | 615 | 608 | 167.3 |
| D | 8 | 240 | 698025 | 3609.86 | 680 | 647 | 193.2 |
| D | 3 | 12 | 238951 | 1233.54 | 680 | 647 | 193.2 |
| D | 3 | 224 | 182946 | 943.64 | 680 | 647 | 193.2 |
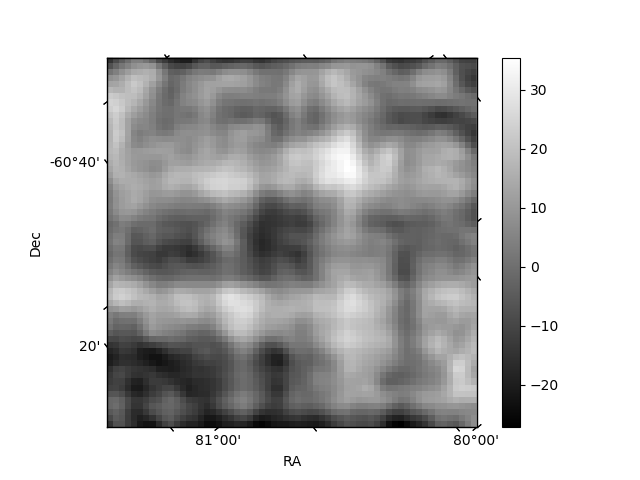
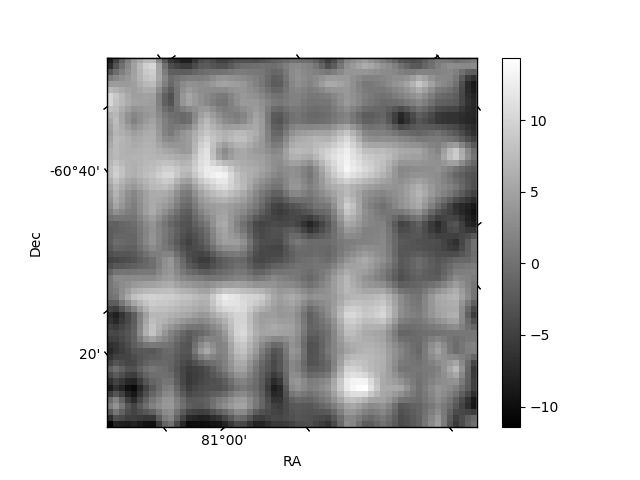
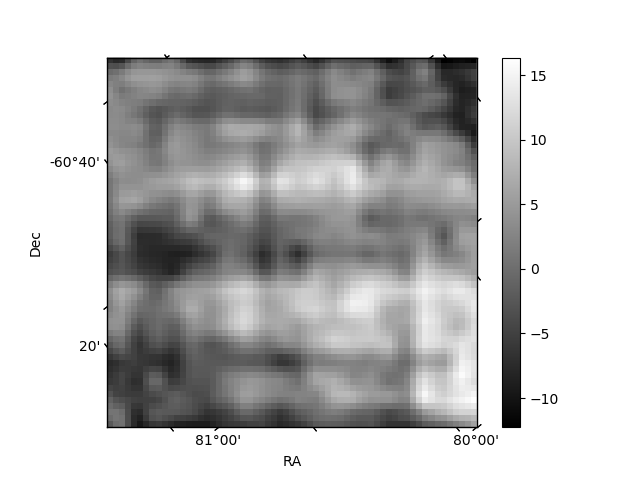
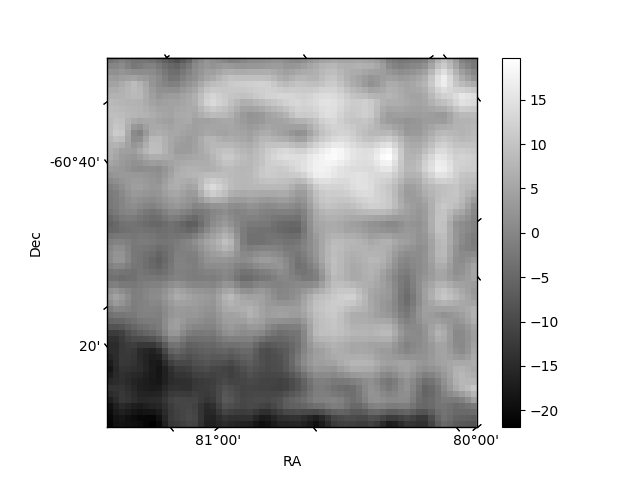
Histogram calculated using DETX and DETY for each event in the final _common_clean file
| Quadrant A | 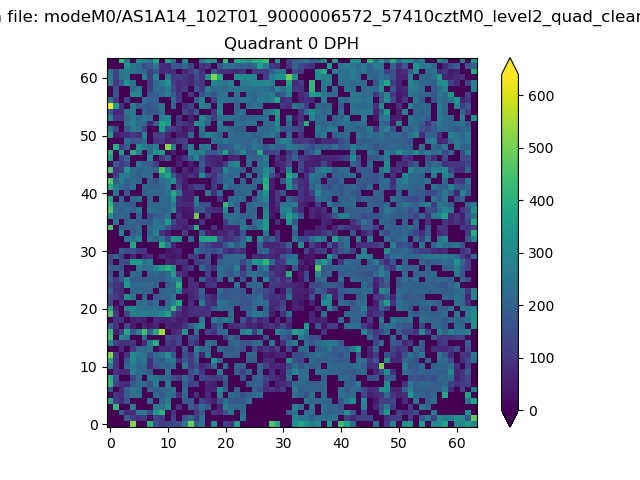 |
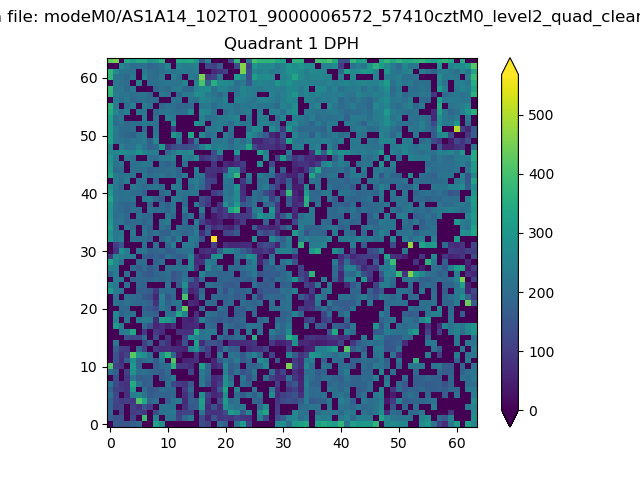 |
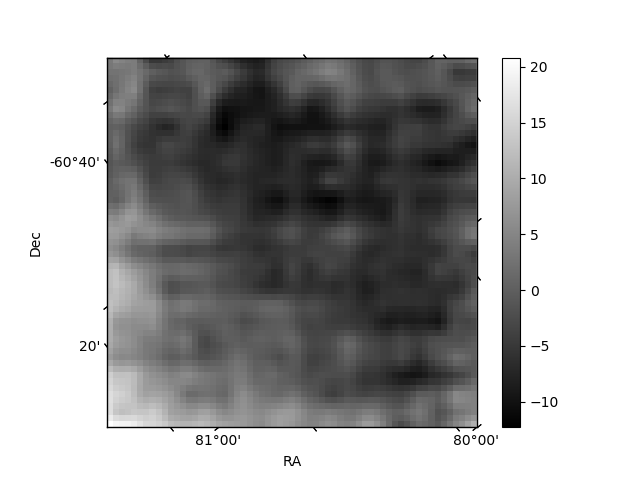
Quadrant B |
|---|---|---|---|
| Quadrant D | 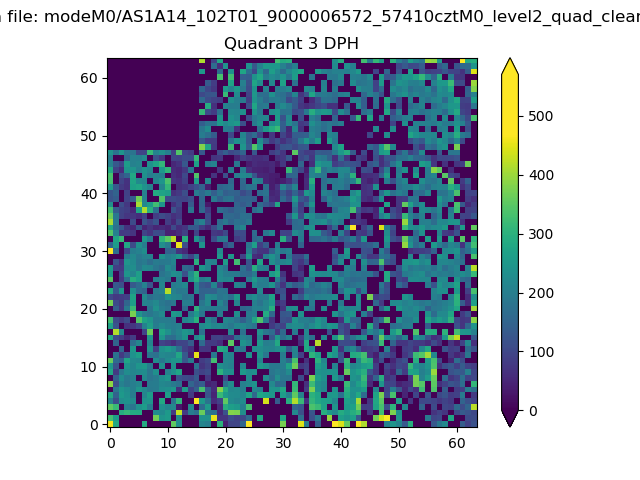 |
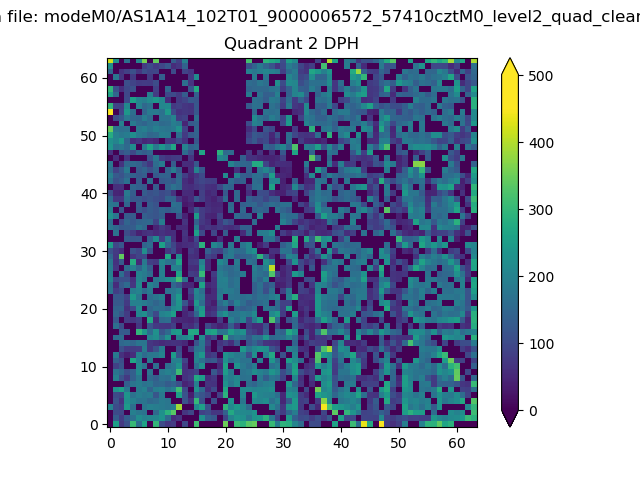 |
Quadrant C |
| Plot type | Count rate plots | Images |
|---|---|---|
| Comparison with Poisson distribution Blue bars denote a histogram of data divided into 1 sec bins. Red curve is a Poisson curve with rate = median count rate of data. |
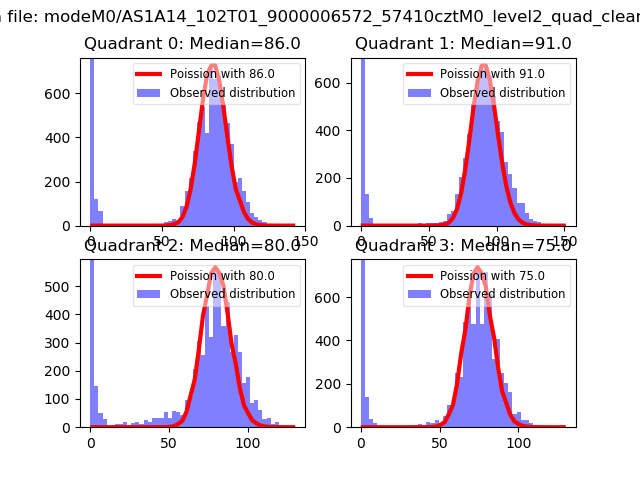 |
 |
| Quadrant-wise count rates Data is divided into 100 sec bins |
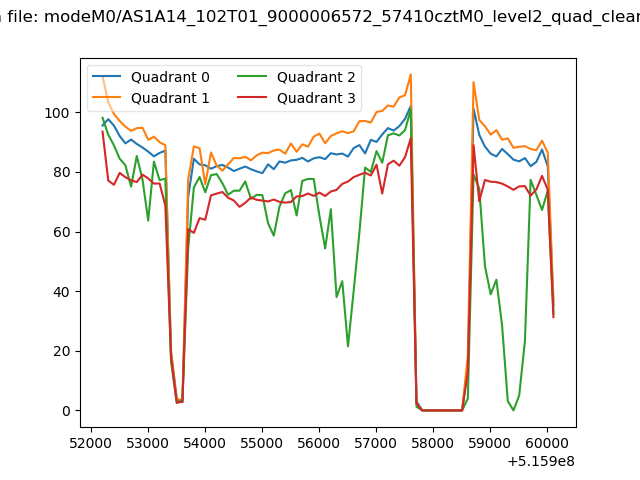 |
|
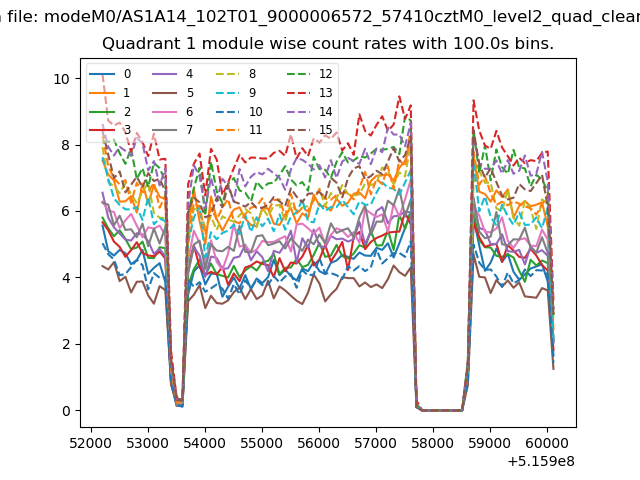
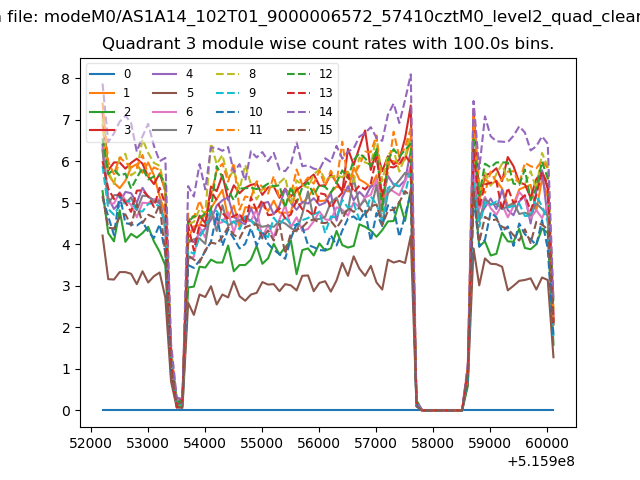
| Module-wise count rates for Quadrant A Data is divided into 100 sec bins |
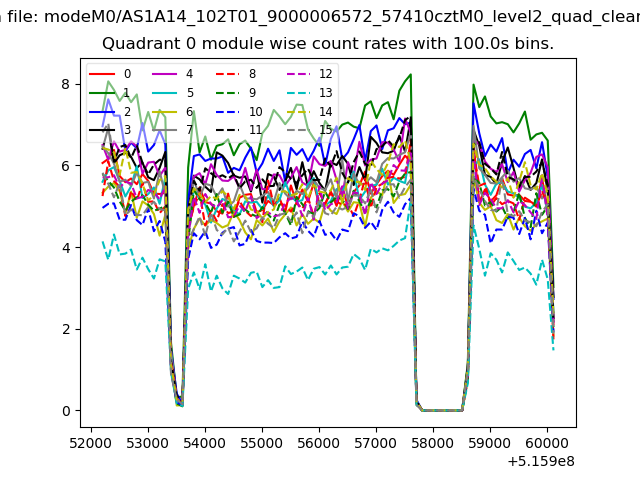 |
 |
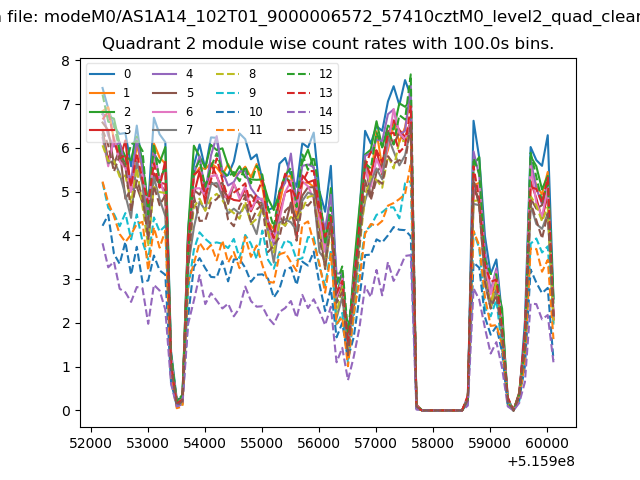
| Module-wise count rates for Quadrant B Data is divided into 100 sec bins |
 |
 |
| Module-wise count rates for Quadrant C Data is divided into 100 sec bins |
 |
 |
| Module-wise count rates for Quadrant D Data is divided into 100 sec bins |
 |
 |
| Parameter | Plot |
|---|---|
| CZT HV Monitor | 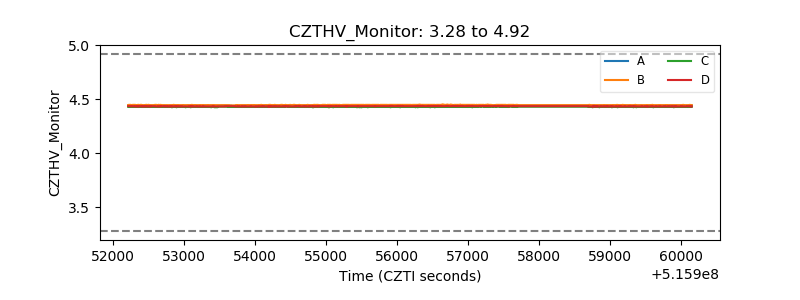 |
| D_VDD | 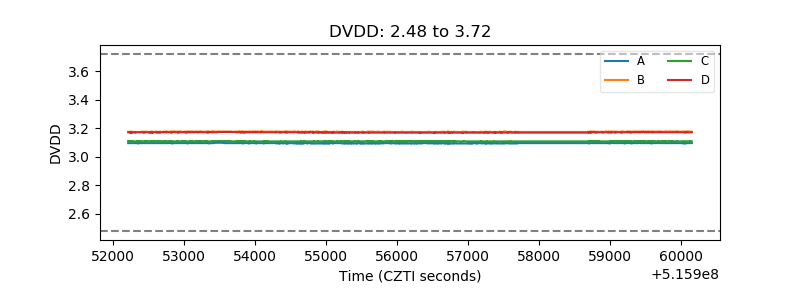 |
| Temperature 1 | 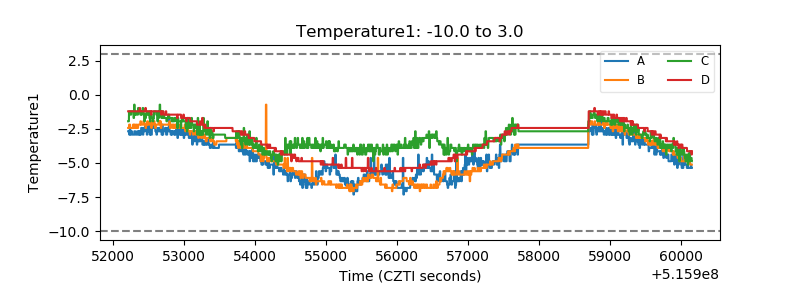 |
| Veto HV Monitor | 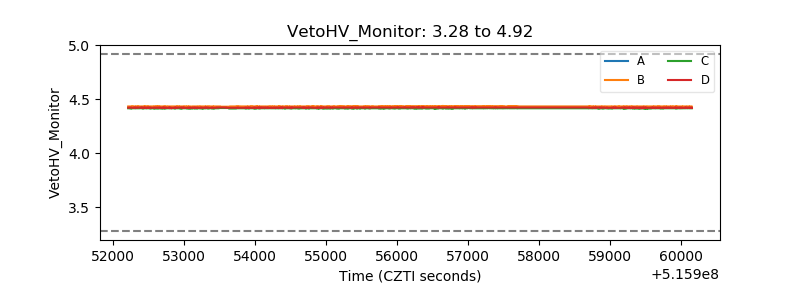 |
| Veto LLD | 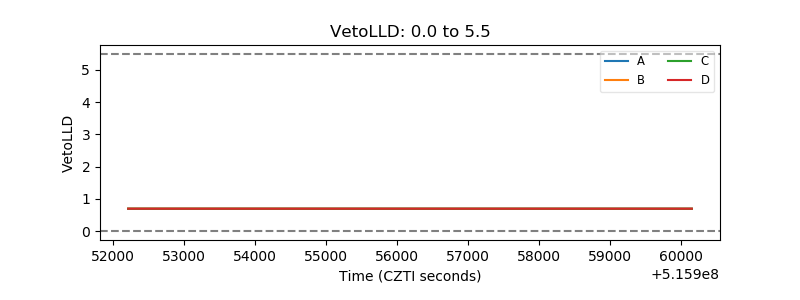 |
| Alpha Counter | 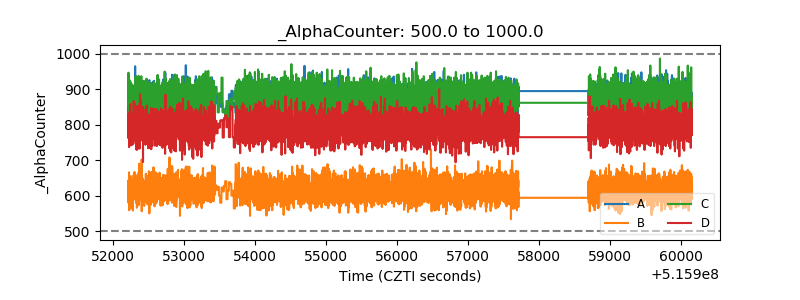 |
| _CPM_Rate | 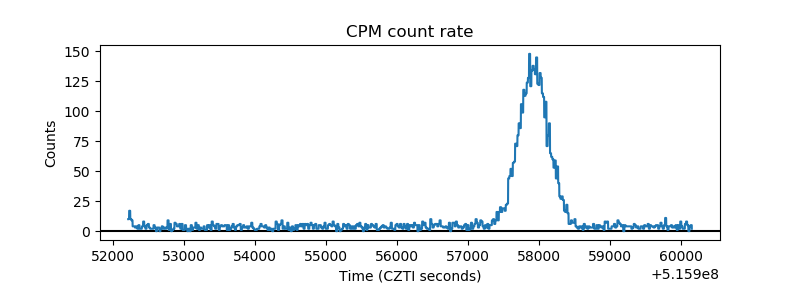 |
| CZT Counter | 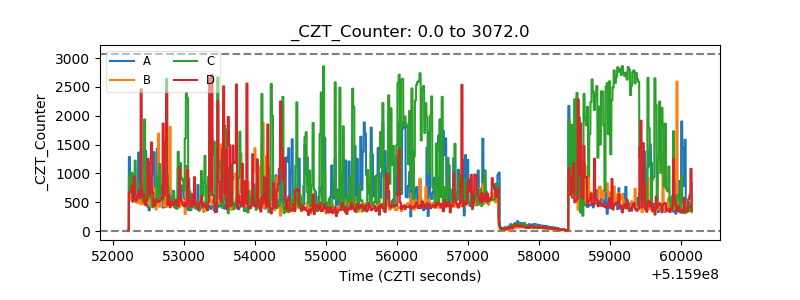 |
| +2.5 Volts monitor |  |
| +5 Volts monitor |  |
| _ROLL_ROT | 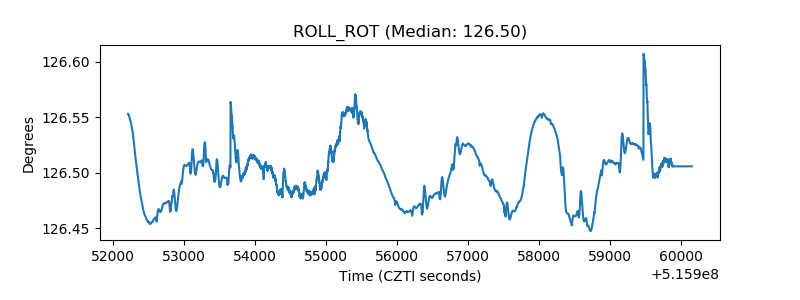 |
| _Roll_DEC | 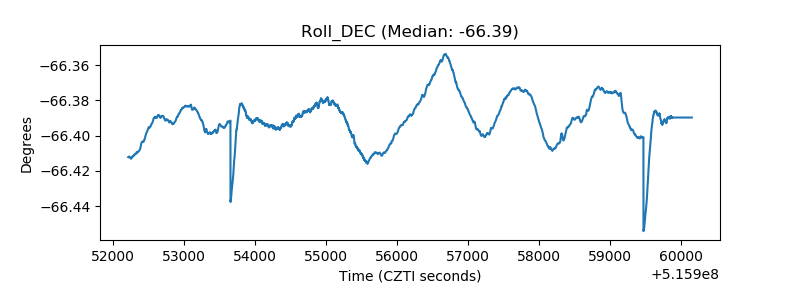 |
| _Roll_RA | 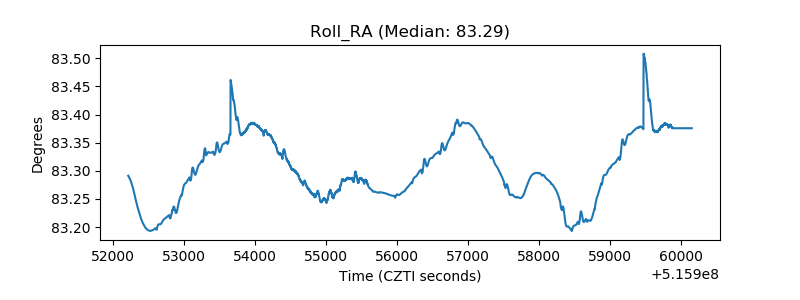 |
| Veto Counter | 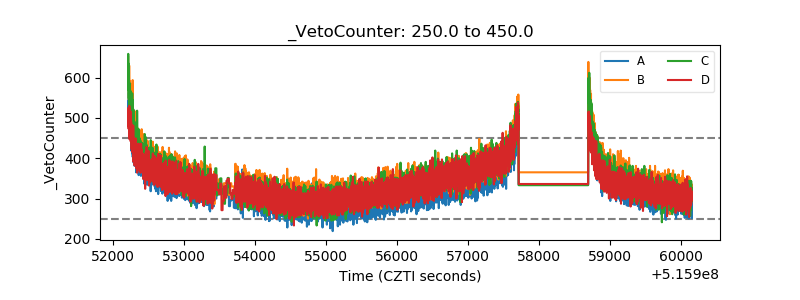 |