| Param | Original file | Final file |
|---|---|---|
| Filename | modeM0/AS1A14_102T01_9000006572_57411cztM0_level2.fits | modeM0/AS1A14_102T01_9000006572_57411cztM0_level2_quad_clean.evt |
| Size (bytes) | 665,997,120 | 88,801,920 |
| Size | 635.1 MB | 84.7 MB |
| Events in quadrant A | 8,942,554 | 527,438 |
| Events in quadrant B | 3,699,492 | 643,989 |
| Events in quadrant C | 7,499,737 | 493,959 |
| Events in quadrant D | 3,962,615 | 529,590 |
| Mode M0 | |||
|---|---|---|---|
| Quadrant | BADHDUFLAG | Total packets | Discarded packets |
| A | 0 | 31538 | 2 |
| B | 0 | 16166 | 2 |
| C | 0 | 27340 | 2 |
| D | 0 | 16944 | 6 |
| Mode M9 | |||
|---|---|---|---|
| Quadrant | BADHDUFLAG | Total packets | Discarded packets |
| A | 0 | 7 | 0 |
| B | 0 | 8 | 0 |
| C | 0 | 8 | 0 |
| D | 0 | 8 | 0 |
| Mode SS | |||
|---|---|---|---|
| Quadrant | BADHDUFLAG | Total packets | Discarded packets |
| A | 0 | 146 | 0 |
| B | 0 | 146 | 0 |
| C | 0 | 146 | 0 |
| D | 0 | 144 | 0 |
| Quadrant | Total seconds | Saturated seconds | Saturation percentage |
|---|---|---|---|
| A | 7080 | 1491 | 21.059322% |
| B | 7080 | 95 | 1.341808% |
| C | 7080 | 1325 | 18.714689% |
| D | 7079 | 168 | 2.373217% |
Noise dominated data is calculated using 1-second bins in cleaned event files. If a bin has >2000 counts, and if more than 50% of those come from <1% of pixels, then it is considered to be noise-dominated and hence unusable.
| Quadrant | # 1 sec bins | Bins with >0 counts | Bins with >2000 counts | High rate bins dominated by noise | Noise dominated (total time) | Noise dominated (detector-on time) | Marked lightcurve |
|---|---|---|---|---|---|---|---|
| A | 8008 | 7353 | 1051 | 1051 | 13.12% | 14.29% | 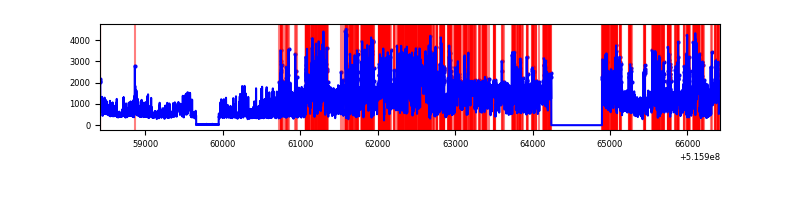 |
| B | 8008 | 7354 | 28 | 28 | 0.35% | 0.38% | 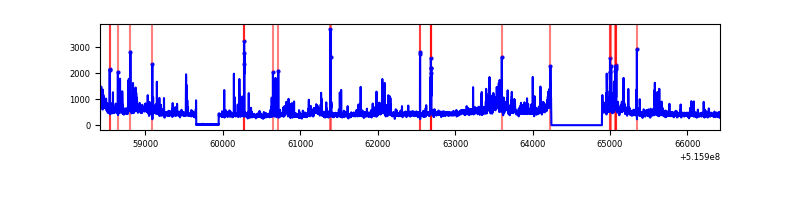 |
| C | 8008 | 7352 | 1095 | 1095 | 13.67% | 14.89% | 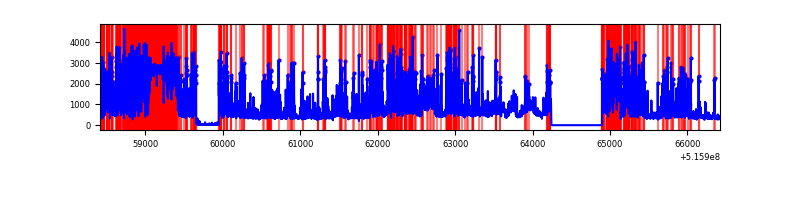 |
| D | 8007 | 7353 | 114 | 114 | 1.42% | 1.55% | 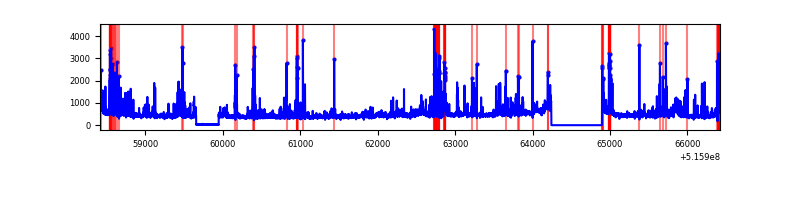 |
Top three noisy pixels from each quadrant. If the there are fewer than three noisy pixels in the level2.evt file, extra rows are filled as -1
| Pixel properties | Quadrant properties | ||||||
|---|---|---|---|---|---|---|---|
| Quadrant | DetID | PixID | Counts | Sigma | Mean | Median | Sigma |
| A | 0 | 12 | 3651357 | 21583.35 | 684 | 668 | 169.1 |
| A | 10 | 251 | 2565491 | 15163.56 | 684 | 668 | 169.1 |
| A | 13 | 248 | 37398 | 217.15 | 684 | 668 | 169.1 |
| B | 0 | 216 | 397617 | 2524.84 | 739 | 710 | 157.2 |
| B | 10 | 247 | 65954 | 415.04 | 739 | 710 | 157.2 |
| B | 0 | 245 | 63003 | 396.26 | 739 | 710 | 157.2 |
| C | 15 | 224 | 3318164 | 18515.72 | 653 | 647 | 179.2 |
| C | 12 | 249 | 864502 | 4821.35 | 653 | 647 | 179.2 |
| C | 12 | 252 | 310642 | 1730.14 | 653 | 647 | 179.2 |
| D | 8 | 240 | 295994 | 1473.23 | 709 | 675 | 200.5 |
| D | 2 | 249 | 227476 | 1131.42 | 709 | 675 | 200.5 |
| D | 3 | 224 | 174076 | 865.03 | 709 | 675 | 200.5 |
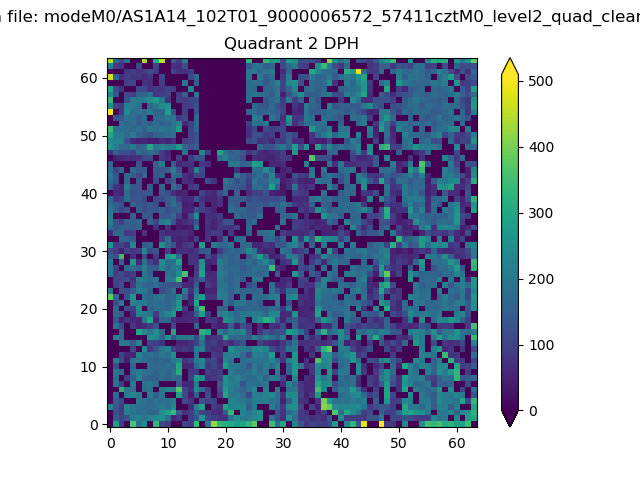
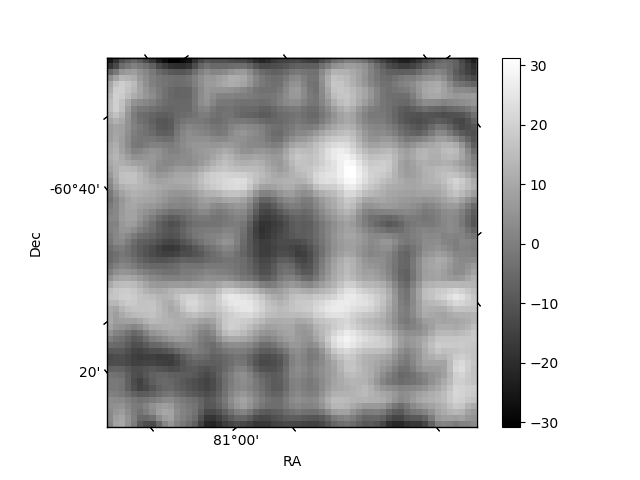
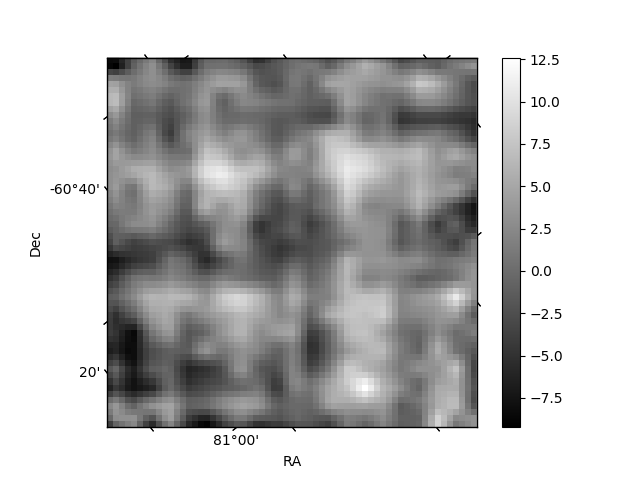
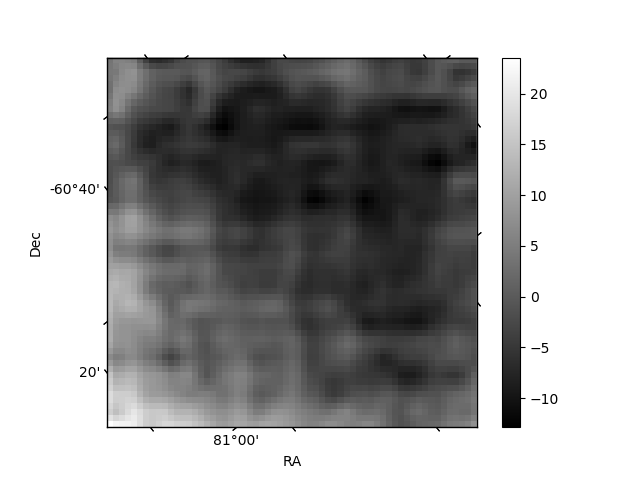
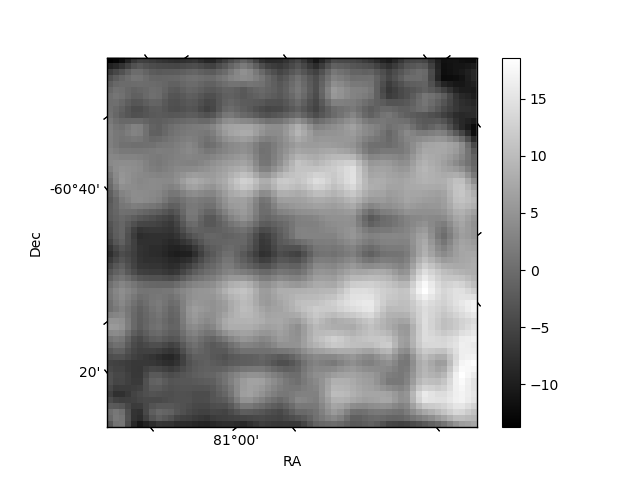
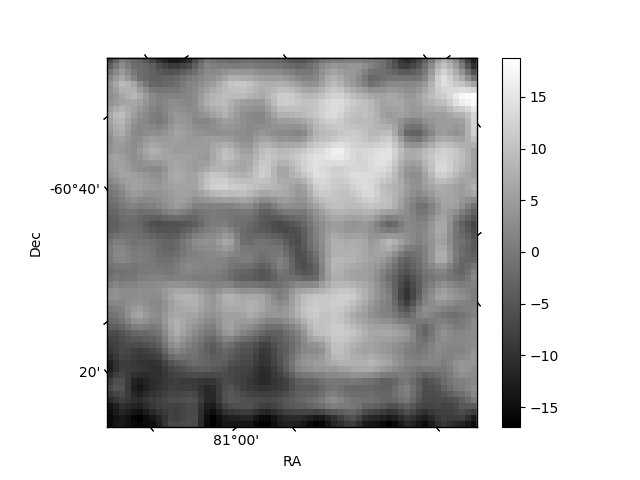
Histogram calculated using DETX and DETY for each event in the final _common_clean file
| Quadrant A | 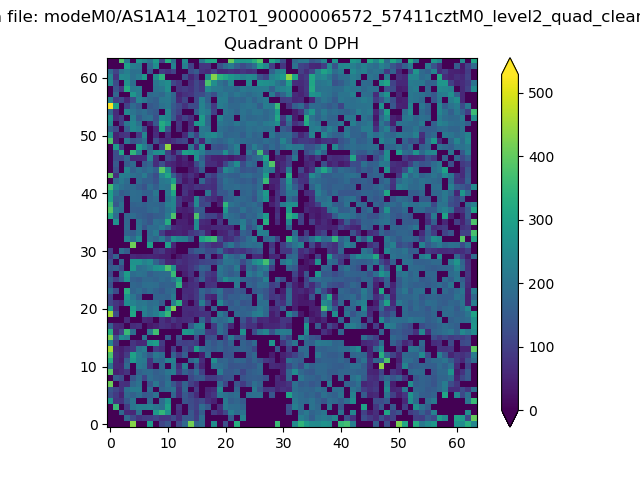 |
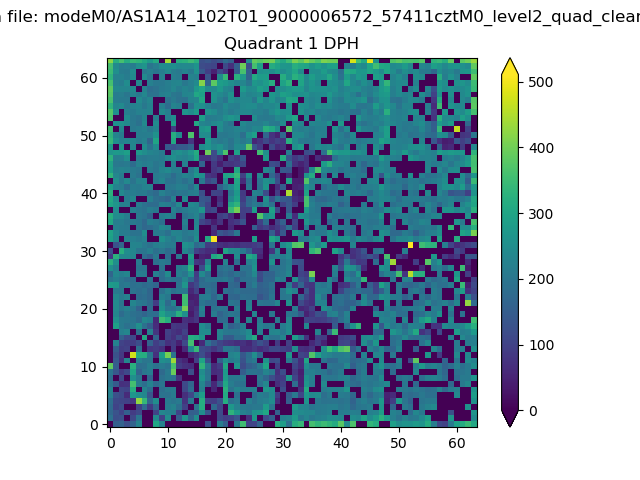 |
Quadrant B |
|---|---|---|---|
| Quadrant D | 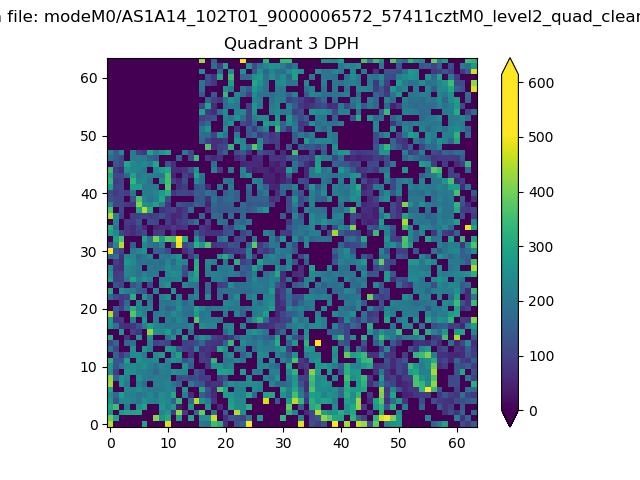 |
 |
Quadrant C |
| Plot type | Count rate plots | Images |
|---|---|---|
| Comparison with Poisson distribution Blue bars denote a histogram of data divided into 1 sec bins. Red curve is a Poisson curve with rate = median count rate of data. |
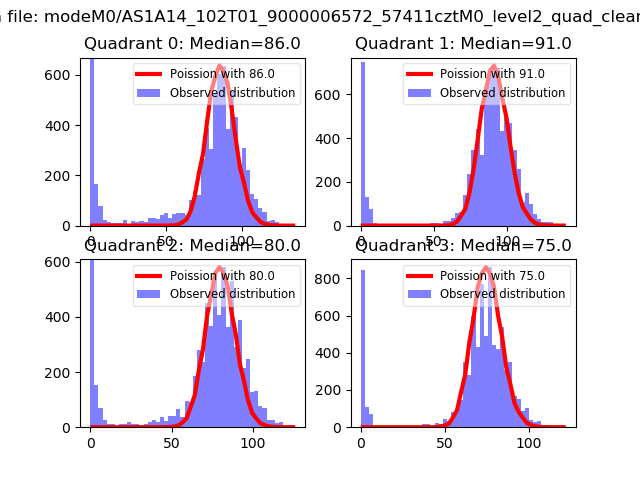 |
 |
| Quadrant-wise count rates Data is divided into 100 sec bins |
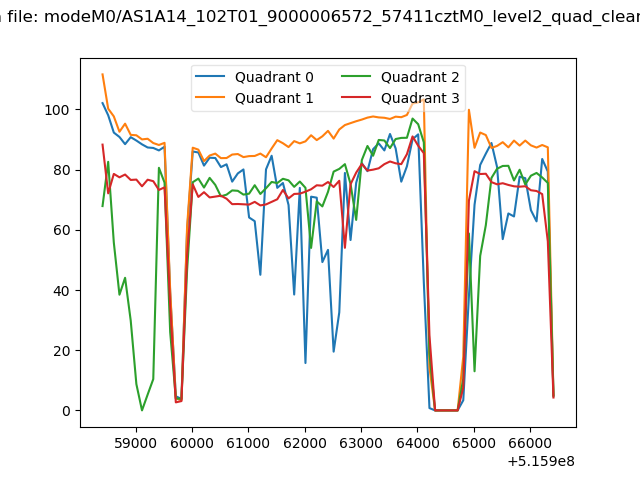 |
|
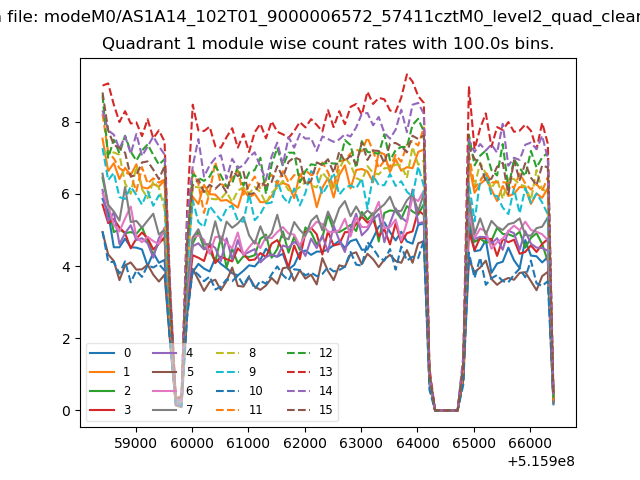
| Module-wise count rates for Quadrant A Data is divided into 100 sec bins |
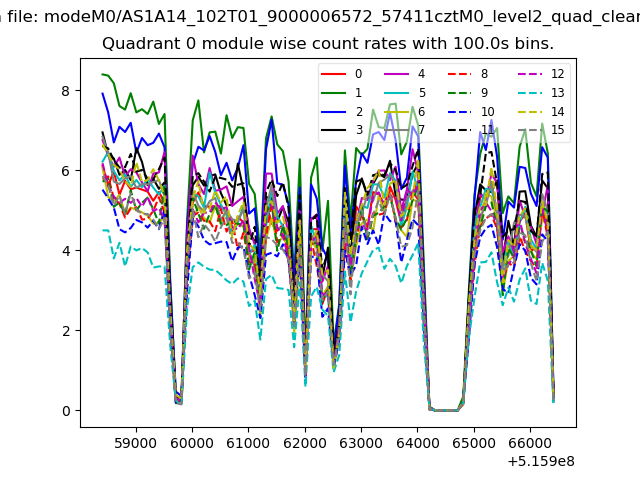 |
 |
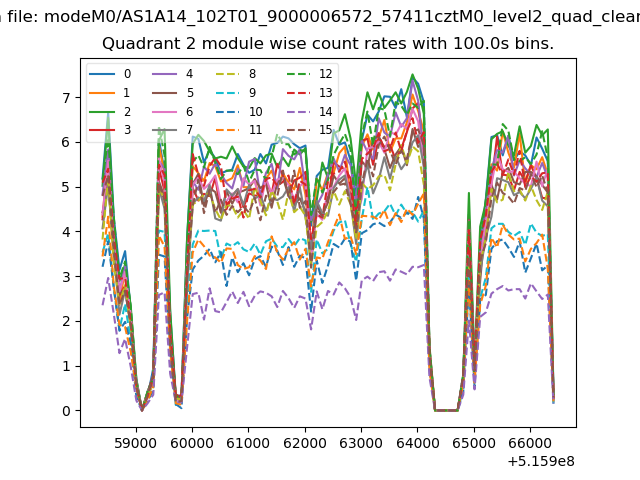
| Module-wise count rates for Quadrant B Data is divided into 100 sec bins |
 |
 |
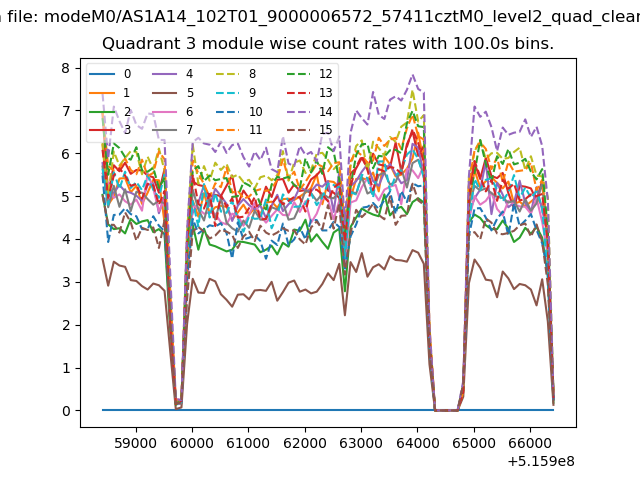
| Module-wise count rates for Quadrant C Data is divided into 100 sec bins |
 |
 |
| Module-wise count rates for Quadrant D Data is divided into 100 sec bins |
 |
 |
| Parameter | Plot |
|---|---|
| CZT HV Monitor | 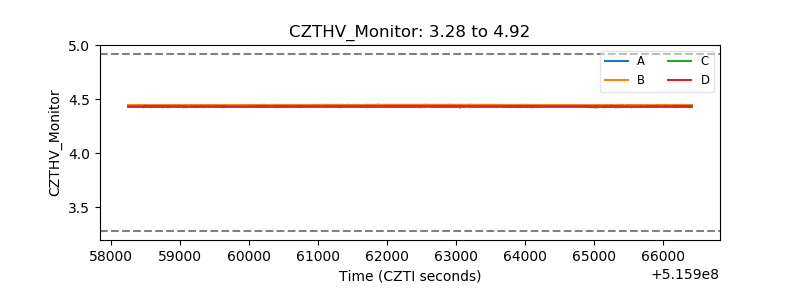 |
| D_VDD | 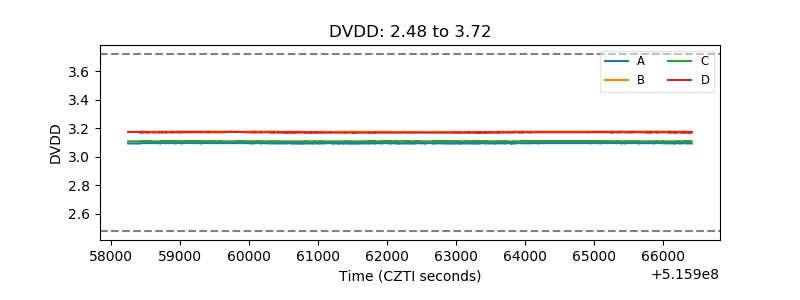 |
| Temperature 1 | 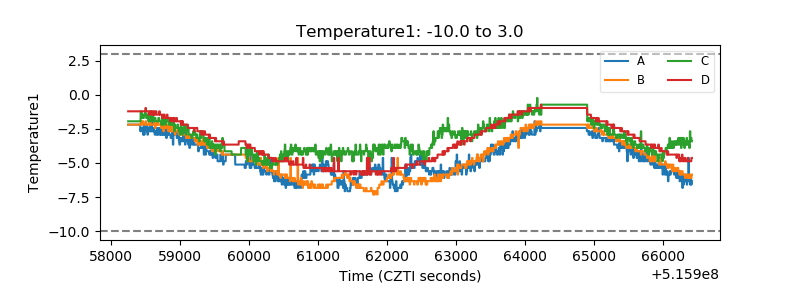 |
| Veto HV Monitor | 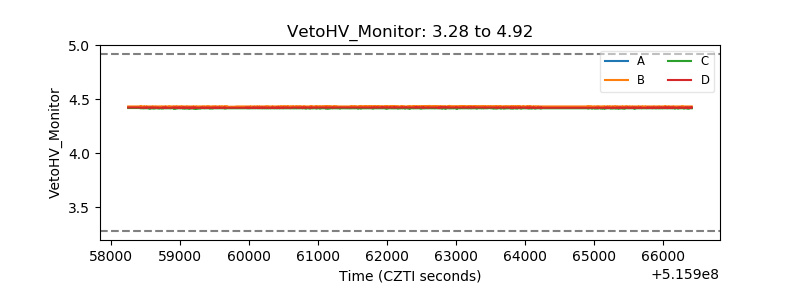 |
| Veto LLD | 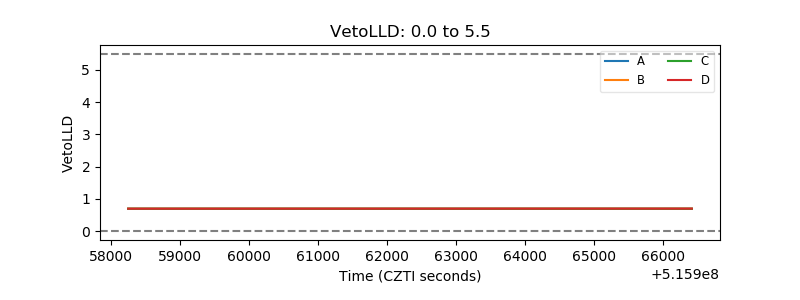 |
| Alpha Counter | 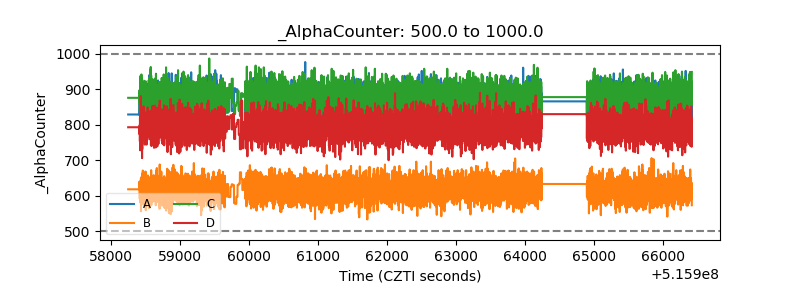 |
| _CPM_Rate | 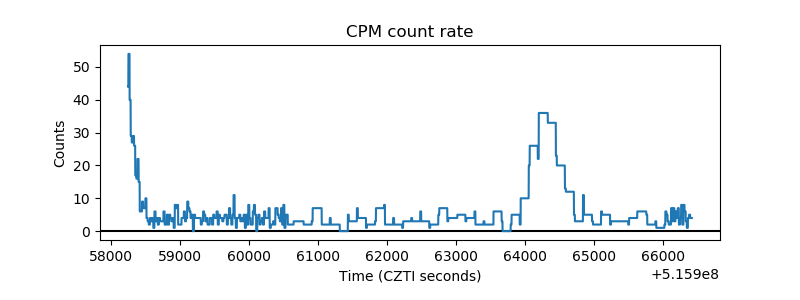 |
| CZT Counter | 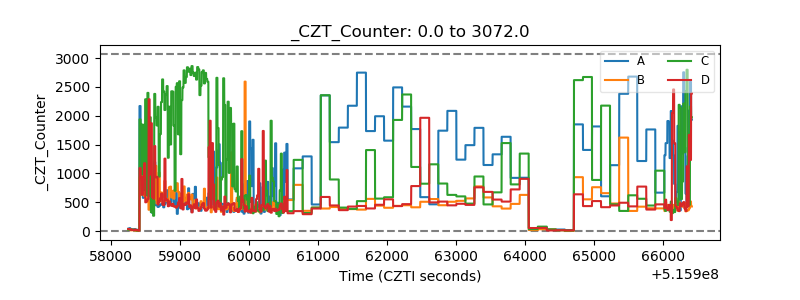 |
| +2.5 Volts monitor | 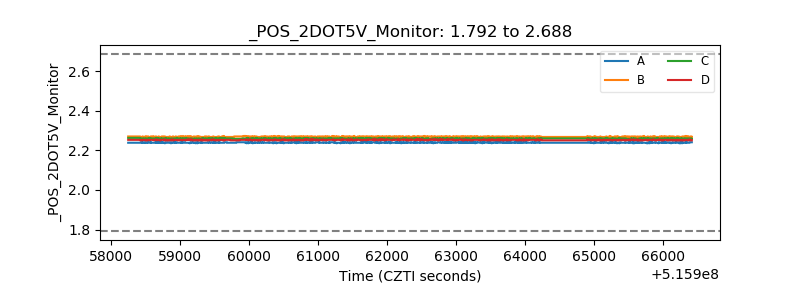 |
| +5 Volts monitor | 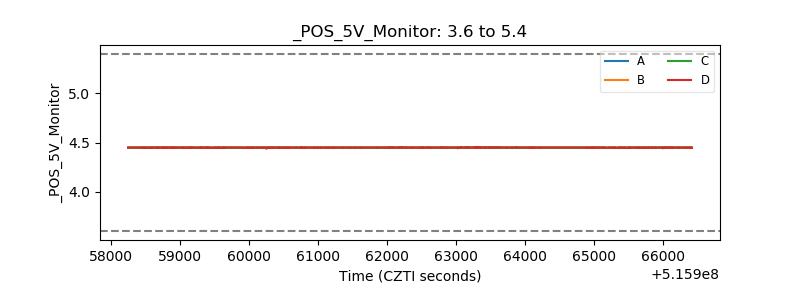 |
| _ROLL_ROT | 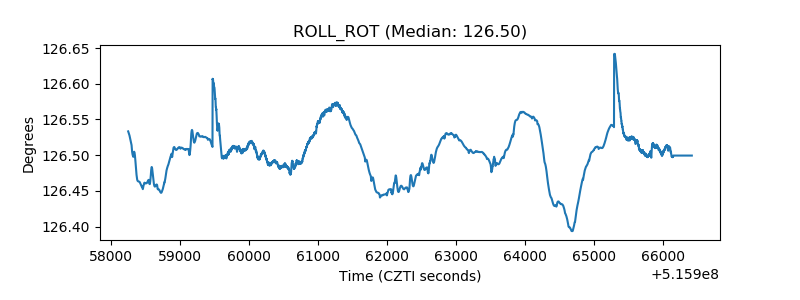 |
| _Roll_DEC | 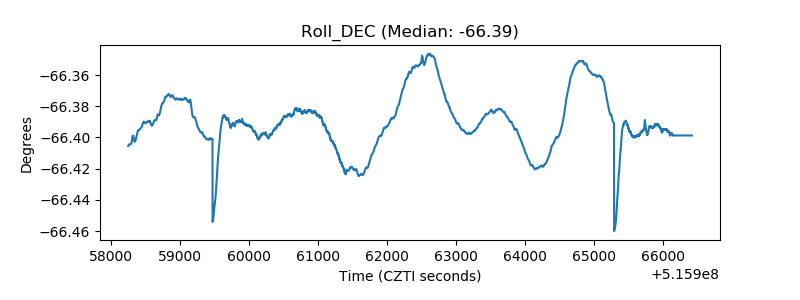 |
| _Roll_RA | 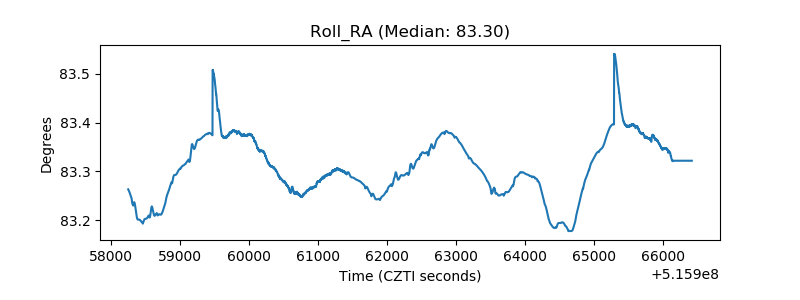 |
| Veto Counter | 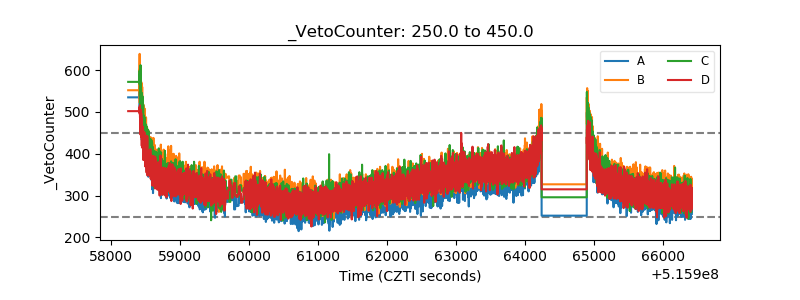 |