| Param | Original file | Final file |
|---|---|---|
| Filename | modeM0/AS1A14_102T01_9000006572_57412cztM0_level2.fits | modeM0/AS1A14_102T01_9000006572_57412cztM0_level2_quad_clean.evt |
| Size (bytes) | 673,096,320 | 97,168,320 |
| Size | 641.9 MB | 92.7 MB |
| Events in quadrant A | 8,300,766 | 627,189 |
| Events in quadrant B | 3,571,709 | 672,800 |
| Events in quadrant C | 7,735,672 | 535,916 |
| Events in quadrant D | 4,713,894 | 572,098 |
| Mode M0 | |||
|---|---|---|---|
| Quadrant | BADHDUFLAG | Total packets | Discarded packets |
| A | 0 | 30078 | 0 |
| B | 0 | 16333 | 0 |
| C | 0 | 28343 | 0 |
| D | 0 | 19399 | 0 |
| Mode SS | |||
|---|---|---|---|
| Quadrant | BADHDUFLAG | Total packets | Discarded packets |
| A | 0 | 154 | 0 |
| B | 0 | 154 | 0 |
| C | 0 | 154 | 0 |
| D | 0 | 154 | 0 |
| Quadrant | Total seconds | Saturated seconds | Saturation percentage |
|---|---|---|---|
| A | 7669 | 818 | 10.666319% |
| B | 7669 | 75 | 0.977963% |
| C | 7669 | 1249 | 16.286348% |
| D | 7670 | 212 | 2.764016% |
Noise dominated data is calculated using 1-second bins in cleaned event files. If a bin has >2000 counts, and if more than 50% of those come from <1% of pixels, then it is considered to be noise-dominated and hence unusable.
| Quadrant | # 1 sec bins | Bins with >0 counts | Bins with >2000 counts | High rate bins dominated by noise | Noise dominated (total time) | Noise dominated (detector-on time) | Marked lightcurve |
|---|---|---|---|---|---|---|---|
| A | 7954 | 7944 | 769 | 769 | 9.67% | 9.68% | 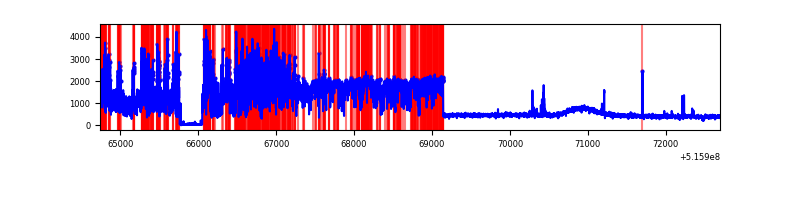 |
| B | 7954 | 7954 | 9 | 9 | 0.11% | 0.11% | 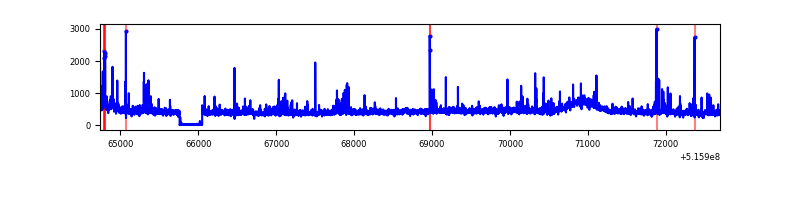 |
| C | 7954 | 7946 | 1014 | 1014 | 12.75% | 12.76% | 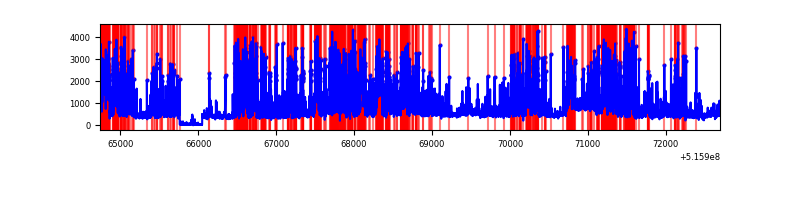 |
| D | 7955 | 7955 | 170 | 170 | 2.14% | 2.14% | 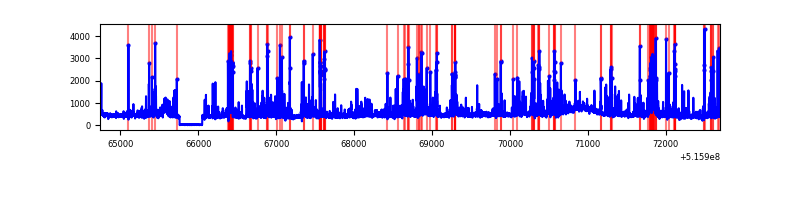 |
Top three noisy pixels from each quadrant. If the there are fewer than three noisy pixels in the level2.evt file, extra rows are filled as -1
| Pixel properties | Quadrant properties | ||||||
|---|---|---|---|---|---|---|---|
| Quadrant | DetID | PixID | Counts | Sigma | Mean | Median | Sigma |
| A | 0 | 12 | 3920338 | 19973.74 | 803 | 782 | 196.2 |
| A | 10 | 251 | 1173843 | 5977.82 | 803 | 782 | 196.2 |
| A | 13 | 248 | 40300 | 201.38 | 803 | 782 | 196.2 |
| B | 0 | 216 | 88274 | 498.68 | 817 | 784 | 175.4 |
| B | 7 | 252 | 52047 | 292.19 | 817 | 784 | 175.4 |
| B | 10 | 247 | 43325 | 242.48 | 817 | 784 | 175.4 |
| C | 15 | 224 | 4251761 | 21224.47 | 736 | 727 | 200.3 |
| C | 6 | 223 | 183613 | 913.11 | 736 | 727 | 200.3 |
| C | 14 | 254 | 153642 | 763.47 | 736 | 727 | 200.3 |
| D | 8 | 240 | 684324 | 3070.27 | 786 | 752 | 222.6 |
| D | 7 | 96 | 261649 | 1171.82 | 786 | 752 | 222.6 |
| D | 3 | 12 | 163371 | 730.41 | 786 | 752 | 222.6 |
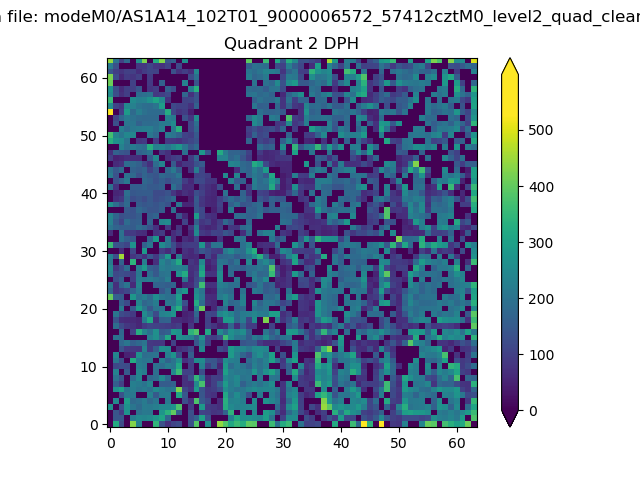
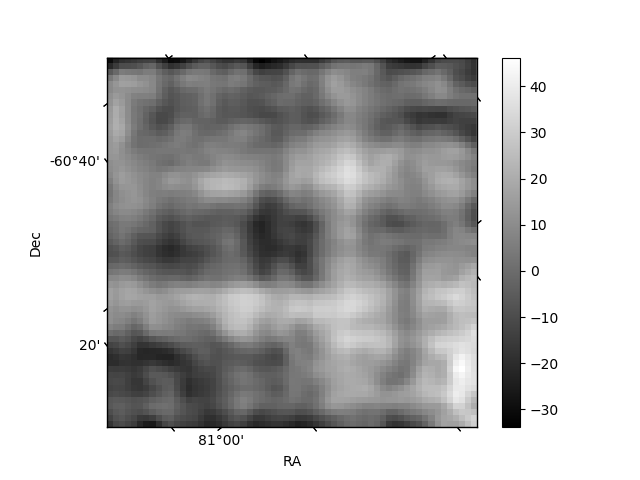
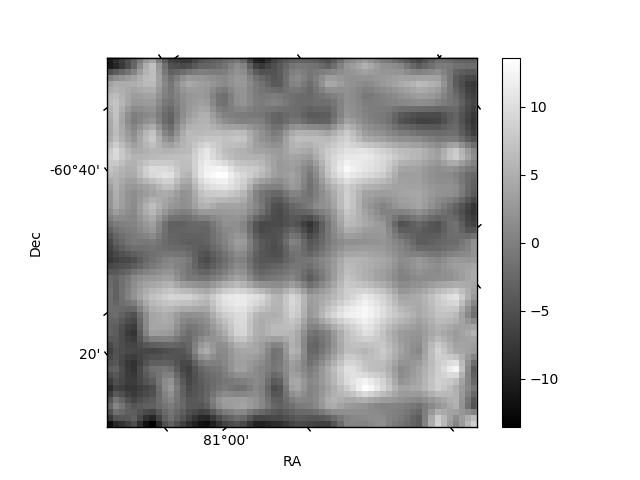
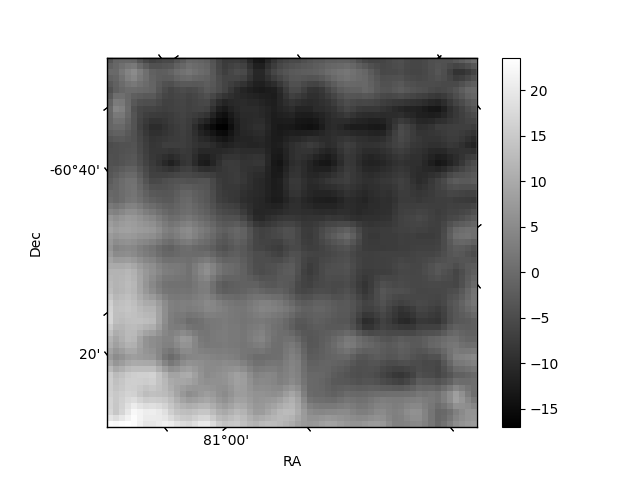
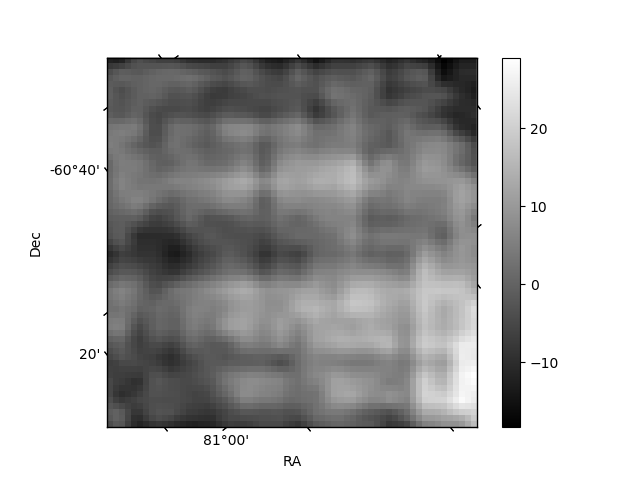
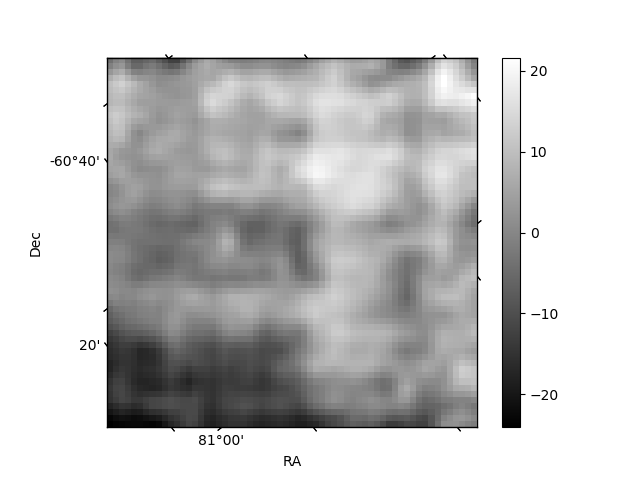
Histogram calculated using DETX and DETY for each event in the final _common_clean file
| Quadrant A | 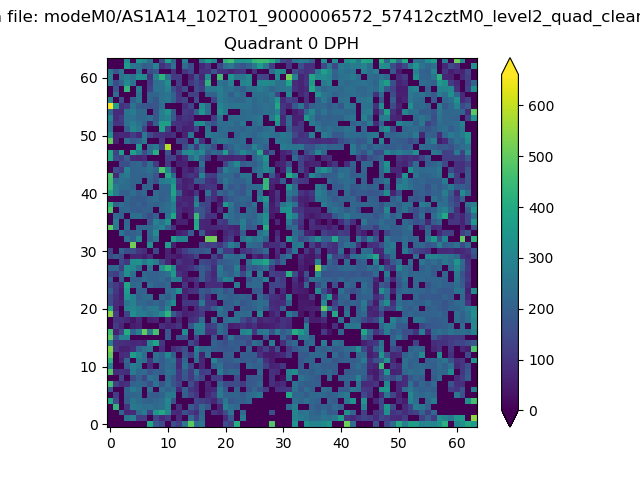 |
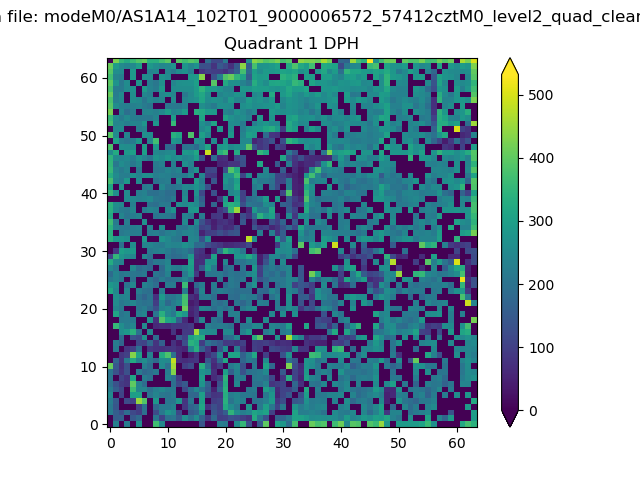 |
Quadrant B |
|---|---|---|---|
| Quadrant D | 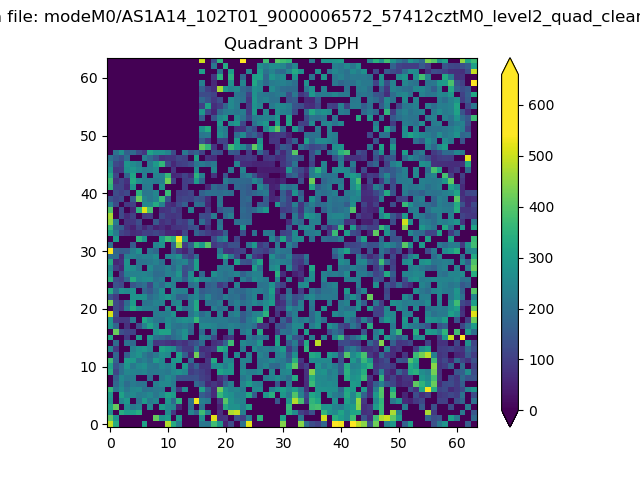 |
 |
Quadrant C |
| Plot type | Count rate plots | Images |
|---|---|---|
| Comparison with Poisson distribution Blue bars denote a histogram of data divided into 1 sec bins. Red curve is a Poisson curve with rate = median count rate of data. |
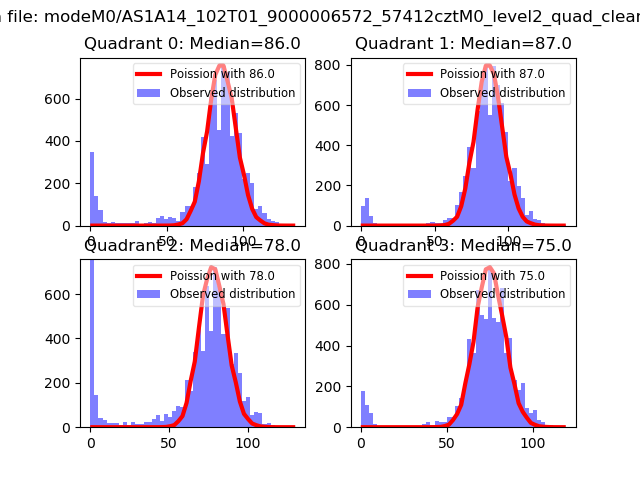 |
 |
| Quadrant-wise count rates Data is divided into 100 sec bins |
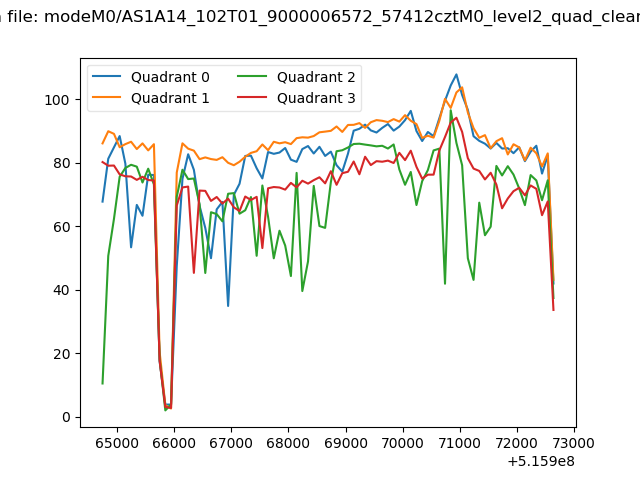 |
|
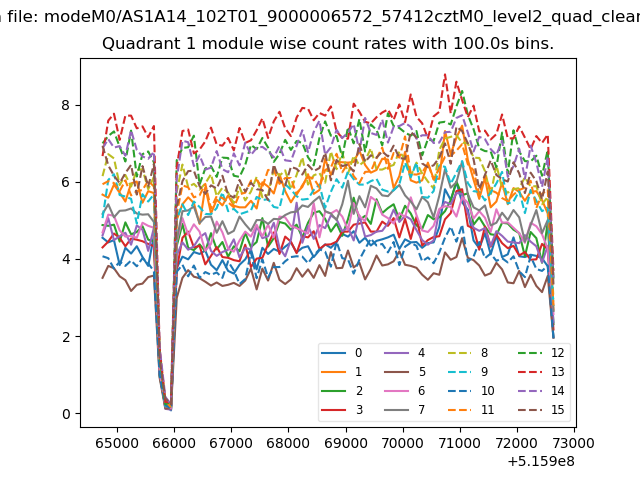
| Module-wise count rates for Quadrant A Data is divided into 100 sec bins |
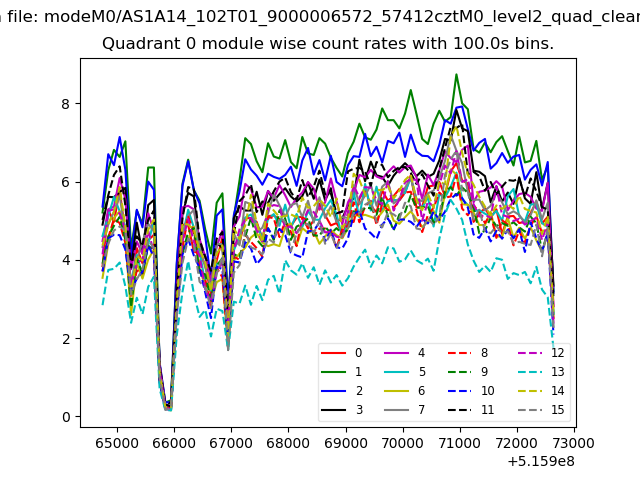 |
 |
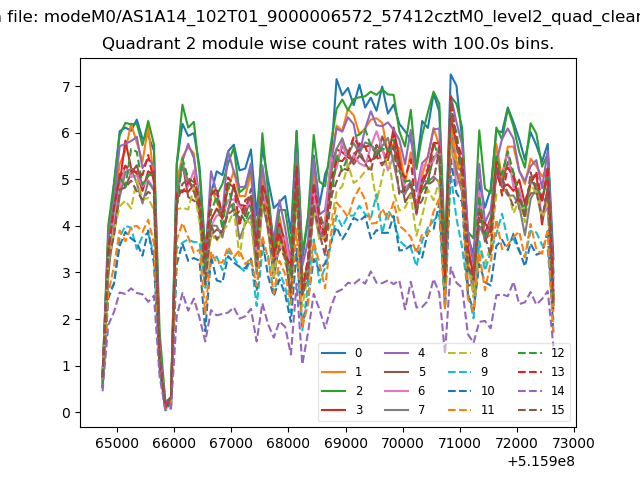
| Module-wise count rates for Quadrant B Data is divided into 100 sec bins |
 |
 |
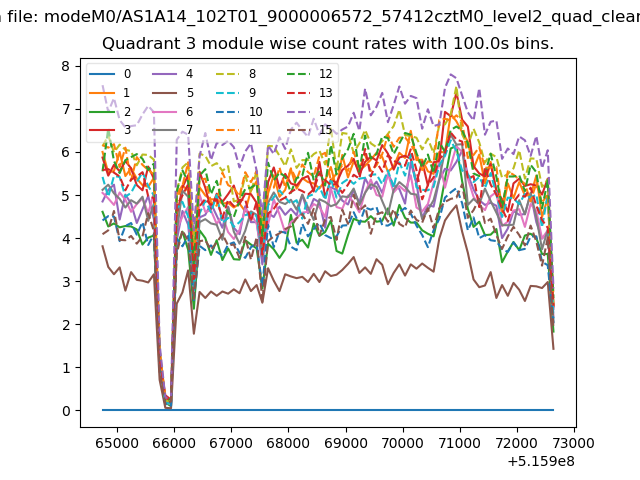
| Module-wise count rates for Quadrant C Data is divided into 100 sec bins |
 |
 |
| Module-wise count rates for Quadrant D Data is divided into 100 sec bins |
 |
 |
| Parameter | Plot |
|---|---|
| CZT HV Monitor | 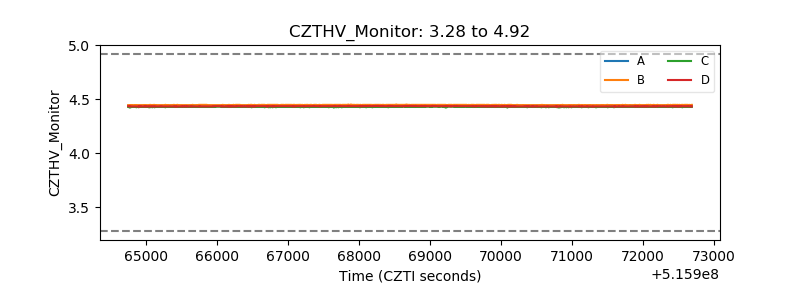 |
| D_VDD | 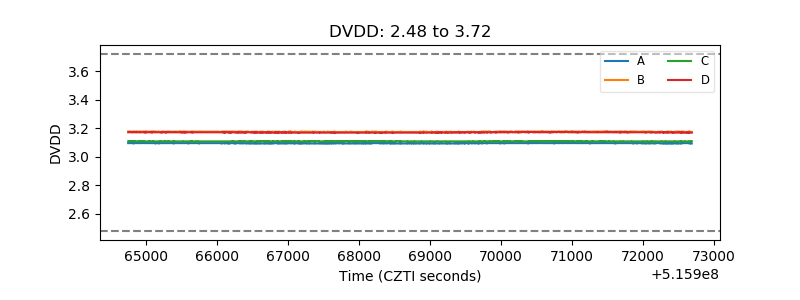 |
| Temperature 1 | 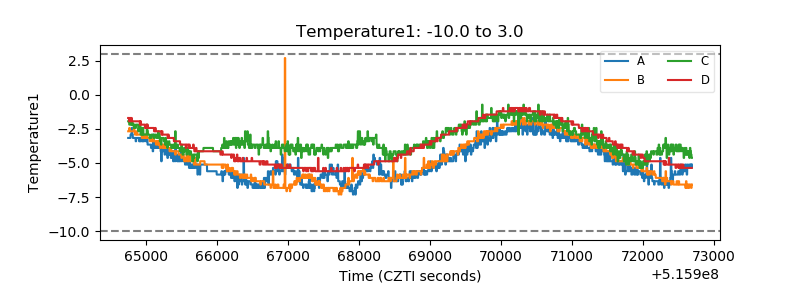 |
| Veto HV Monitor | 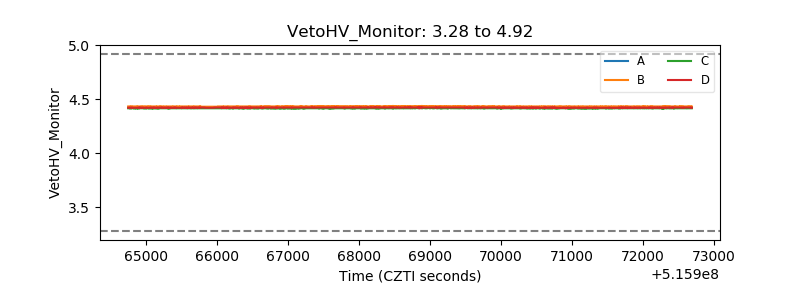 |
| Veto LLD | 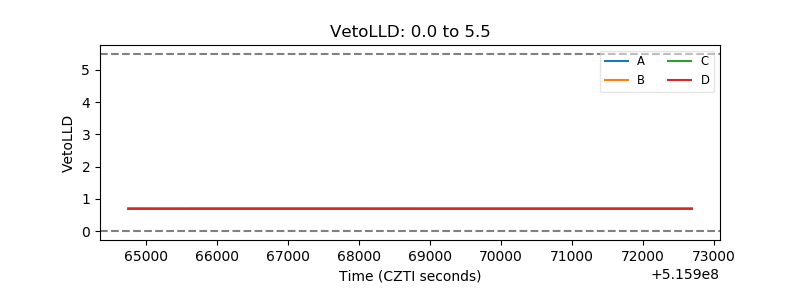 |
| Alpha Counter | 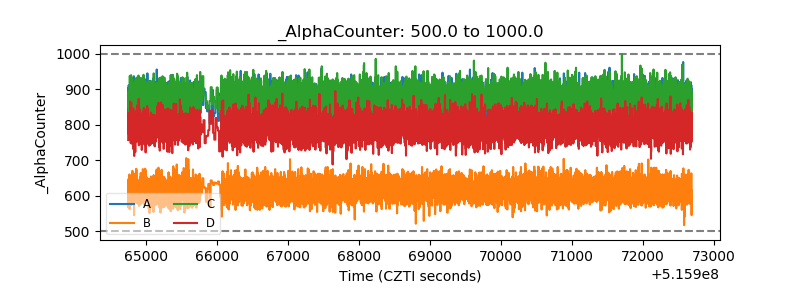 |
| _CPM_Rate | 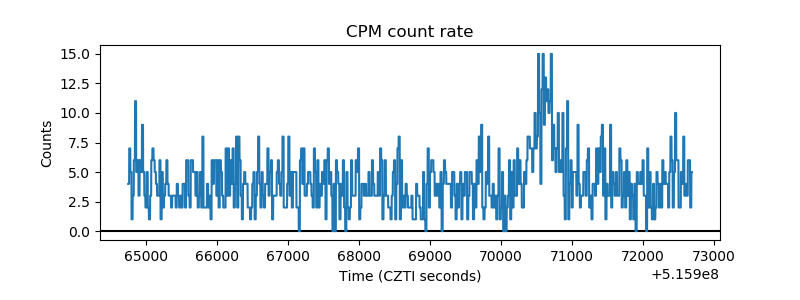 |
| CZT Counter | 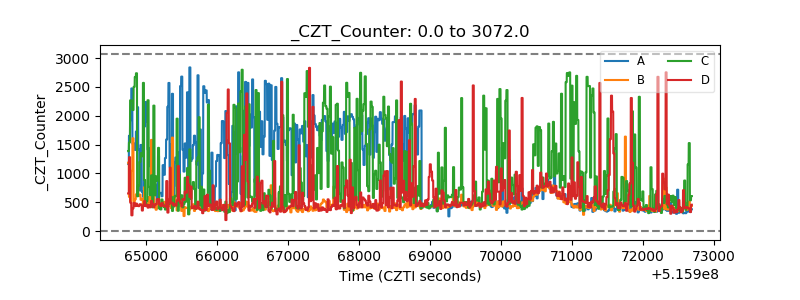 |
| +2.5 Volts monitor | 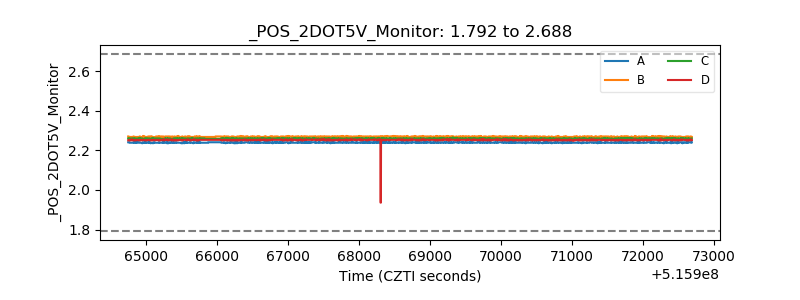 |
| +5 Volts monitor | 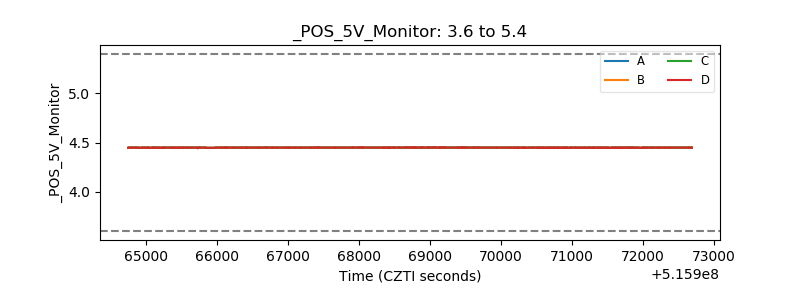 |
| _ROLL_ROT | 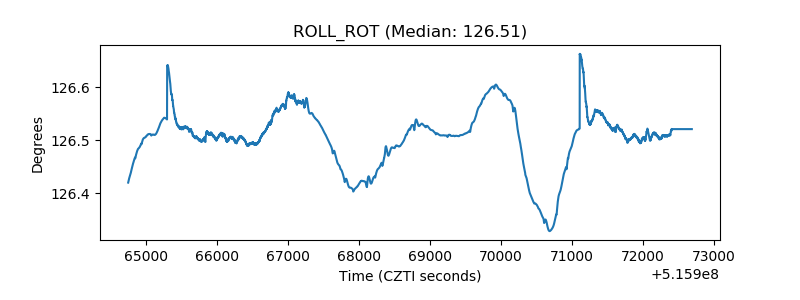 |
| _Roll_DEC | 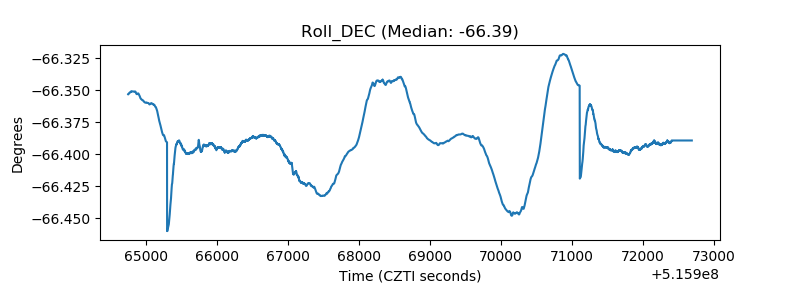 |
| _Roll_RA | 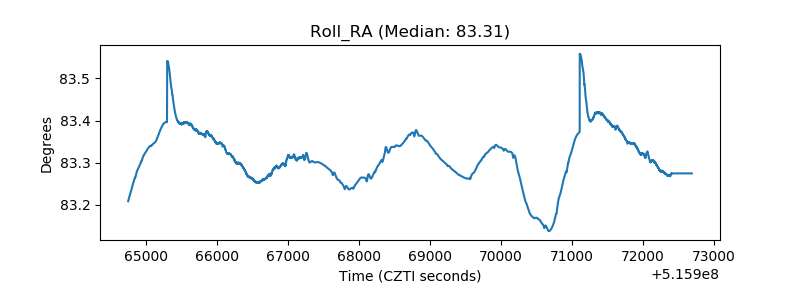 |
| Veto Counter | 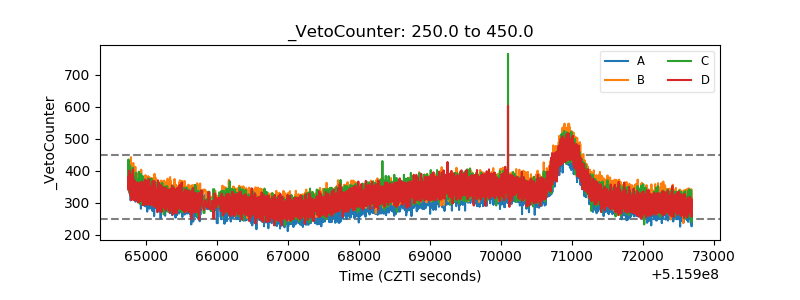 |