| Param | Original file | Final file |
|---|---|---|
| Filename | modeM0/AS1A14_102T01_9000006572_57413cztM0_level2.fits | modeM0/AS1A14_102T01_9000006572_57413cztM0_level2_quad_clean.evt |
| Size (bytes) | 550,488,960 | 100,353,600 |
| Size | 525.0 MB | 95.7 MB |
| Events in quadrant A | 3,430,947 | 679,138 |
| Events in quadrant B | 3,821,529 | 676,260 |
| Events in quadrant C | 7,969,904 | 551,374 |
| Events in quadrant D | 4,539,669 | 581,218 |
| Mode M0 | |||
|---|---|---|---|
| Quadrant | BADHDUFLAG | Total packets | Discarded packets |
| A | 0 | 16639 | 325 |
| B | 0 | 17602 | 300 |
| C | 0 | 29692 | 461 |
| D | 0 | 19481 | 324 |
| Mode SS | |||
|---|---|---|---|
| Quadrant | BADHDUFLAG | Total packets | Discarded packets |
| A | 0 | 160 | 4 |
| B | 0 | 160 | 4 |
| C | 0 | 160 | 2 |
| D | 0 | 160 | 0 |
| Quadrant | Total seconds | Saturated seconds | Saturation percentage |
|---|---|---|---|
| A | 7917 | 13 | 0.164204% |
| B | 7928 | 76 | 0.958628% |
| C | 7905 | 1270 | 16.065781% |
| D | 7927 | 135 | 1.703040% |
Noise dominated data is calculated using 1-second bins in cleaned event files. If a bin has >2000 counts, and if more than 50% of those come from <1% of pixels, then it is considered to be noise-dominated and hence unusable.
| Quadrant | # 1 sec bins | Bins with >0 counts | Bins with >2000 counts | High rate bins dominated by noise | Noise dominated (total time) | Noise dominated (detector-on time) | Marked lightcurve |
|---|---|---|---|---|---|---|---|
| A | 8272 | 8238 | 2 | 2 | 0.02% | 0.02% | 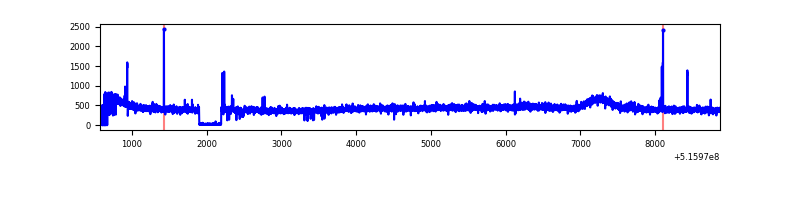 |
| B | 8276 | 8237 | 28 | 28 | 0.34% | 0.34% | 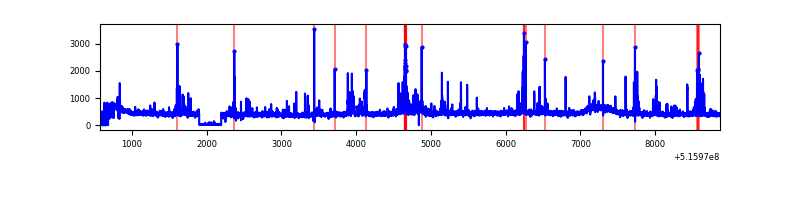 |
| C | 8294 | 8219 | 1034 | 1034 | 12.47% | 12.58% | 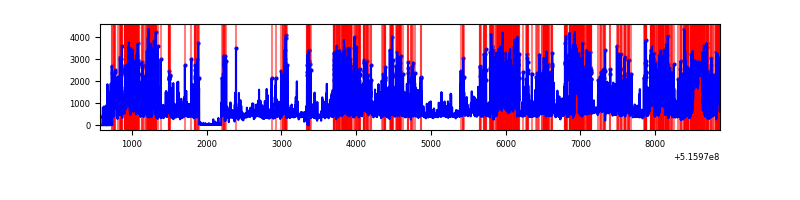 |
| D | 8294 | 8239 | 115 | 115 | 1.39% | 1.40% | 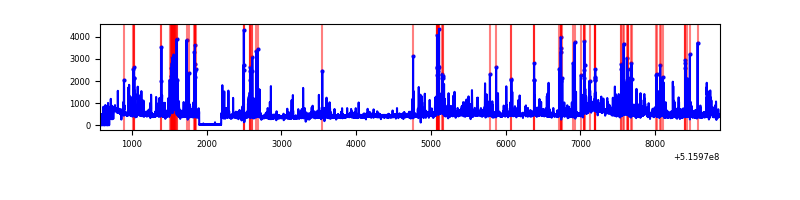 |
Top three noisy pixels from each quadrant. If the there are fewer than three noisy pixels in the level2.evt file, extra rows are filled as -1
| Pixel properties | Quadrant properties | ||||||
|---|---|---|---|---|---|---|---|
| Quadrant | DetID | PixID | Counts | Sigma | Mean | Median | Sigma |
| A | 0 | 12 | 35731 | 166.66 | 855 | 833 | 209.4 |
| A | 3 | 14 | 25531 | 117.95 | 855 | 833 | 209.4 |
| A | 3 | 245 | 13936 | 62.58 | 855 | 833 | 209.4 |
| B | 4 | 216 | 112483 | 615.06 | 847 | 814 | 181.6 |
| B | 10 | 246 | 89954 | 490.97 | 847 | 814 | 181.6 |
| B | 7 | 252 | 84708 | 462.08 | 847 | 814 | 181.6 |
| C | 15 | 224 | 4343535 | 21081.43 | 758 | 751 | 206.0 |
| C | 14 | 254 | 183267 | 886.0 | 758 | 751 | 206.0 |
| C | 6 | 223 | 143627 | 693.57 | 758 | 751 | 206.0 |
| D | 8 | 240 | 623315 | 2686.77 | 818 | 780 | 231.7 |
| D | 3 | 12 | 178787 | 768.25 | 818 | 780 | 231.7 |
| D | 7 | 96 | 109653 | 469.88 | 818 | 780 | 231.7 |
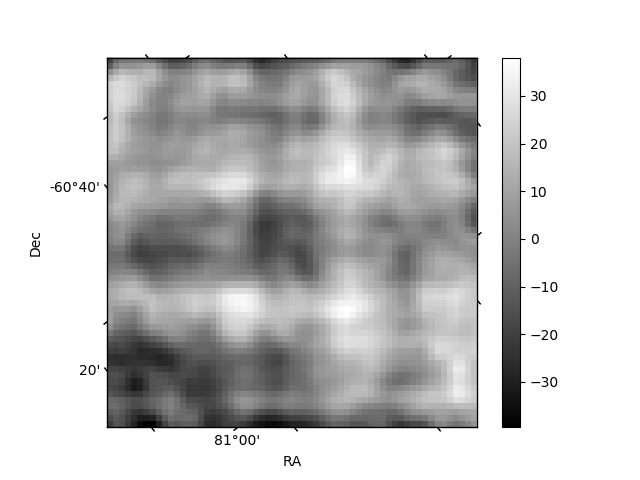
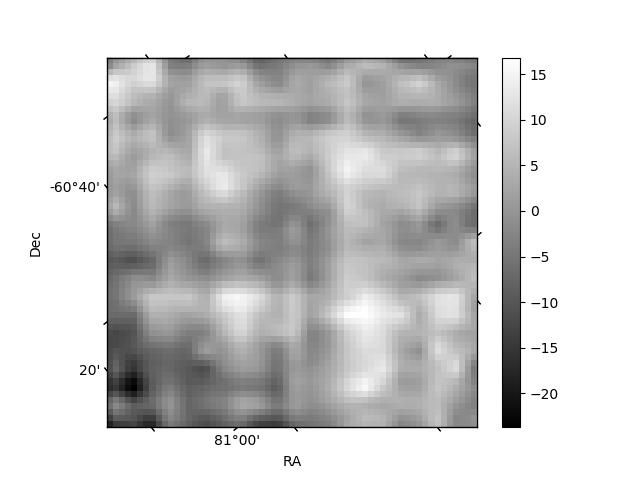
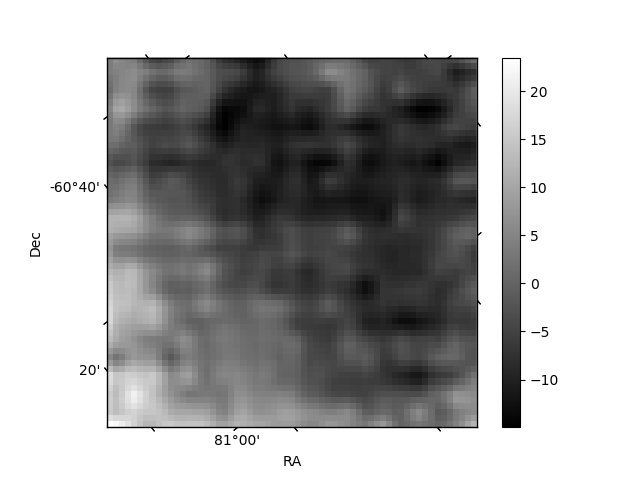
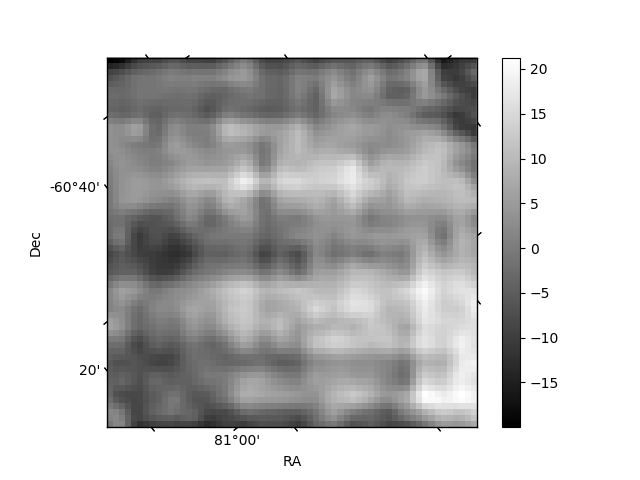
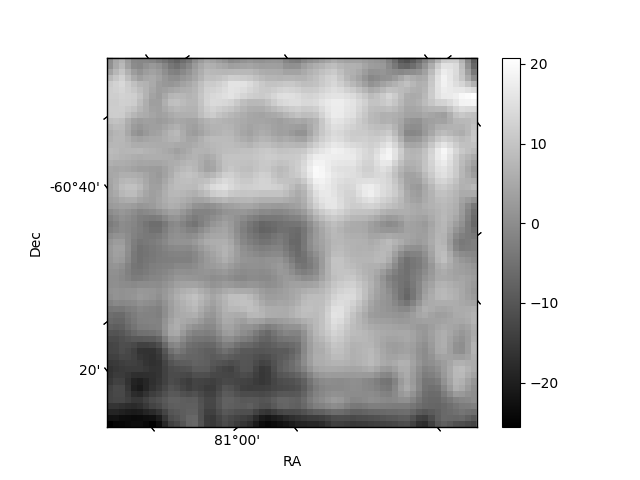
Histogram calculated using DETX and DETY for each event in the final _common_clean file
| Quadrant A | 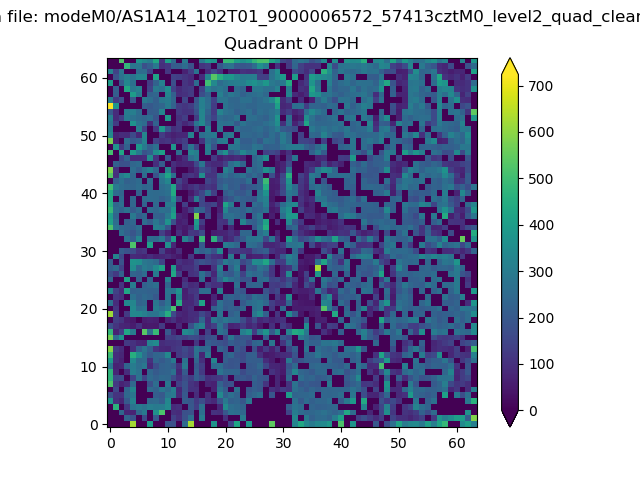 |
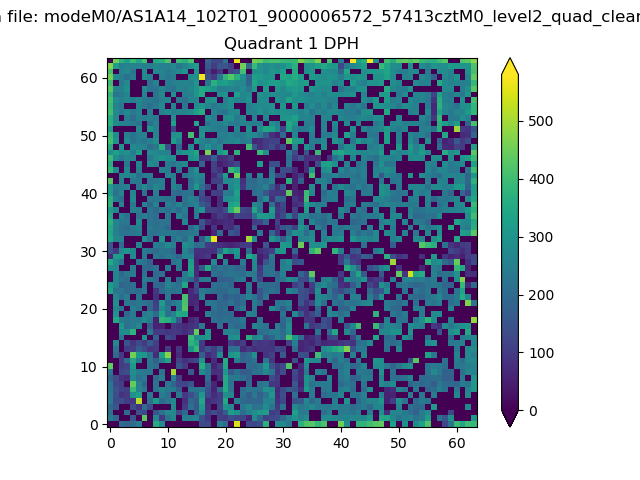 |
Quadrant B |
|---|---|---|---|
| Quadrant D | 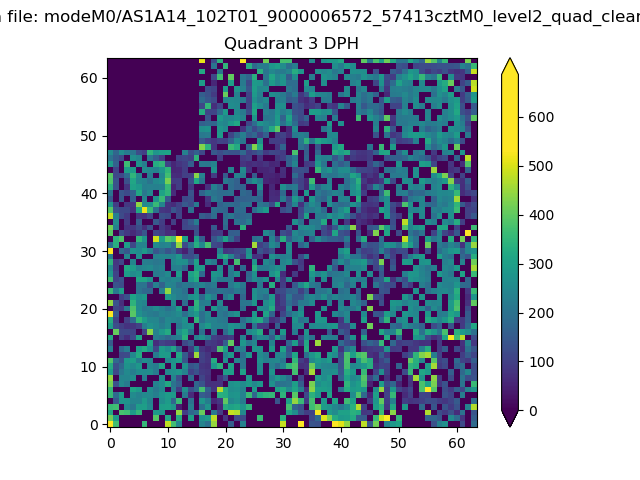 |
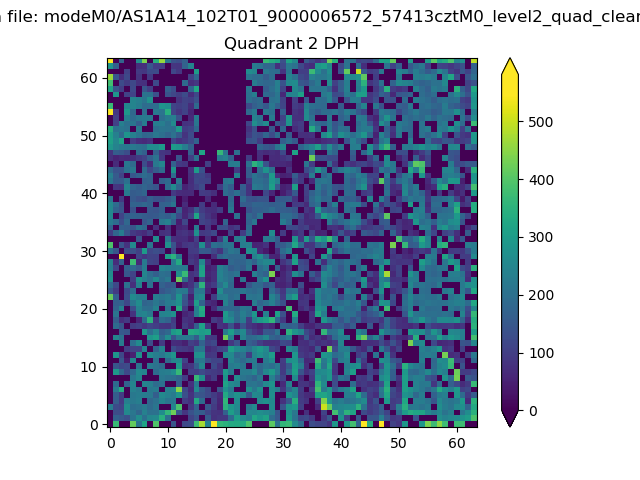 |
Quadrant C |
| Plot type | Count rate plots | Images |
|---|---|---|
| Comparison with Poisson distribution Blue bars denote a histogram of data divided into 1 sec bins. Red curve is a Poisson curve with rate = median count rate of data. |
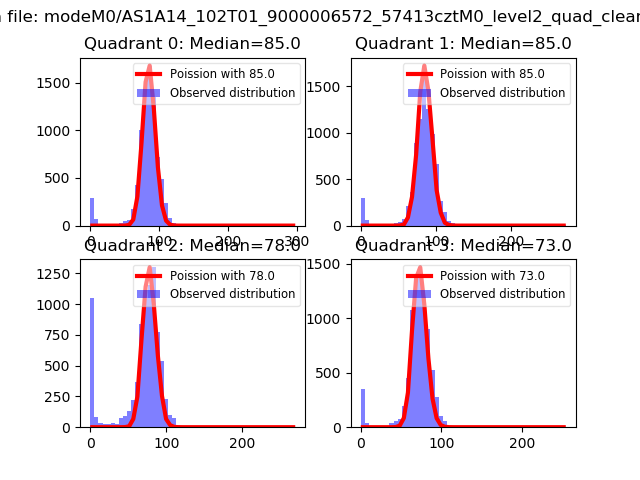 |
 |
| Quadrant-wise count rates Data is divided into 100 sec bins |
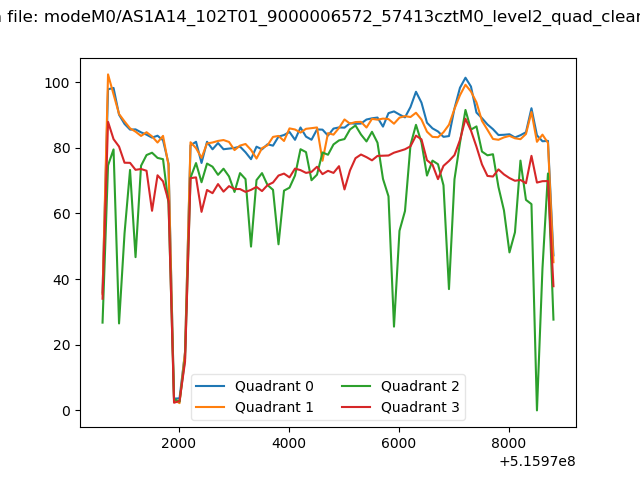 |
|
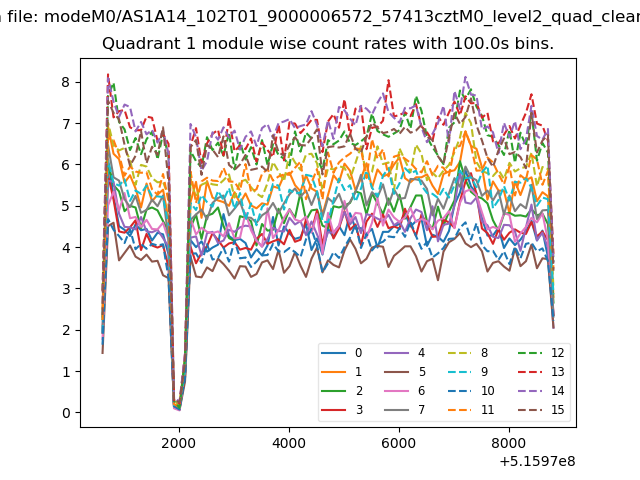
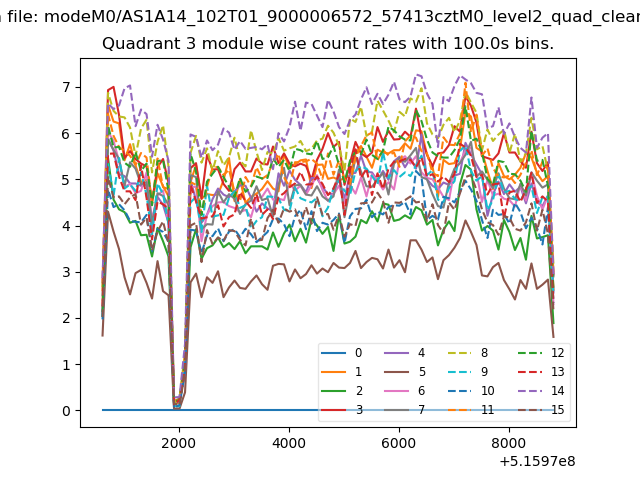
| Module-wise count rates for Quadrant A Data is divided into 100 sec bins |
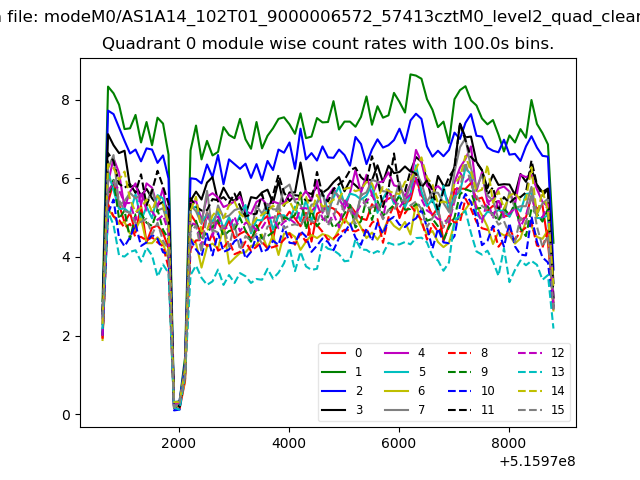 |
 |
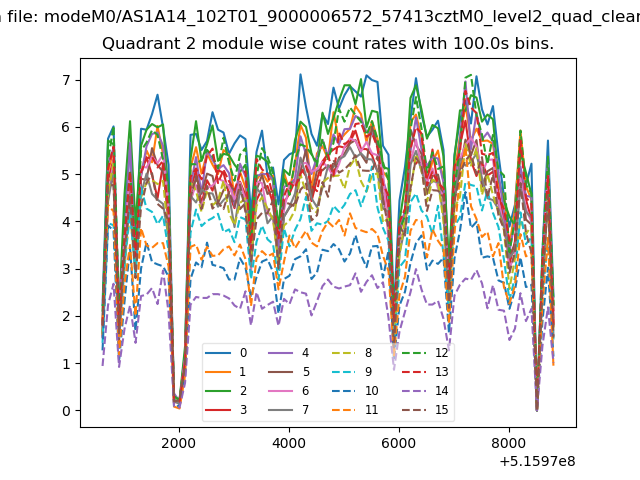
| Module-wise count rates for Quadrant B Data is divided into 100 sec bins |
 |
 |
| Module-wise count rates for Quadrant C Data is divided into 100 sec bins |
 |
 |
| Module-wise count rates for Quadrant D Data is divided into 100 sec bins |
 |
 |
| Parameter | Plot |
|---|---|
| CZT HV Monitor | 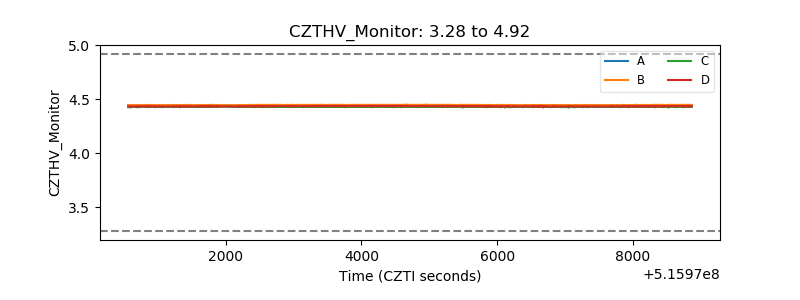 |
| D_VDD | 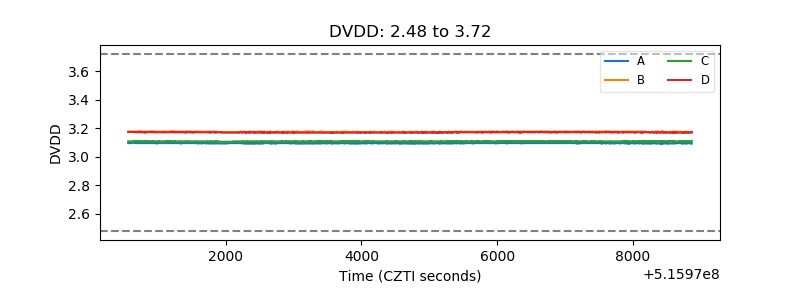 |
| Temperature 1 | 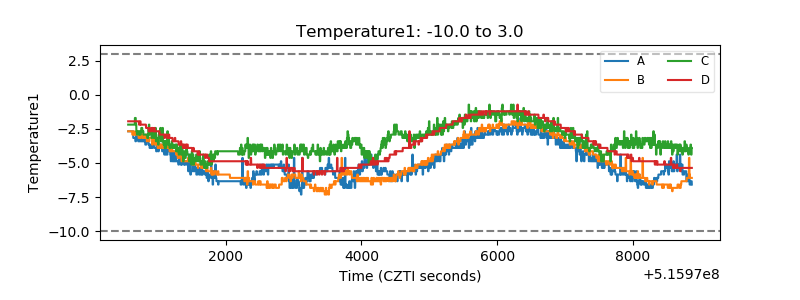 |
| Veto HV Monitor |  |
| Veto LLD | 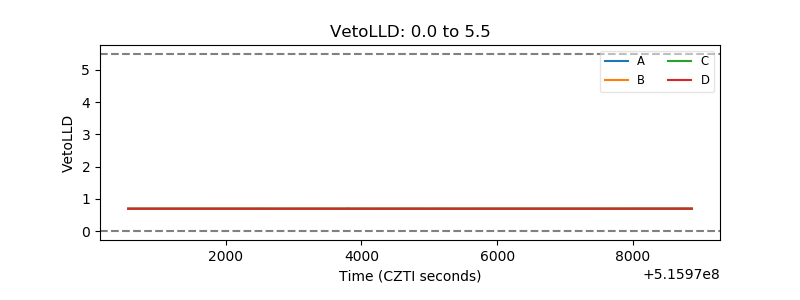 |
| Alpha Counter | 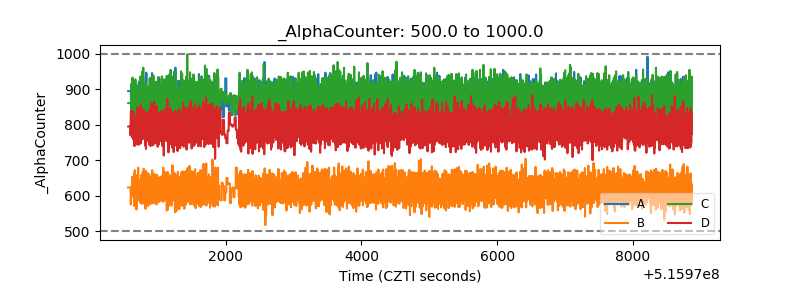 |
| _CPM_Rate | 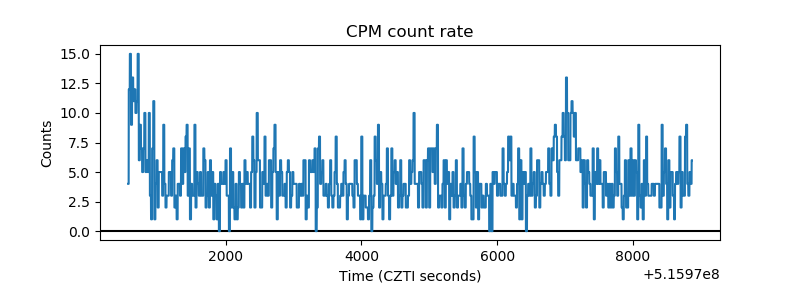 |
| CZT Counter | 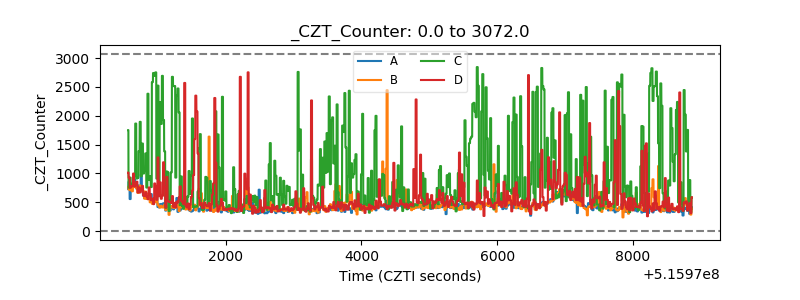 |
| +2.5 Volts monitor |  |
| +5 Volts monitor |  |
| _ROLL_ROT | 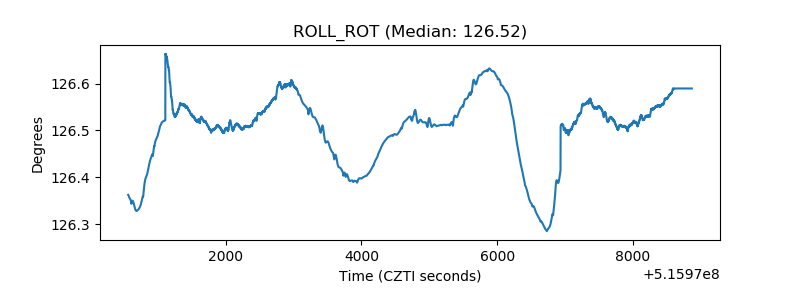 |
| _Roll_DEC | 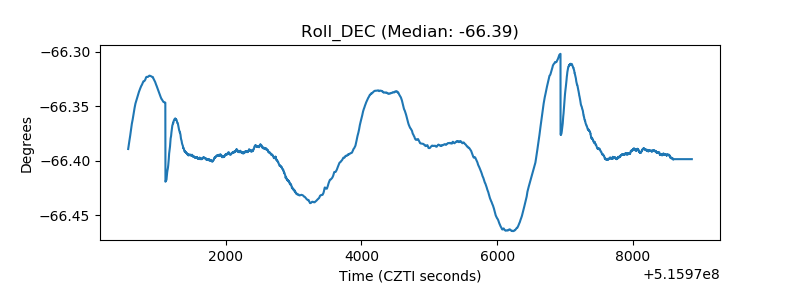 |
| _Roll_RA | 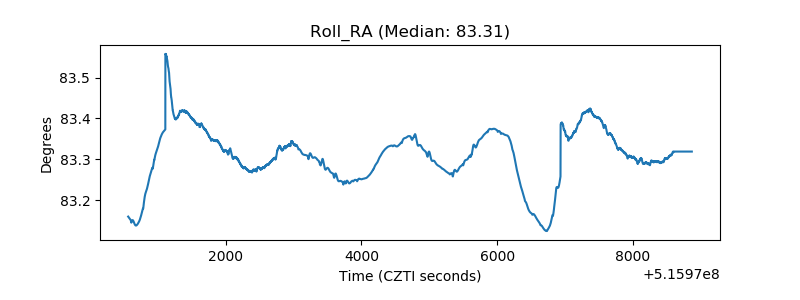 |
| Veto Counter | 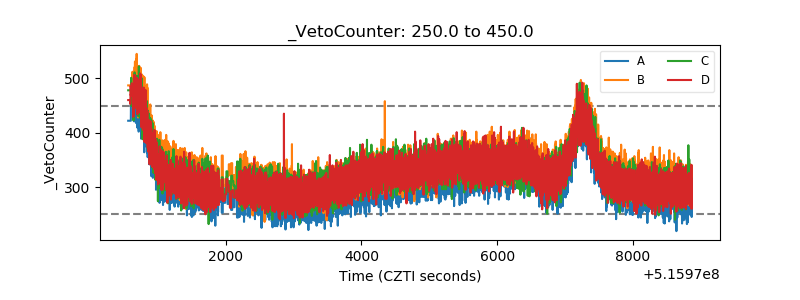 |