| Param | Original file | Final file |
|---|---|---|
| Filename | modeM0/AS1A14_102T01_9000006572_57417cztM0_level2.fits | modeM0/AS1A14_102T01_9000006572_57417cztM0_level2_quad_clean.evt |
| Size (bytes) | 1,952,441,280 | 358,246,080 |
| Size | 1.8 GB | 341.7 MB |
| Events in quadrant A | 18,772,543 | 2,376,313 |
| Events in quadrant B | 12,023,289 | 2,554,949 |
| Events in quadrant C | 24,726,583 | 2,022,843 |
| Events in quadrant D | 14,748,475 | 2,109,620 |
| Mode M0 | |||
|---|---|---|---|
| Quadrant | BADHDUFLAG | Total packets | Discarded packets |
| A | 0 | 75052 | 5 |
| B | 0 | 54976 | 5 |
| C | 0 | 91623 | 5 |
| D | 0 | 62371 | 5 |
| Mode M9 | |||
|---|---|---|---|
| Quadrant | BADHDUFLAG | Total packets | Discarded packets |
| A | 0 | 16 | 0 |
| B | 0 | 16 | 0 |
| C | 0 | 16 | 0 |
| D | 0 | 16 | 0 |
| Mode SS | |||
|---|---|---|---|
| Quadrant | BADHDUFLAG | Total packets | Discarded packets |
| A | 0 | 524 | 0 |
| B | 0 | 524 | 0 |
| C | 0 | 524 | 0 |
| D | 0 | 524 | 0 |
| Quadrant | Total seconds | Saturated seconds | Saturation percentage |
|---|---|---|---|
| A | 25909 | 918 | 3.543170% |
| B | 25910 | 492 | 1.898881% |
| C | 25910 | 3849 | 14.855268% |
| D | 25910 | 868 | 3.350058% |
Noise dominated data is calculated using 1-second bins in cleaned event files. If a bin has >2000 counts, and if more than 50% of those come from <1% of pixels, then it is considered to be noise-dominated and hence unusable.
| Quadrant | # 1 sec bins | Bins with >0 counts | Bins with >2000 counts | High rate bins dominated by noise | Noise dominated (total time) | Noise dominated (detector-on time) | Marked lightcurve |
|---|---|---|---|---|---|---|---|
| A | 27777 | 26181 | 500 | 500 | 1.80% | 1.91% | 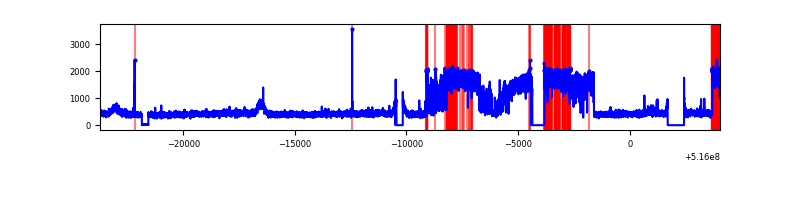 |
| B | 27778 | 26178 | 50 | 50 | 0.18% | 0.19% | 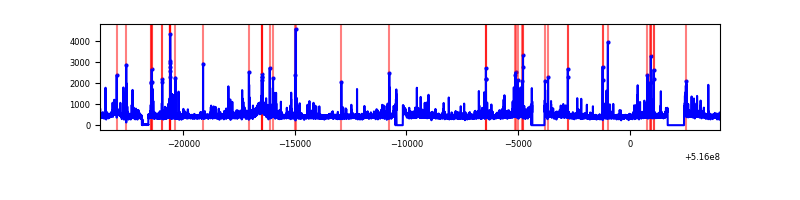 |
| C | 27778 | 26182 | 2964 | 2964 | 10.67% | 11.32% | 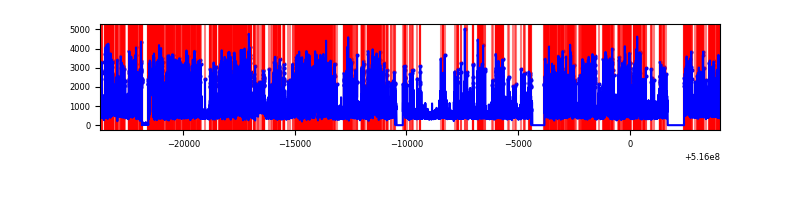 |
| D | 27778 | 26183 | 566 | 566 | 2.04% | 2.16% | 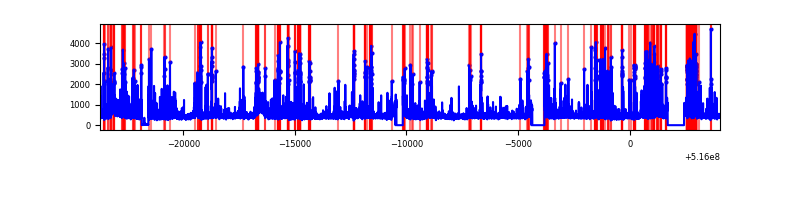 |
Top three noisy pixels from each quadrant. If the there are fewer than three noisy pixels in the level2.evt file, extra rows are filled as -1
| Pixel properties | Quadrant properties | ||||||
|---|---|---|---|---|---|---|---|
| Quadrant | DetID | PixID | Counts | Sigma | Mean | Median | Sigma |
| A | 0 | 12 | 7801749 | 11432.33 | 2789 | 2719 | 682.2 |
| A | 3 | 14 | 56626 | 79.02 | 2789 | 2719 | 682.2 |
| A | 13 | 254 | 37530 | 51.03 | 2789 | 2719 | 682.2 |
| B | 5 | 185 | 248803 | 419.16 | 2767 | 2660 | 587.2 |
| B | 7 | 252 | 212046 | 356.57 | 2767 | 2660 | 587.2 |
| B | 10 | 247 | 118070 | 196.53 | 2767 | 2660 | 587.2 |
| C | 15 | 224 | 12831384 | 18635.96 | 2560 | 2538 | 688.4 |
| C | 14 | 254 | 865312 | 1253.32 | 2560 | 2538 | 688.4 |
| C | 6 | 223 | 503844 | 728.23 | 2560 | 2538 | 688.4 |
| D | 8 | 240 | 967843 | 1278.51 | 2687 | 2567 | 755.0 |
| D | 7 | 96 | 806895 | 1065.34 | 2687 | 2567 | 755.0 |
| D | 3 | 12 | 702445 | 926.99 | 2687 | 2567 | 755.0 |
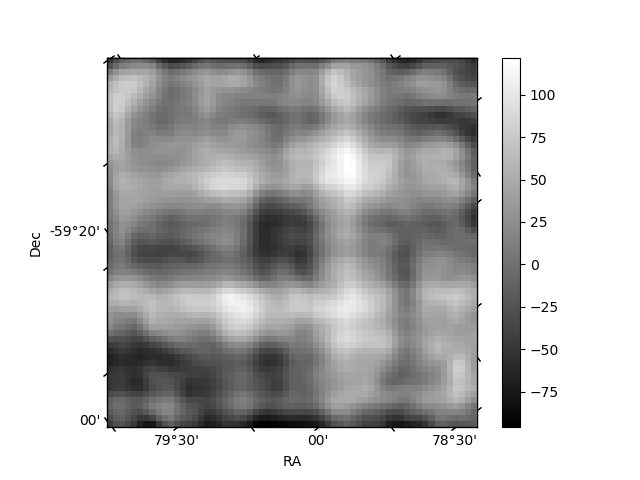
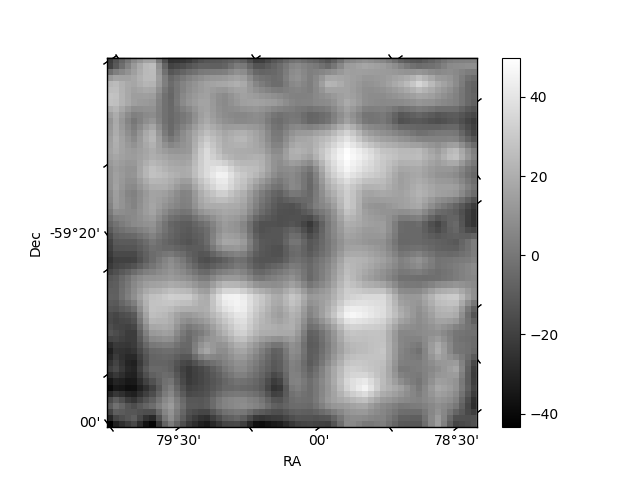
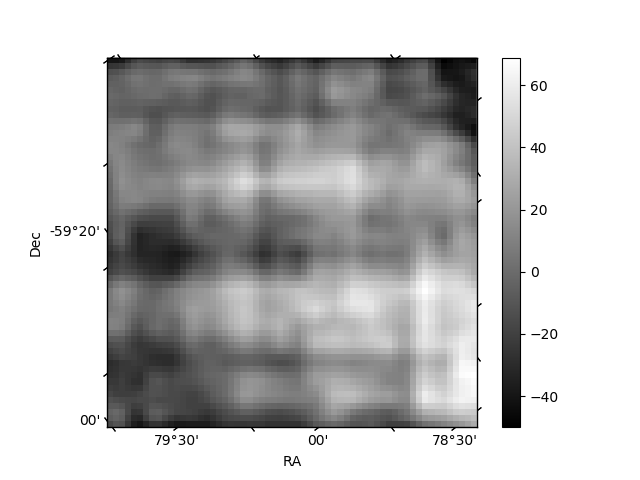
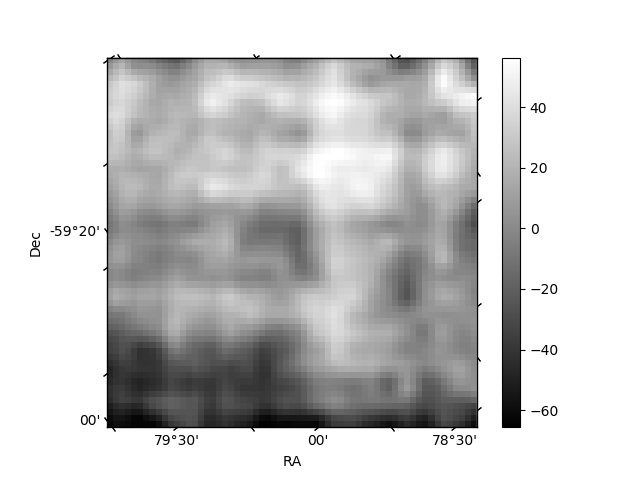
Histogram calculated using DETX and DETY for each event in the final _common_clean file
| Quadrant A | 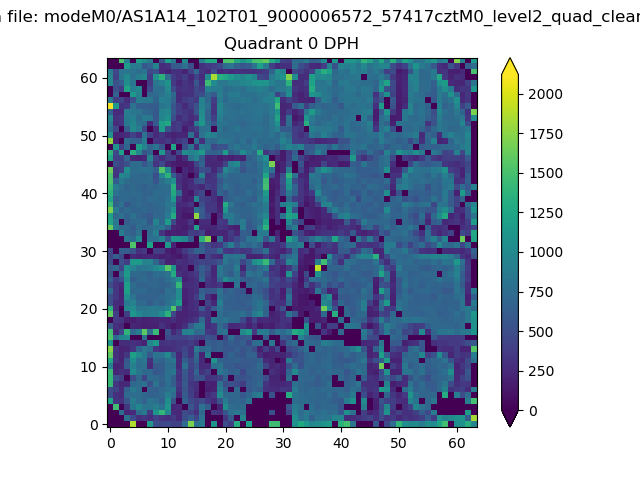 |
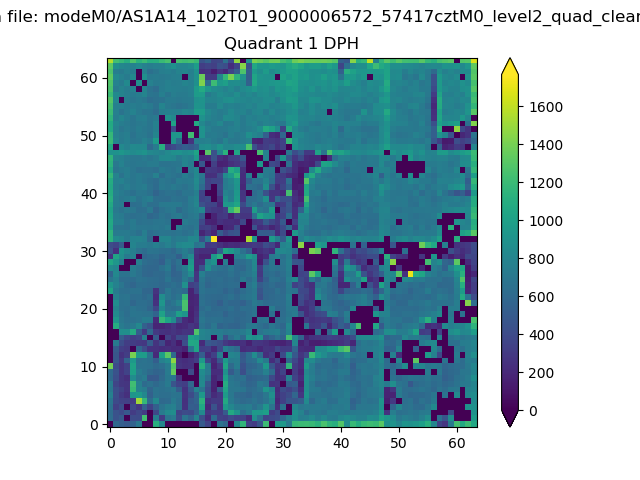 |
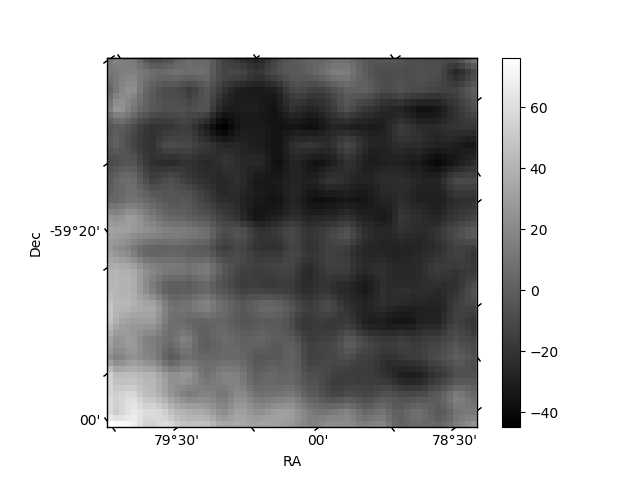
Quadrant B |
|---|---|---|---|
| Quadrant D | 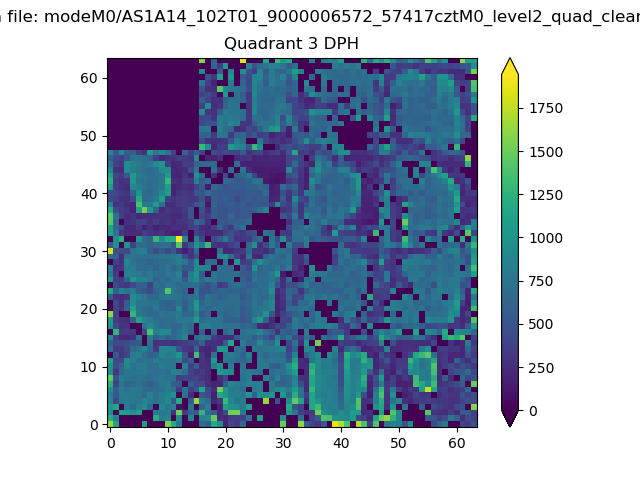 |
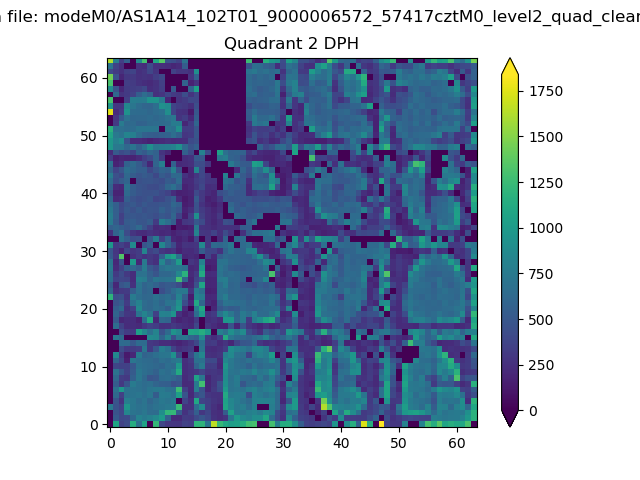 |
Quadrant C |
| Plot type | Count rate plots | Images |
|---|---|---|
| Comparison with Poisson distribution Blue bars denote a histogram of data divided into 1 sec bins. Red curve is a Poisson curve with rate = median count rate of data. |
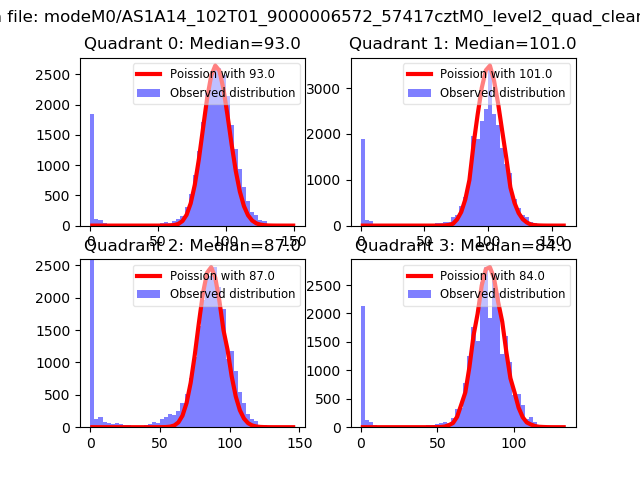 |
 |
| Quadrant-wise count rates Data is divided into 100 sec bins |
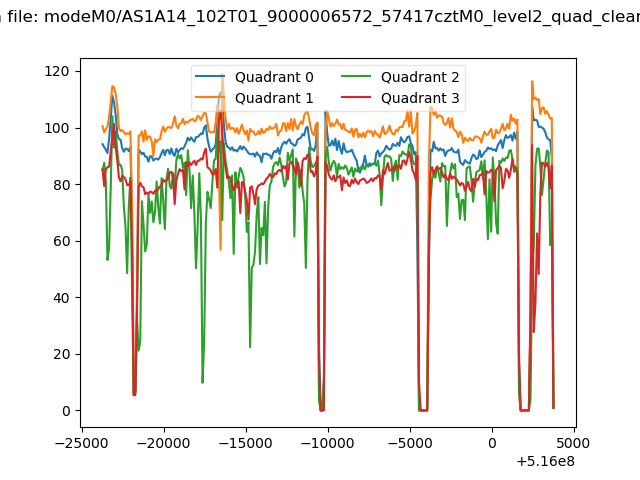 |
|
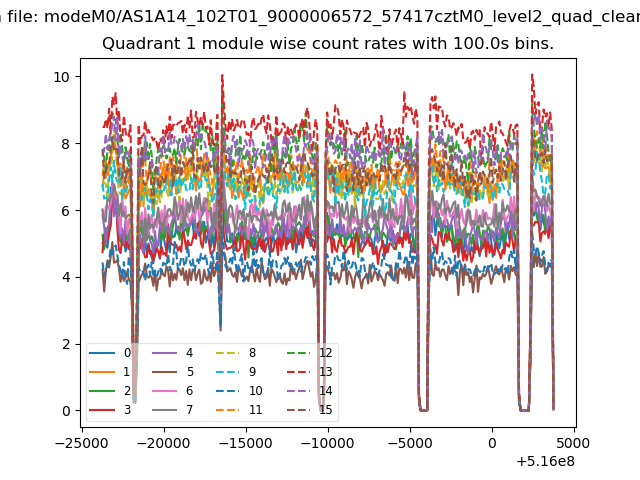
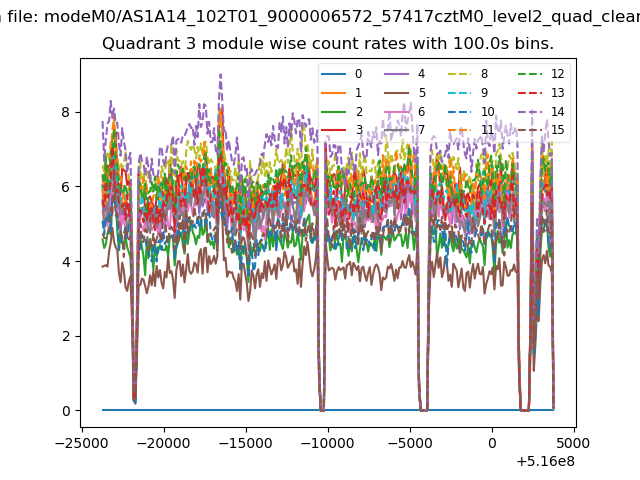
| Module-wise count rates for Quadrant A Data is divided into 100 sec bins |
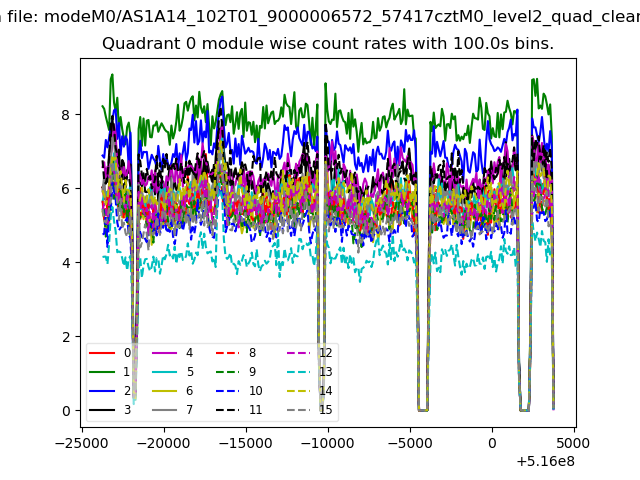 |
 |
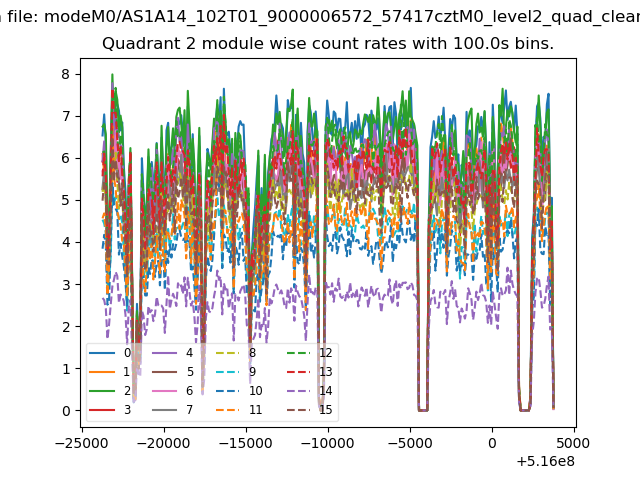
| Module-wise count rates for Quadrant B Data is divided into 100 sec bins |
 |
 |
| Module-wise count rates for Quadrant C Data is divided into 100 sec bins |
 |
 |
| Module-wise count rates for Quadrant D Data is divided into 100 sec bins |
 |
 |
| Parameter | Plot |
|---|---|
| CZT HV Monitor |  |
| D_VDD | 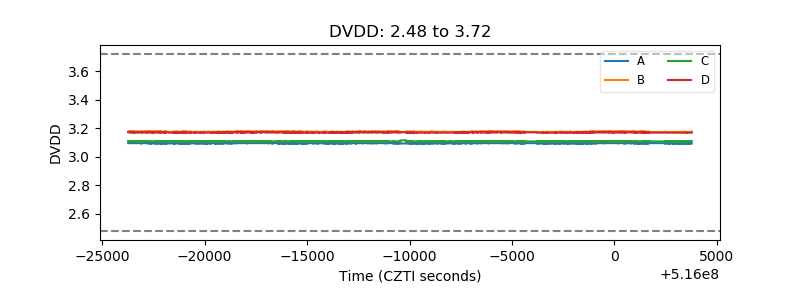 |
| Temperature 1 | 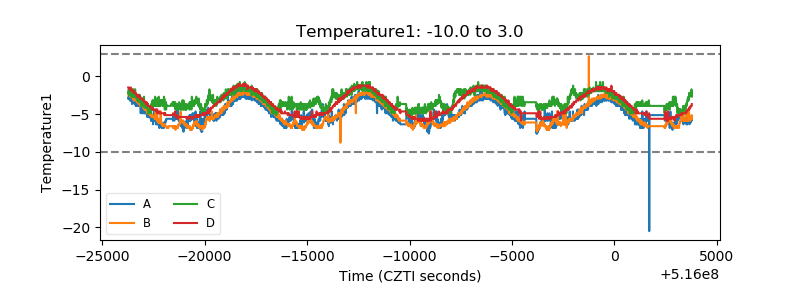 |
| Veto HV Monitor | 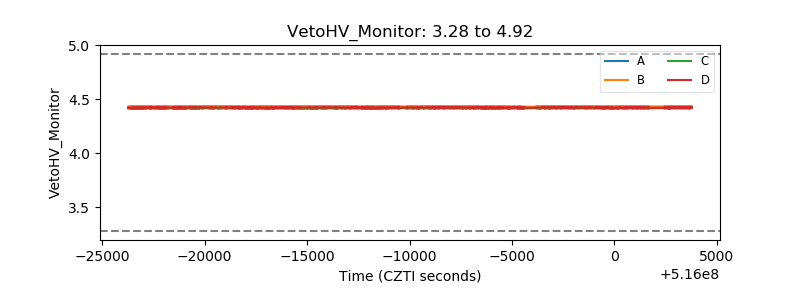 |
| Veto LLD | 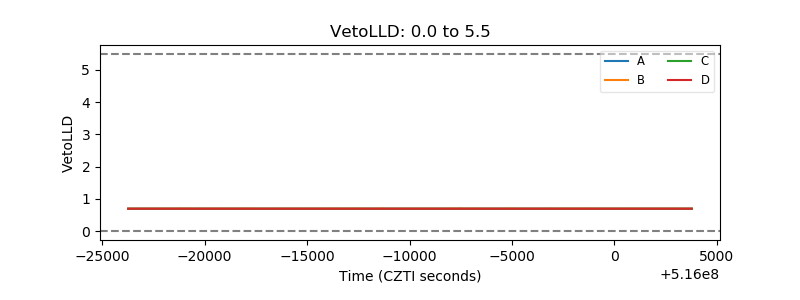 |
| Alpha Counter | 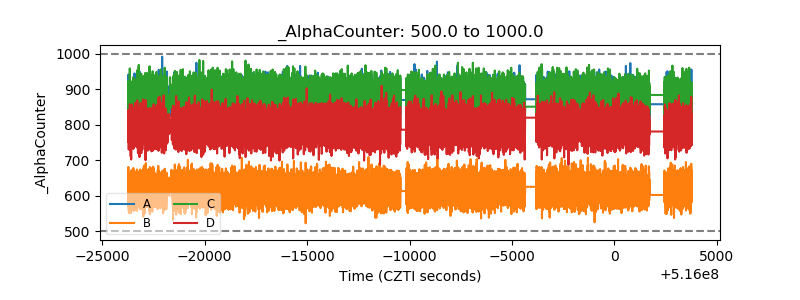 |
| _CPM_Rate | 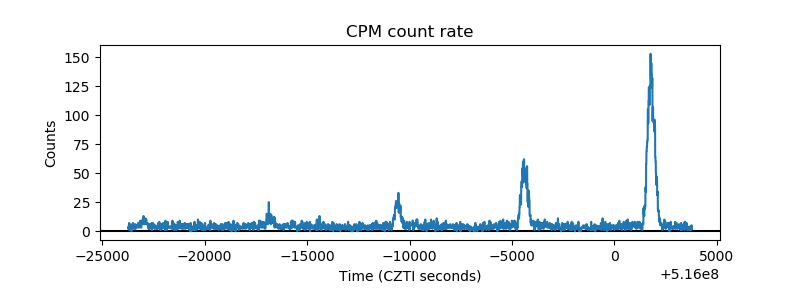 |
| CZT Counter | 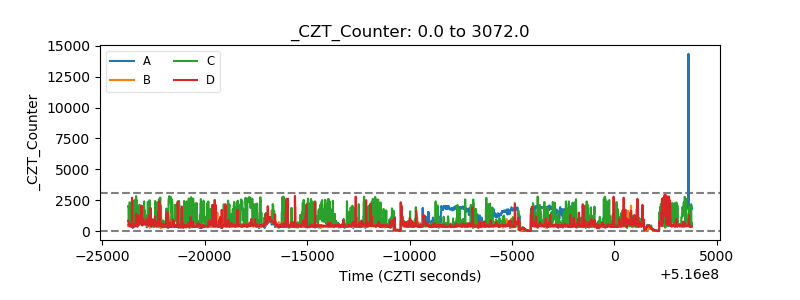 |
| +2.5 Volts monitor |  |
| +5 Volts monitor |  |
| _ROLL_ROT | 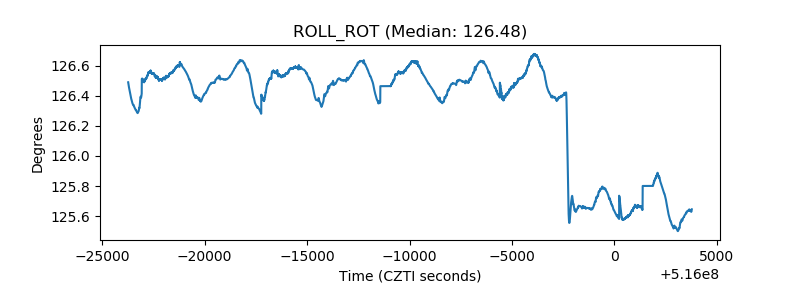 |
| _Roll_DEC | 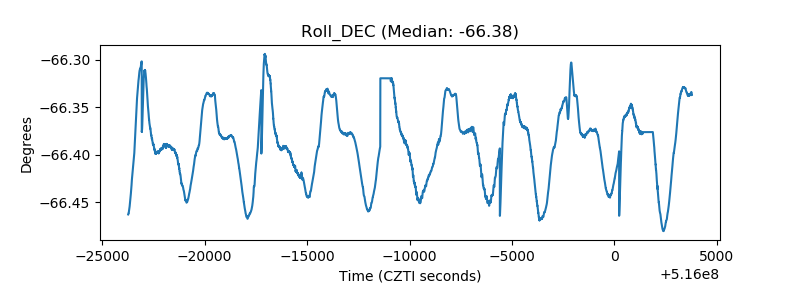 |
| _Roll_RA | 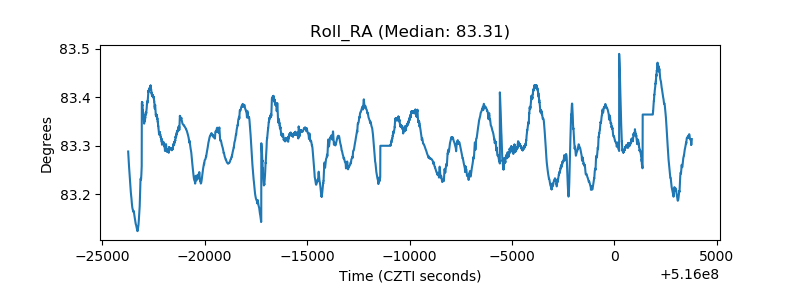 |
| Veto Counter | 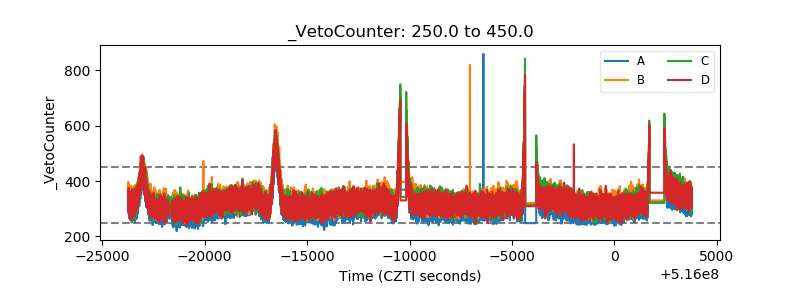 |