| Param | Original file | Final file |
|---|---|---|
| Filename | modeM0/AS1A14_102T01_9000006572_57420cztM0_level2.fits | modeM0/AS1A14_102T01_9000006572_57420cztM0_level2_quad_clean.evt |
| Size (bytes) | 501,439,680 | 94,328,640 |
| Size | 478.2 MB | 90.0 MB |
| Events in quadrant A | 3,744,366 | 625,070 |
| Events in quadrant B | 3,138,340 | 692,064 |
| Events in quadrant C | 6,785,523 | 521,485 |
| Events in quadrant D | 4,375,565 | 553,103 |
| Mode M0 | |||
|---|---|---|---|
| Quadrant | BADHDUFLAG | Total packets | Discarded packets |
| A | 0 | 15932 | 1 |
| B | 0 | 14183 | 1 |
| C | 0 | 24759 | 1 |
| D | 0 | 17717 | 1 |
| Mode M9 | |||
|---|---|---|---|
| Quadrant | BADHDUFLAG | Total packets | Discarded packets |
| A | 0 | 10 | 0 |
| B | 0 | 10 | 0 |
| C | 0 | 10 | 0 |
| D | 0 | 10 | 0 |
| Mode SS | |||
|---|---|---|---|
| Quadrant | BADHDUFLAG | Total packets | Discarded packets |
| A | 0 | 136 | 0 |
| B | 0 | 136 | 0 |
| C | 0 | 136 | 0 |
| D | 0 | 136 | 0 |
| Quadrant | Total seconds | Saturated seconds | Saturation percentage |
|---|---|---|---|
| A | 6659 | 301 | 4.520198% |
| B | 6659 | 86 | 1.291485% |
| C | 6659 | 1247 | 18.726536% |
| D | 6658 | 442 | 6.638630% |
Noise dominated data is calculated using 1-second bins in cleaned event files. If a bin has >2000 counts, and if more than 50% of those come from <1% of pixels, then it is considered to be noise-dominated and hence unusable.
| Quadrant | # 1 sec bins | Bins with >0 counts | Bins with >2000 counts | High rate bins dominated by noise | Noise dominated (total time) | Noise dominated (detector-on time) | Marked lightcurve |
|---|---|---|---|---|---|---|---|
| A | 7659 | 6659 | 185 | 185 | 2.42% | 2.78% | 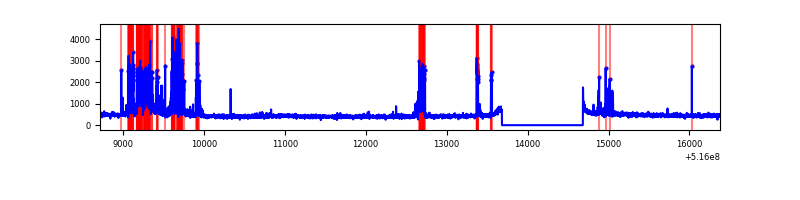 |
| B | 7659 | 6659 | 15 | 15 | 0.20% | 0.23% | 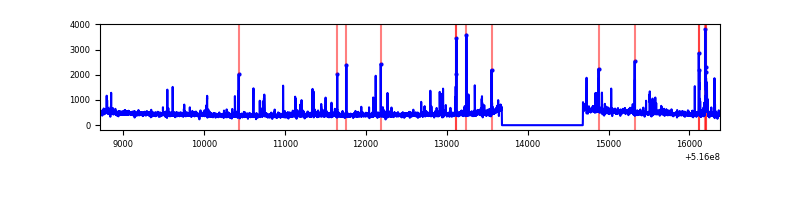 |
| C | 7659 | 6659 | 1090 | 1090 | 14.23% | 16.37% | 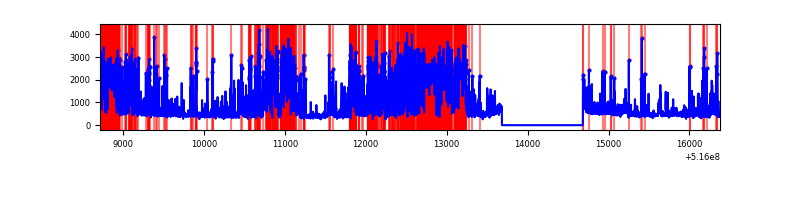 |
| D | 7658 | 6658 | 337 | 337 | 4.40% | 5.06% | 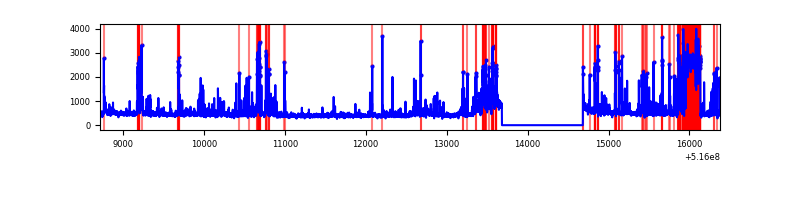 |
Top three noisy pixels from each quadrant. If the there are fewer than three noisy pixels in the level2.evt file, extra rows are filled as -1
| Pixel properties | Quadrant properties | ||||||
|---|---|---|---|---|---|---|---|
| Quadrant | DetID | PixID | Counts | Sigma | Mean | Median | Sigma |
| A | 10 | 251 | 829465 | 4714.44 | 714 | 695 | 175.8 |
| A | 7 | 64 | 109995 | 621.75 | 714 | 695 | 175.8 |
| A | 0 | 12 | 25117 | 138.92 | 714 | 695 | 175.8 |
| B | 5 | 185 | 71607 | 463.92 | 714 | 686 | 152.9 |
| B | 0 | 153 | 61936 | 400.66 | 714 | 686 | 152.9 |
| B | 0 | 63 | 35455 | 227.44 | 714 | 686 | 152.9 |
| C | 15 | 224 | 2841572 | 15996.17 | 646 | 642 | 177.6 |
| C | 6 | 223 | 1256369 | 7070.51 | 646 | 642 | 177.6 |
| C | 14 | 254 | 99973 | 559.29 | 646 | 642 | 177.6 |
| D | 7 | 96 | 754841 | 3906.49 | 685 | 653 | 193.1 |
| D | 8 | 240 | 382227 | 1976.45 | 685 | 653 | 193.1 |
| D | 2 | 249 | 261725 | 1352.28 | 685 | 653 | 193.1 |
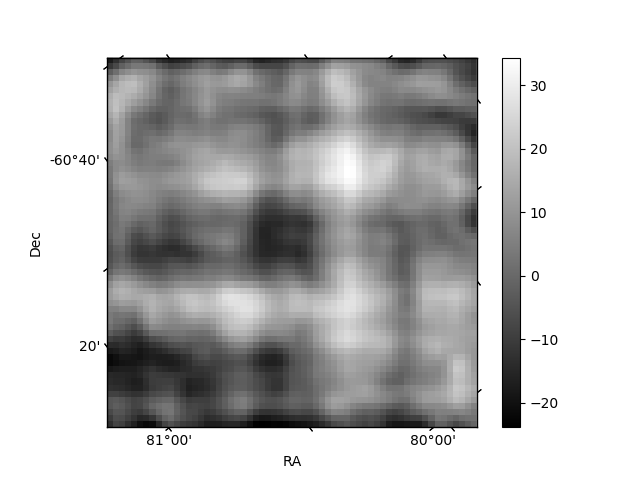
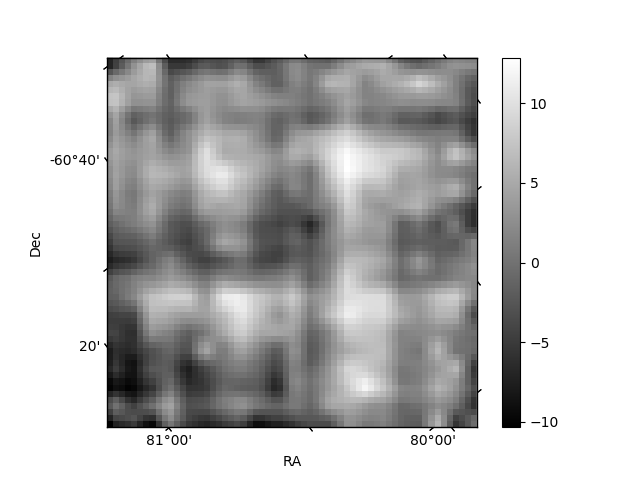
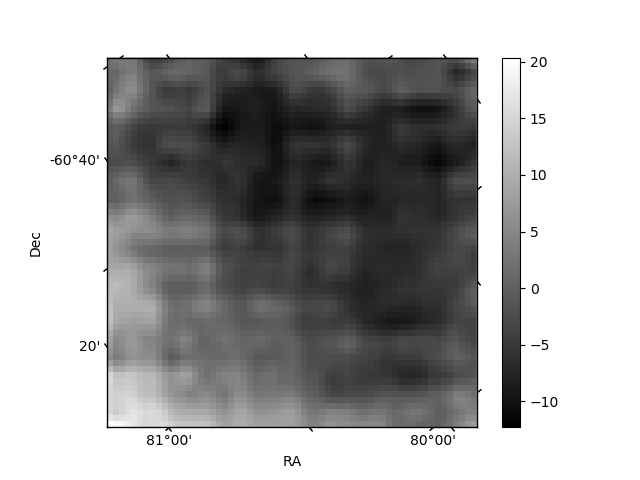
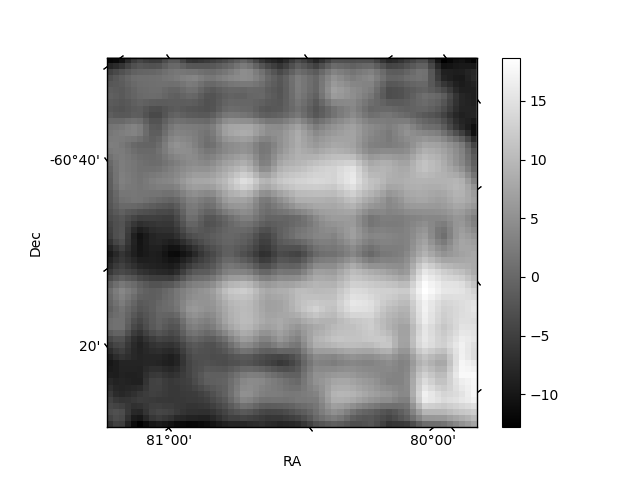
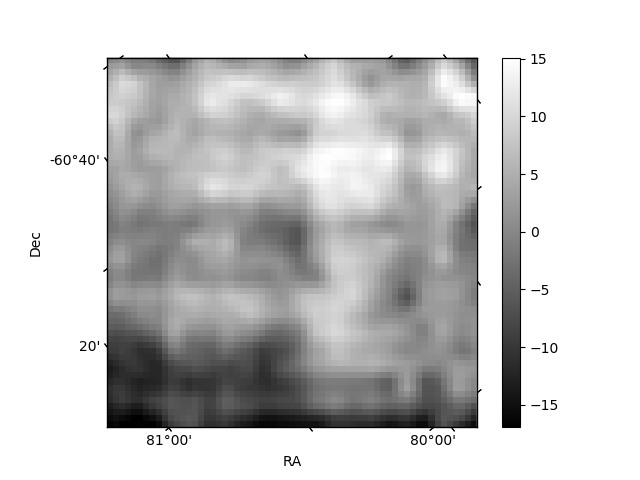
Histogram calculated using DETX and DETY for each event in the final _common_clean file
| Quadrant A | 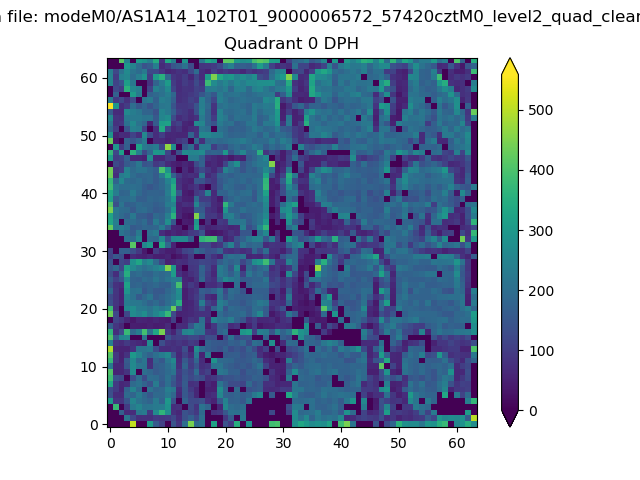 |
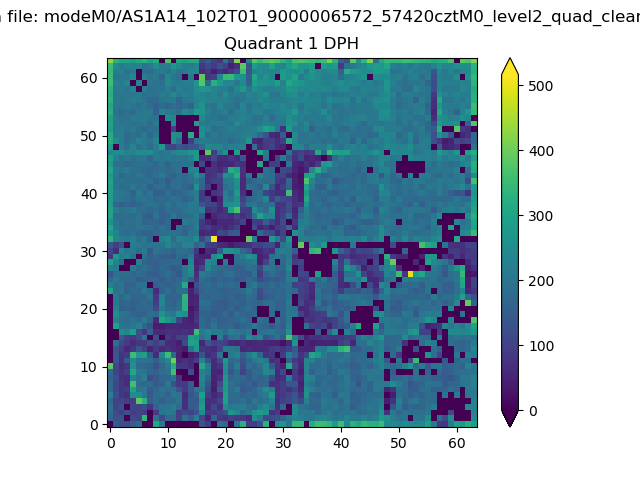 |
Quadrant B |
|---|---|---|---|
| Quadrant D | 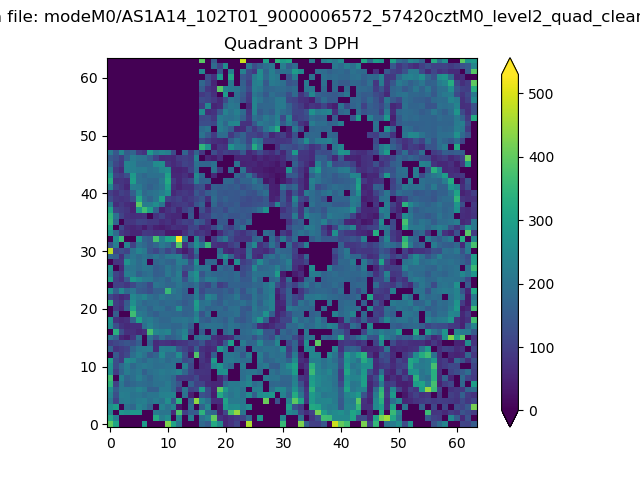 |
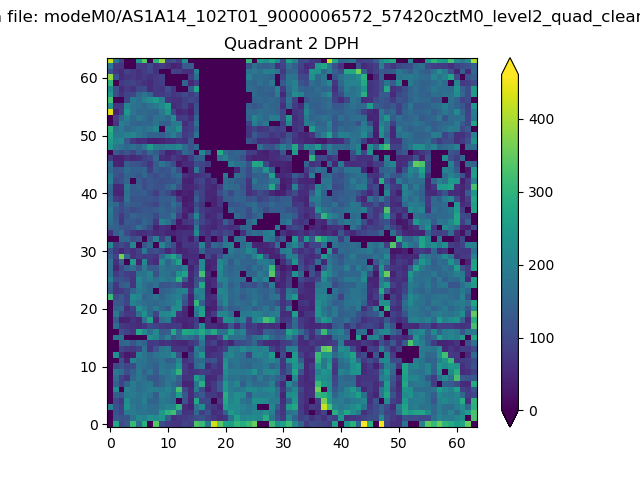 |
Quadrant C |
| Plot type | Count rate plots | Images |
|---|---|---|
| Comparison with Poisson distribution Blue bars denote a histogram of data divided into 1 sec bins. Red curve is a Poisson curve with rate = median count rate of data. |
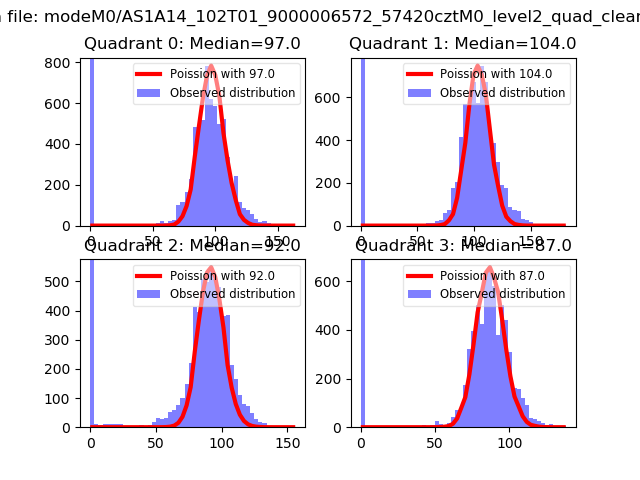 |
 |
| Quadrant-wise count rates Data is divided into 100 sec bins |
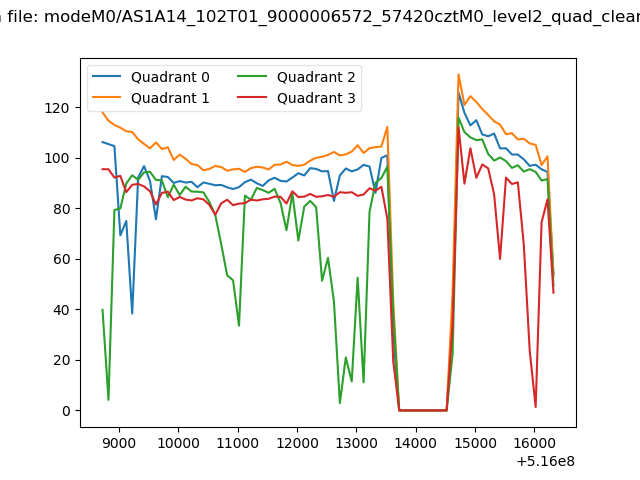 |
|
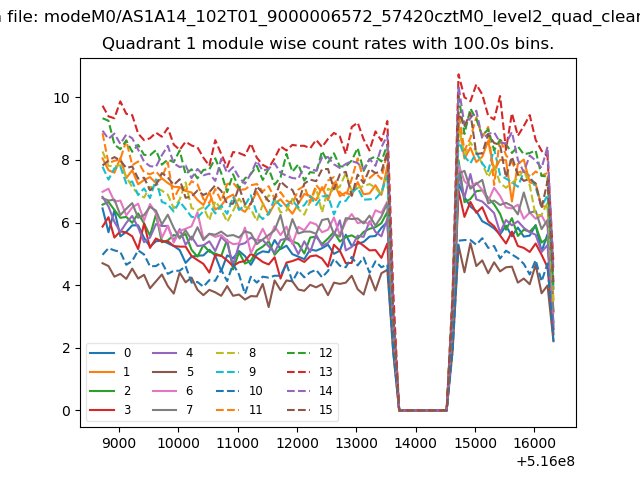
| Module-wise count rates for Quadrant A Data is divided into 100 sec bins |
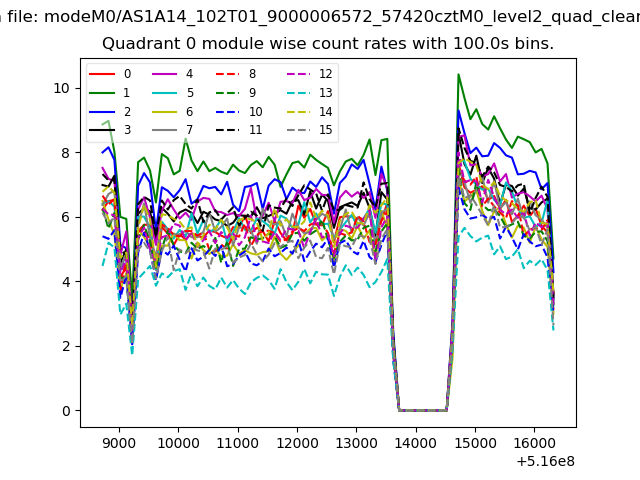 |
 |
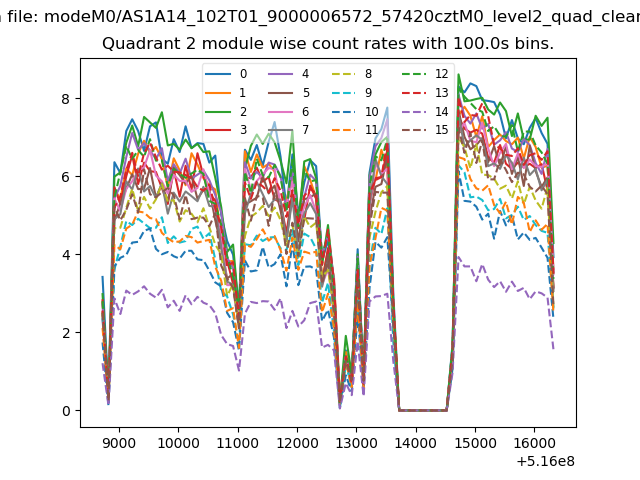
| Module-wise count rates for Quadrant B Data is divided into 100 sec bins |
 |
 |
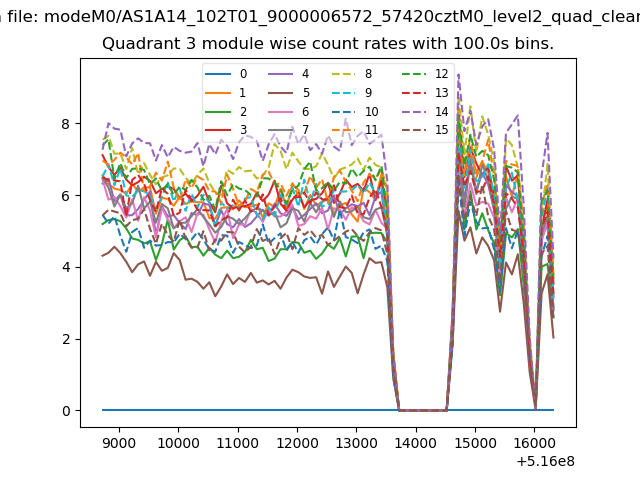
| Module-wise count rates for Quadrant C Data is divided into 100 sec bins |
 |
 |
| Module-wise count rates for Quadrant D Data is divided into 100 sec bins |
 |
 |
| Parameter | Plot |
|---|---|
| CZT HV Monitor | 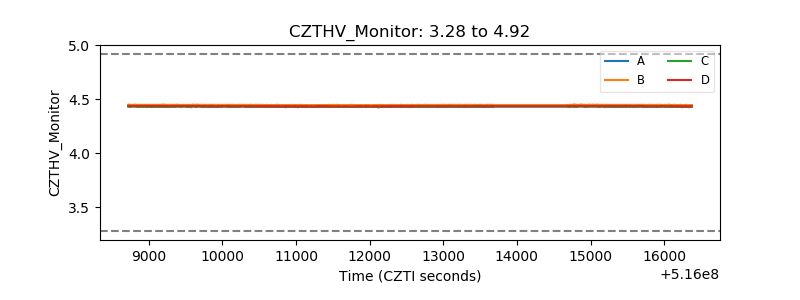 |
| D_VDD | 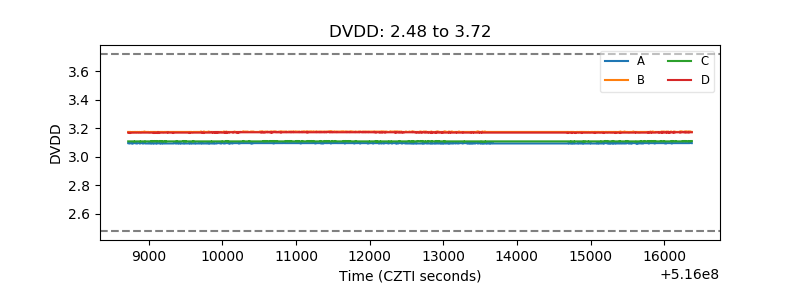 |
| Temperature 1 | 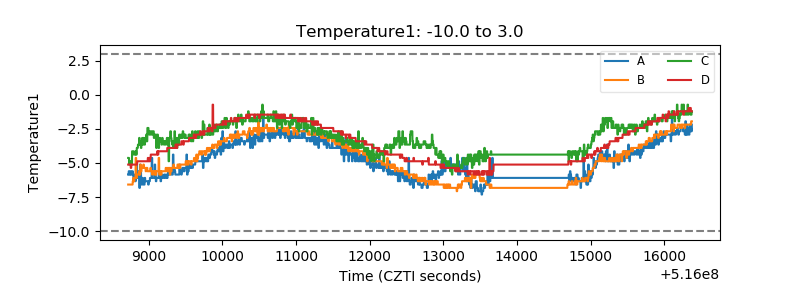 |
| Veto HV Monitor |  |
| Veto LLD | 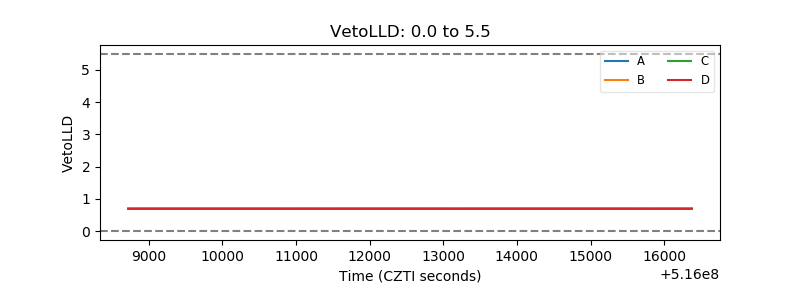 |
| Alpha Counter | 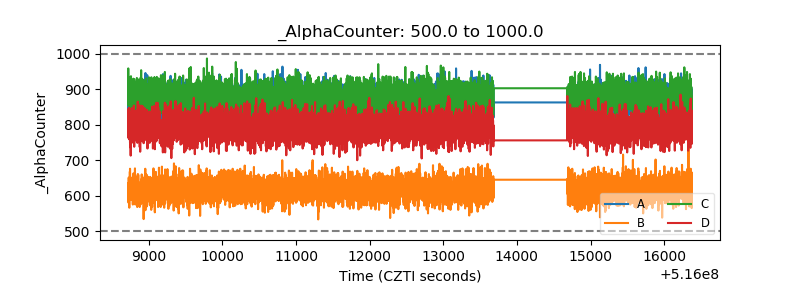 |
| _CPM_Rate | 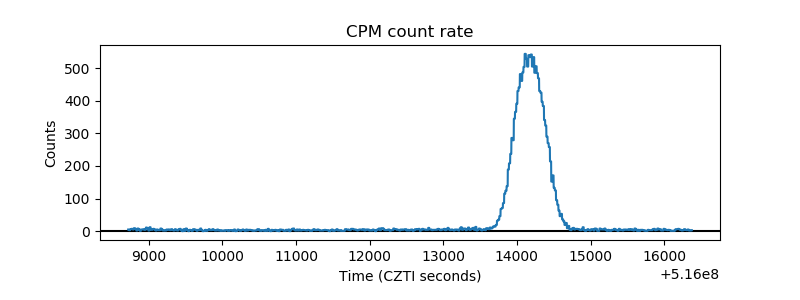 |
| CZT Counter | 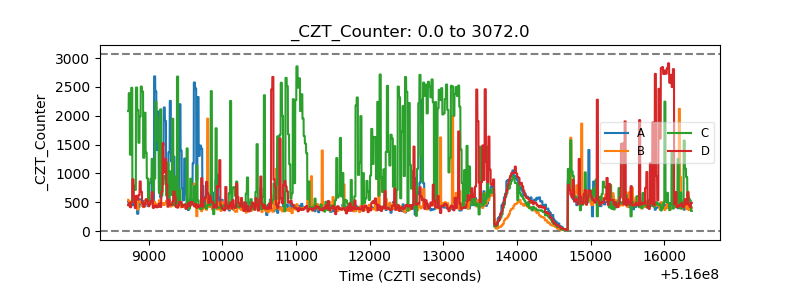 |
| +2.5 Volts monitor | 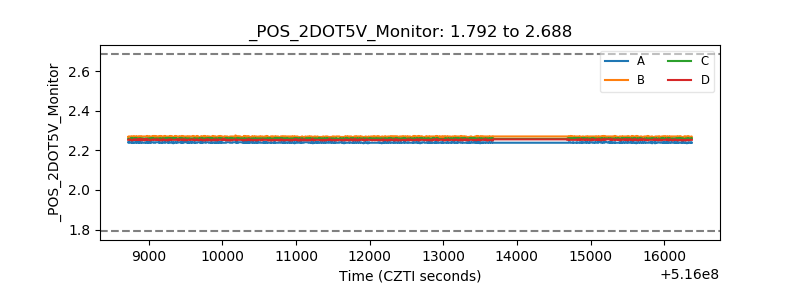 |
| +5 Volts monitor | 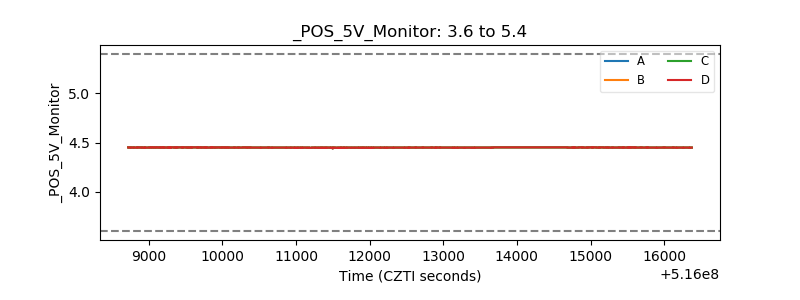 |
| _ROLL_ROT | 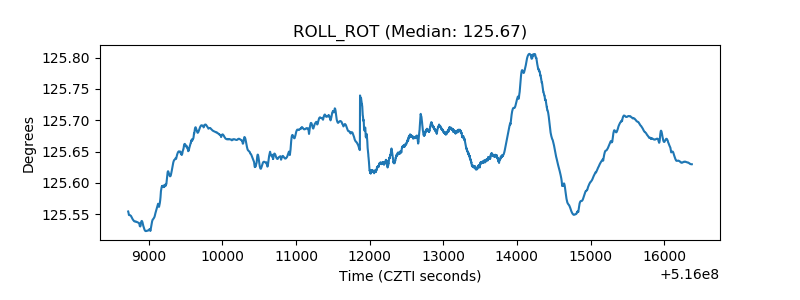 |
| _Roll_DEC | 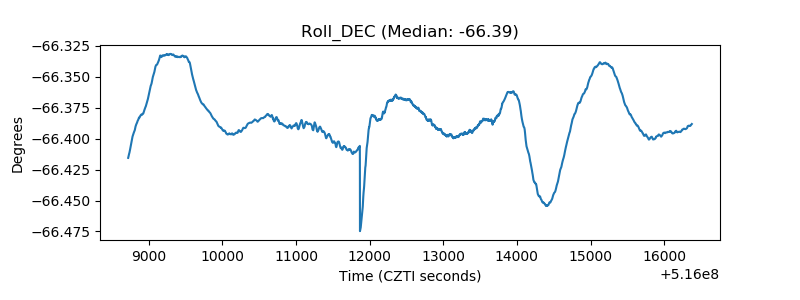 |
| _Roll_RA | 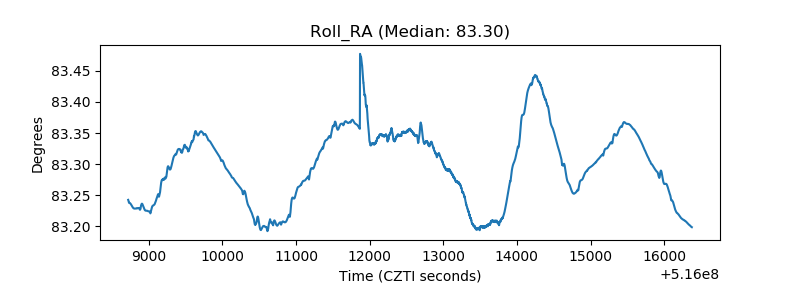 |
| Veto Counter | 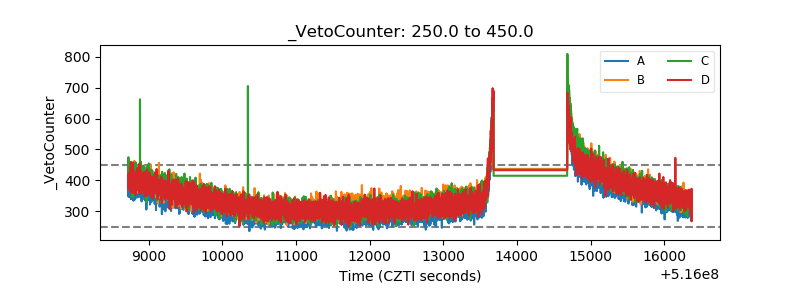 |