| Param | Original file | Final file |
|---|---|---|
| Filename | modeM0/AS1A14_102T01_9000006572_57421cztM0_level2.fits | modeM0/AS1A14_102T01_9000006572_57421cztM0_level2_quad_clean.evt |
| Size (bytes) | 393,068,160 | 87,194,880 |
| Size | 374.9 MB | 83.2 MB |
| Events in quadrant A | 2,812,912 | 578,216 |
| Events in quadrant B | 2,793,602 | 621,498 |
| Events in quadrant C | 4,650,863 | 531,945 |
| Events in quadrant D | 3,833,358 | 496,212 |
| Mode M0 | |||
|---|---|---|---|
| Quadrant | BADHDUFLAG | Total packets | Discarded packets |
| A | 0 | 12395 | 1 |
| B | 0 | 12555 | 1 |
| C | 0 | 17975 | 1 |
| D | 0 | 15566 | 1 |
| Mode M9 | |||
|---|---|---|---|
| Quadrant | BADHDUFLAG | Total packets | Discarded packets |
| A | 0 | 11 | 0 |
| B | 0 | 11 | 0 |
| C | 0 | 11 | 0 |
| D | 0 | 11 | 0 |
| Mode SS | |||
|---|---|---|---|
| Quadrant | BADHDUFLAG | Total packets | Discarded packets |
| A | 0 | 120 | 0 |
| B | 0 | 120 | 0 |
| C | 0 | 120 | 0 |
| D | 0 | 120 | 0 |
| Quadrant | Total seconds | Saturated seconds | Saturation percentage |
|---|---|---|---|
| A | 5900 | 105 | 1.779661% |
| B | 5901 | 85 | 1.440434% |
| C | 5901 | 411 | 6.964921% |
| D | 5901 | 411 | 6.964921% |
Noise dominated data is calculated using 1-second bins in cleaned event files. If a bin has >2000 counts, and if more than 50% of those come from <1% of pixels, then it is considered to be noise-dominated and hence unusable.
| Quadrant | # 1 sec bins | Bins with >0 counts | Bins with >2000 counts | High rate bins dominated by noise | Noise dominated (total time) | Noise dominated (detector-on time) | Marked lightcurve |
|---|---|---|---|---|---|---|---|
| A | 6985 | 5900 | 34 | 34 | 0.49% | 0.58% | 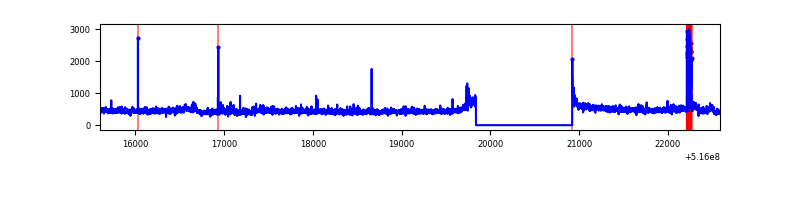 |
| B | 6986 | 5901 | 12 | 12 | 0.17% | 0.20% | 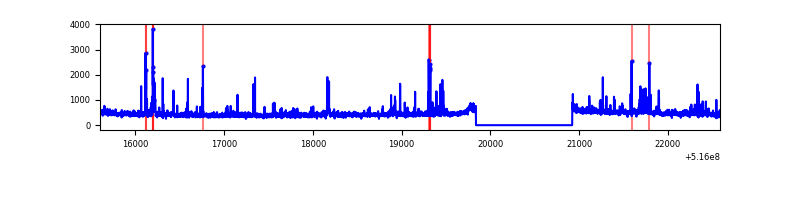 |
| C | 6985 | 5900 | 343 | 343 | 4.91% | 5.81% | 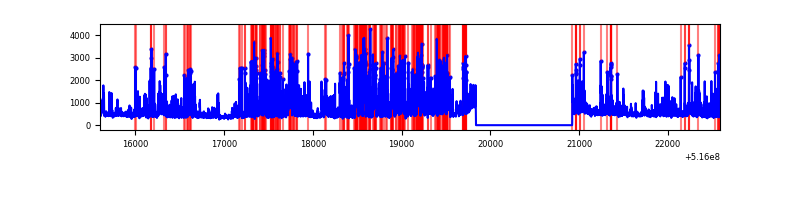 |
| D | 6986 | 5901 | 323 | 323 | 4.62% | 5.47% | 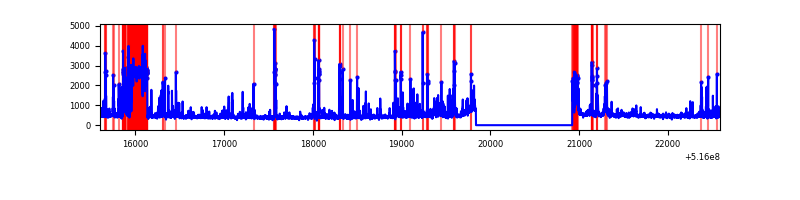 |
Top three noisy pixels from each quadrant. If the there are fewer than three noisy pixels in the level2.evt file, extra rows are filled as -1
| Pixel properties | Quadrant properties | ||||||
|---|---|---|---|---|---|---|---|
| Quadrant | DetID | PixID | Counts | Sigma | Mean | Median | Sigma |
| A | 7 | 64 | 162615 | 1026.62 | 646 | 631 | 157.8 |
| A | 10 | 251 | 98221 | 618.51 | 646 | 631 | 157.8 |
| A | 0 | 12 | 26102 | 161.43 | 646 | 631 | 157.8 |
| B | 5 | 185 | 69393 | 508.73 | 630 | 607 | 135.2 |
| B | 0 | 153 | 67948 | 498.04 | 630 | 607 | 135.2 |
| B | 0 | 63 | 38492 | 280.19 | 630 | 607 | 135.2 |
| C | 15 | 224 | 1688750 | 10306.13 | 602 | 597 | 163.8 |
| C | 6 | 223 | 368052 | 2243.3 | 602 | 597 | 163.8 |
| C | 14 | 254 | 173553 | 1055.89 | 602 | 597 | 163.8 |
| D | 7 | 96 | 658273 | 3790.6 | 605 | 579 | 173.5 |
| D | 15 | 142 | 226270 | 1300.76 | 605 | 579 | 173.5 |
| D | 3 | 12 | 159655 | 916.83 | 605 | 579 | 173.5 |
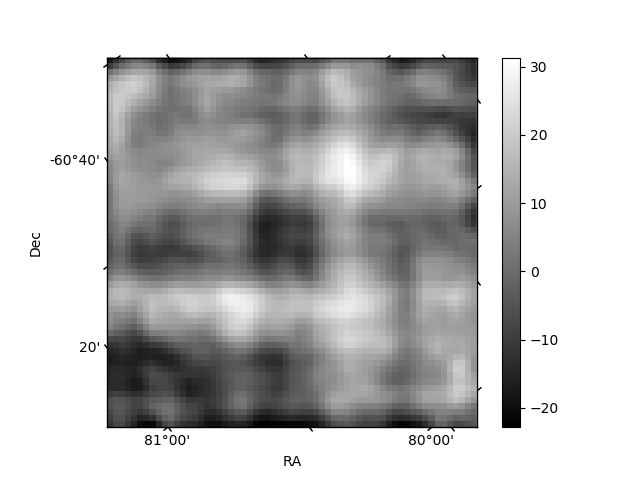
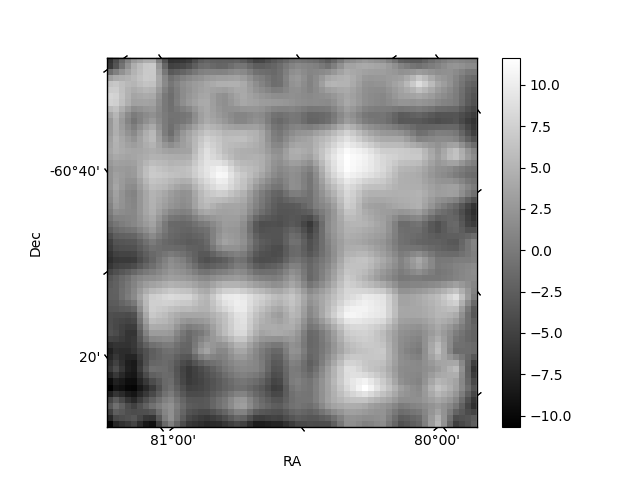
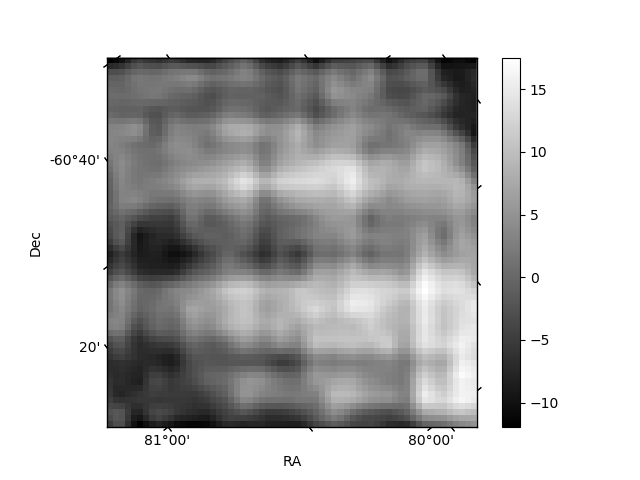
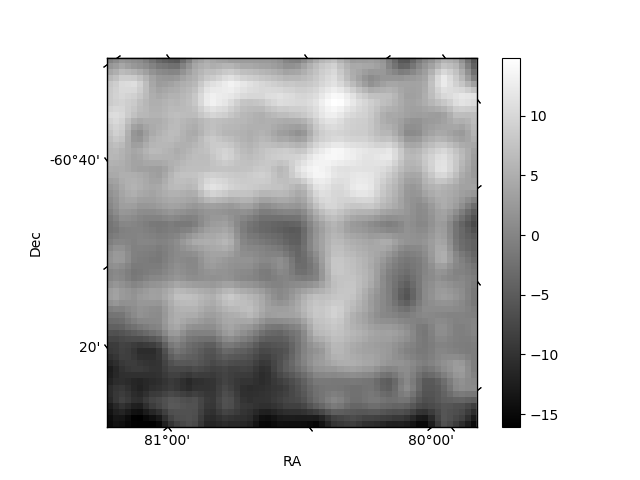
Histogram calculated using DETX and DETY for each event in the final _common_clean file
| Quadrant A | 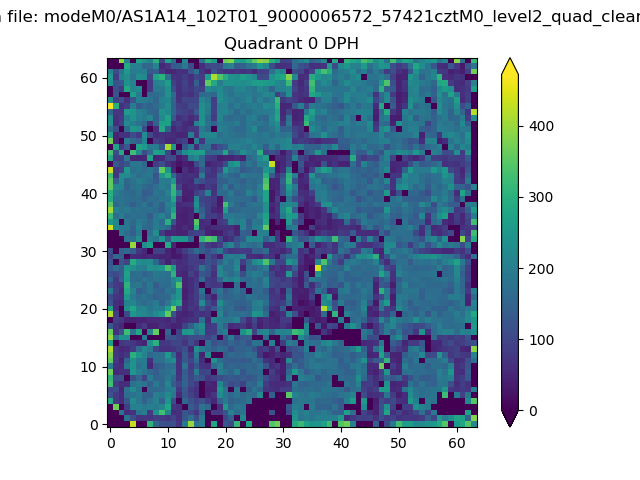 |
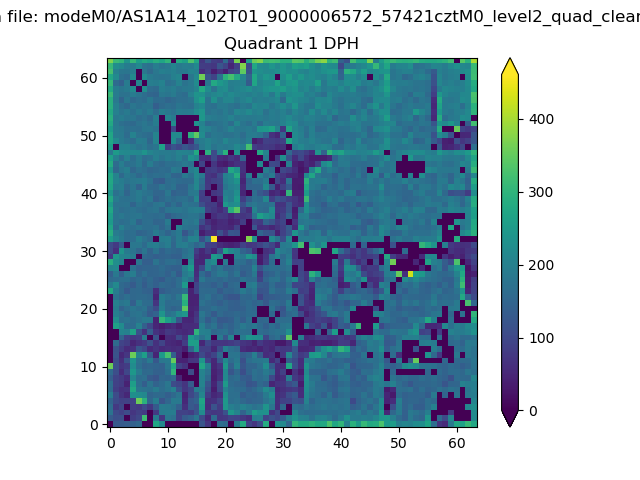 |
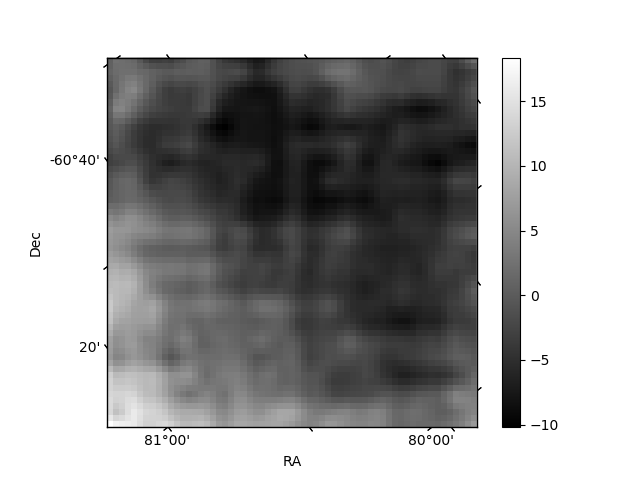
Quadrant B |
|---|---|---|---|
| Quadrant D | 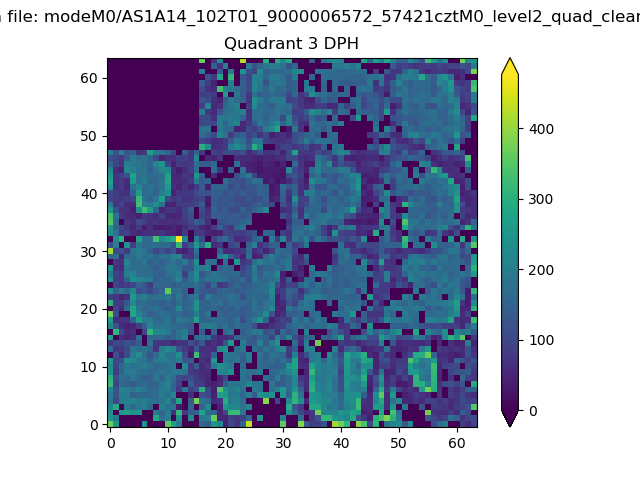 |
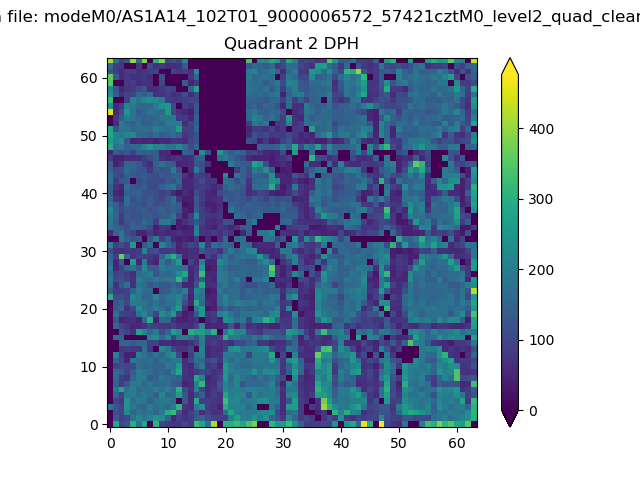 |
Quadrant C |
| Plot type | Count rate plots | Images |
|---|---|---|
| Comparison with Poisson distribution Blue bars denote a histogram of data divided into 1 sec bins. Red curve is a Poisson curve with rate = median count rate of data. |
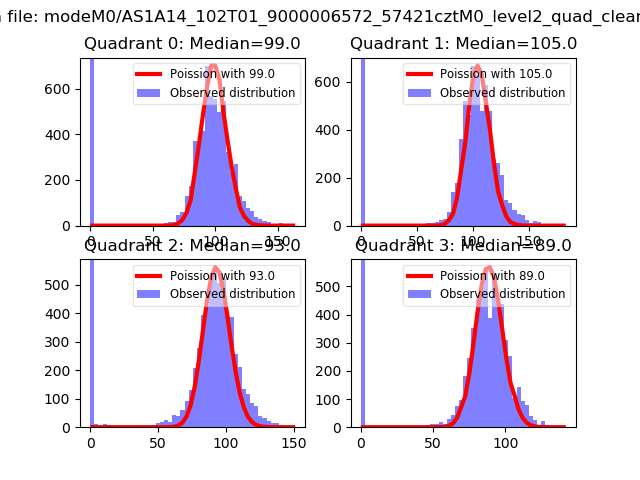 |
 |
| Quadrant-wise count rates Data is divided into 100 sec bins |
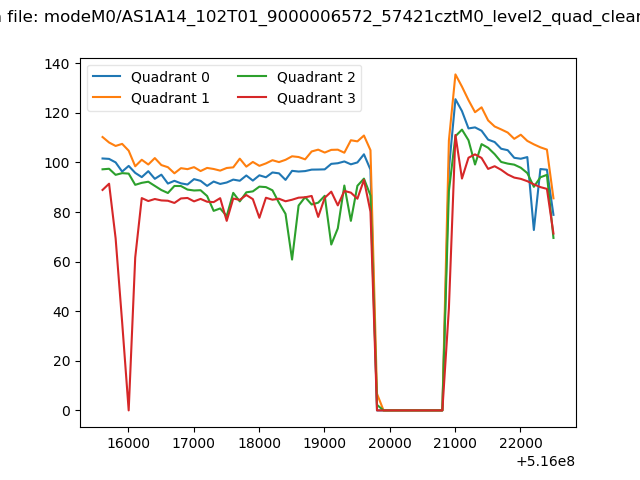 |
|
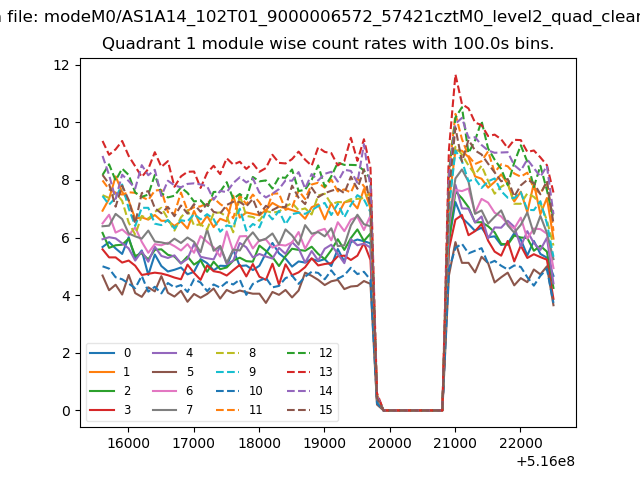
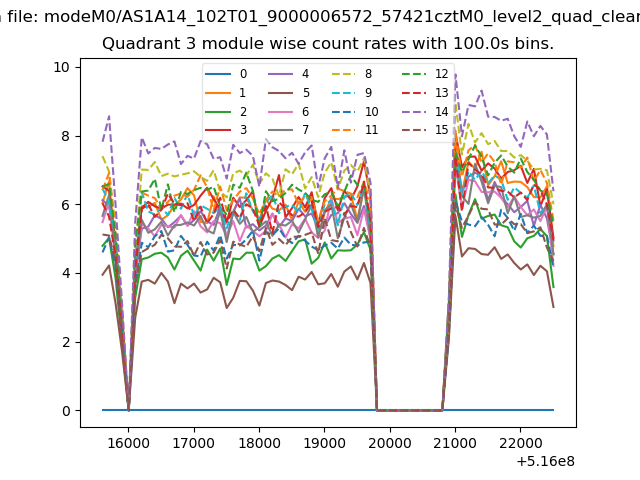
| Module-wise count rates for Quadrant A Data is divided into 100 sec bins |
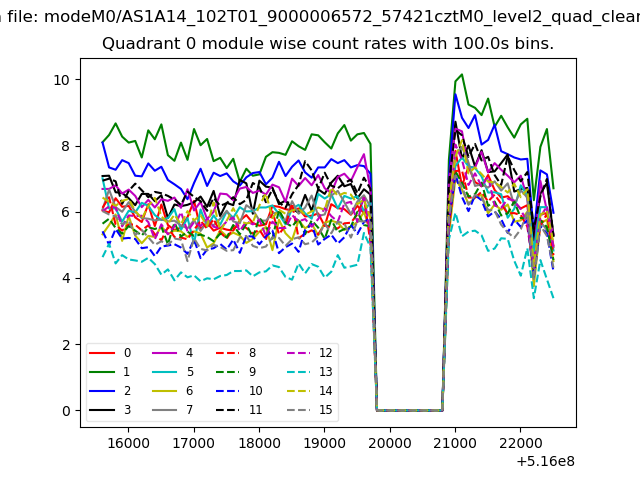 |
 |
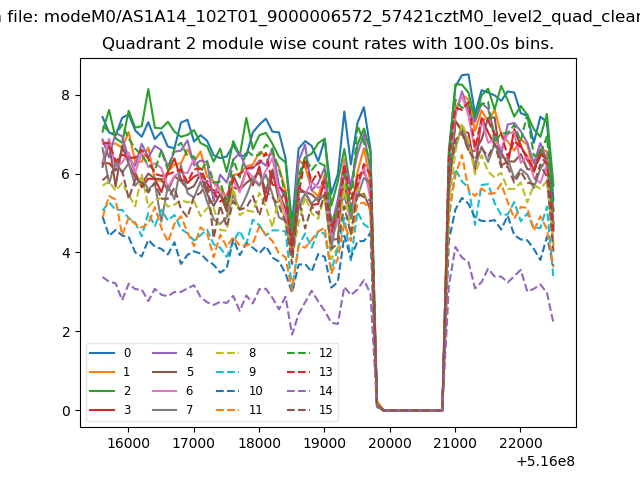
| Module-wise count rates for Quadrant B Data is divided into 100 sec bins |
 |
 |
| Module-wise count rates for Quadrant C Data is divided into 100 sec bins |
 |
 |
| Module-wise count rates for Quadrant D Data is divided into 100 sec bins |
 |
 |
| Parameter | Plot |
|---|---|
| CZT HV Monitor | 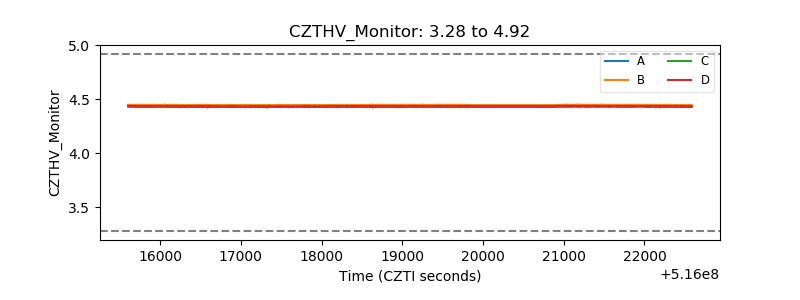 |
| D_VDD | 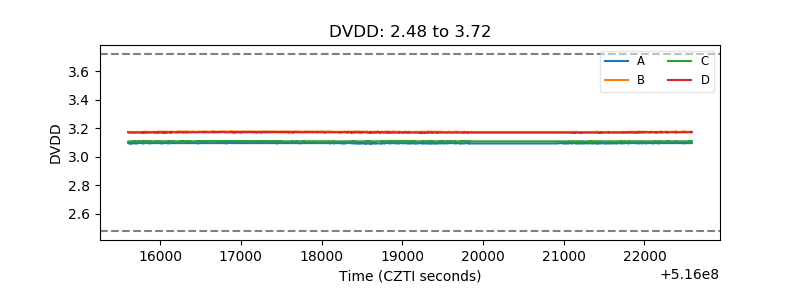 |
| Temperature 1 | 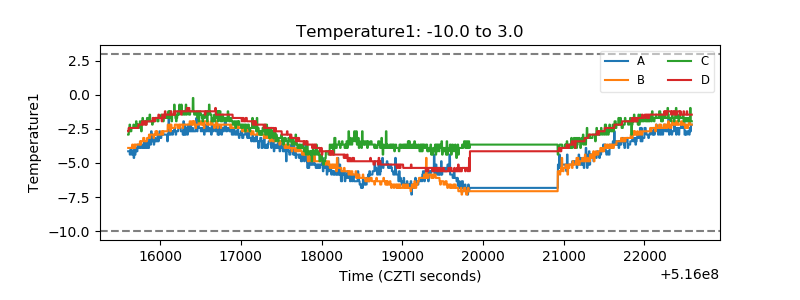 |
| Veto HV Monitor | 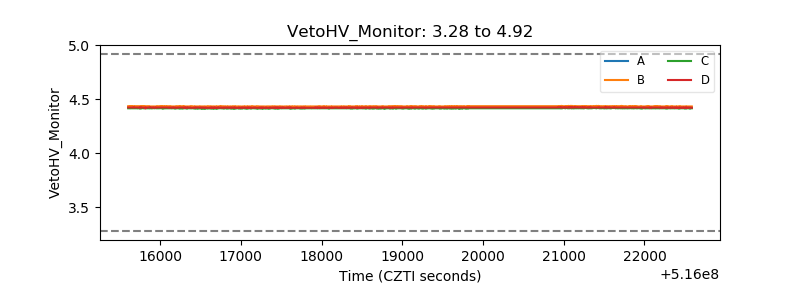 |
| Veto LLD | 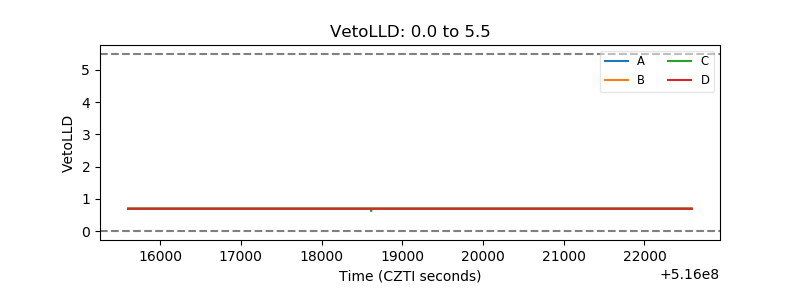 |
| Alpha Counter | 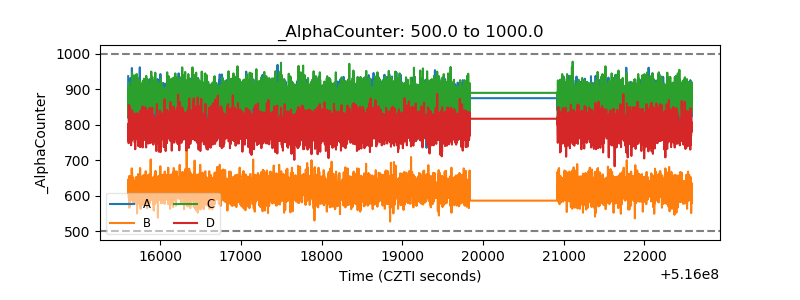 |
| _CPM_Rate | 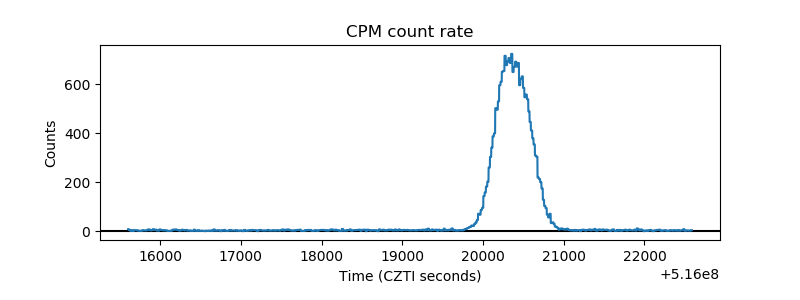 |
| CZT Counter | 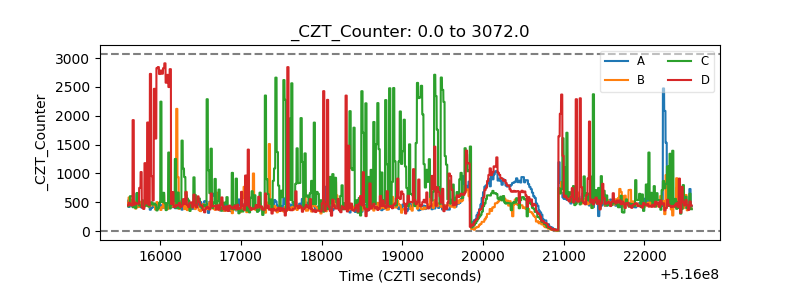 |
| +2.5 Volts monitor |  |
| +5 Volts monitor | 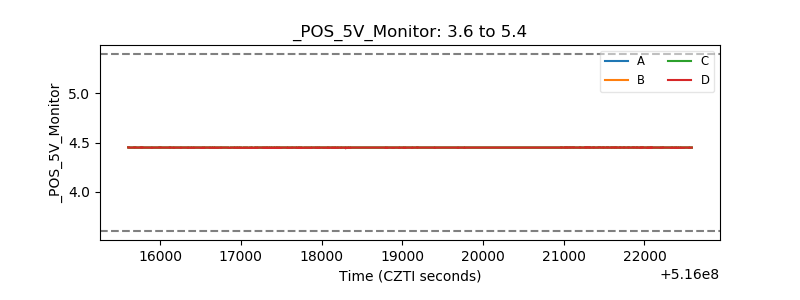 |
| _ROLL_ROT | 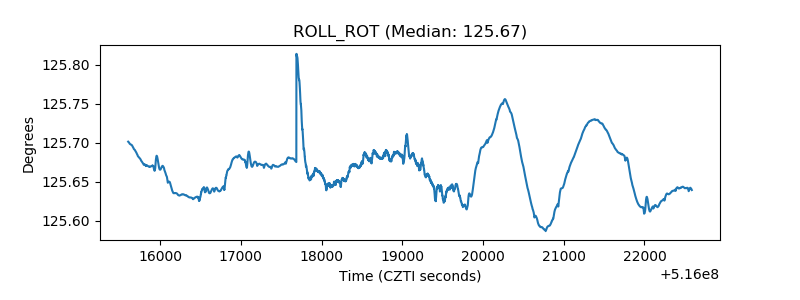 |
| _Roll_DEC | 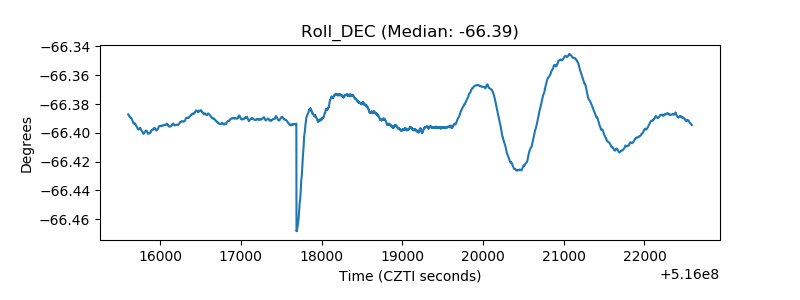 |
| _Roll_RA | 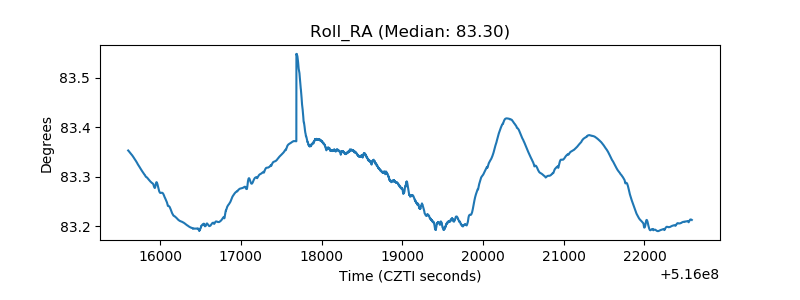 |
| Veto Counter | 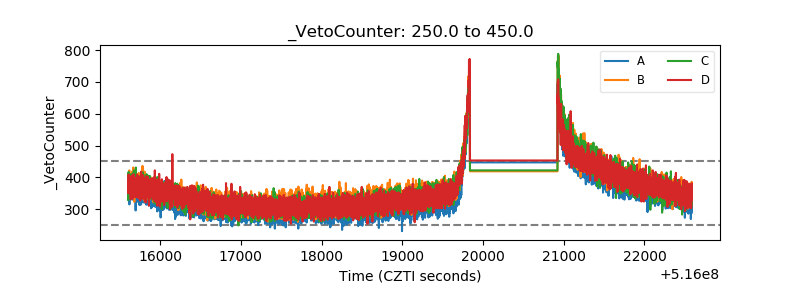 |